

Analys
SEB – Råvarukommentarer, 17 februari 2014

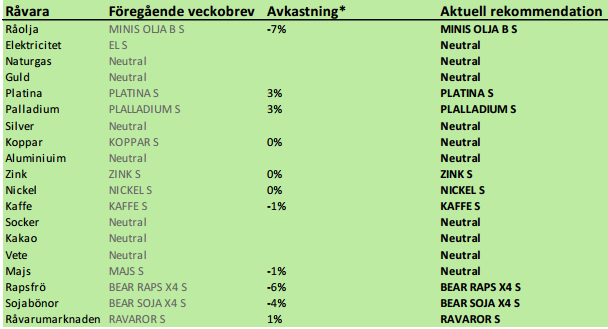
Rekommendationer
Råolja – Brent
Oljepriset fick styrka i veckan av att El Sharara-fältet i Libyen fick stängas igen. Marknaden har till viss del räknat in att Iran och Libyen ökar sin produktion i år. Gör de det, så faller priset. Gör de inte det, så stiger priset. Stängningen av El Sharara var alltså inte positiv ur den aspekten.
Kinas import av råolja var på rekordnivå i januari (liksom importstatistiken var för en rad råvaror).
Tekniskt är det möjligt att den konsolidering av priset vi sett efter uppgången från 106 dollar till 109 är en så kallad ”vimpel”. Om det är det, ska vi vänta oss ett utbrott på uppsidan, som har potential att ta priset till 111 dollar.
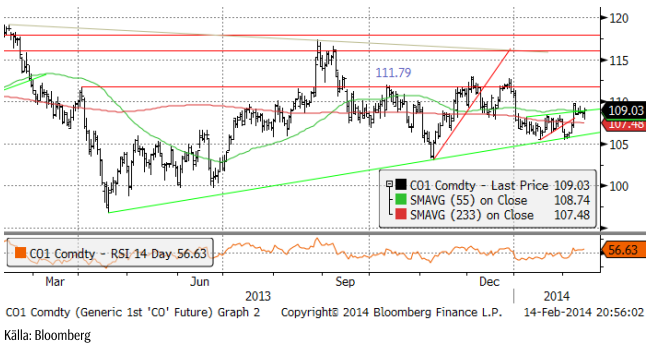
Fundamentalt genomgår oljemarknaden ett paradigmskifte där fracking radikalt ökar utbudet av råolja och minskar OPEC:s monopolställning. På längre sikt är det svårt att se något annat än ett stort prisfall på olja och vi vill handla oljemarknaden från den korta sidan. Tekniskt och i det mycket korta perspektivet av en vecka är det dock inte uteslutet, rentav troligt, att priset bryter upp och testar den övre delen av det ”gamla” prisintervallet. Med den reservationen behåller vi säljrekommendation, men rekommenderar inte att man går in i nya korta positioner på den här nivån, utan avvaktar bättre säljtillfällen.
Elektricitet
Elpriset bröt bröt stödet på 28.50 i fredags, vilket innebär att marknaden säger att skyddet mot ytterligare nedgångar har brutits. Det innebär att marknaden med hög sannolikhet kommer att handla ner priset ytterligare. Samtidigt är priset på en mycket låg nivå, som vi ser nedan.
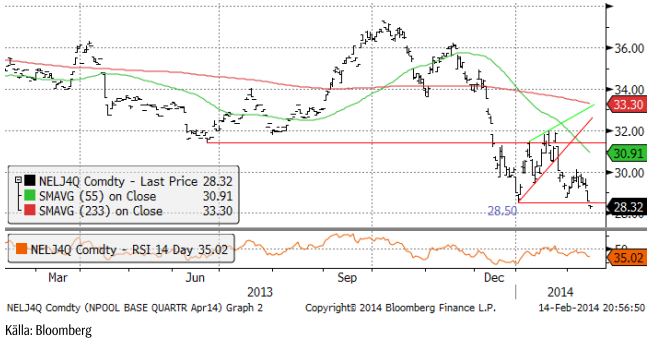
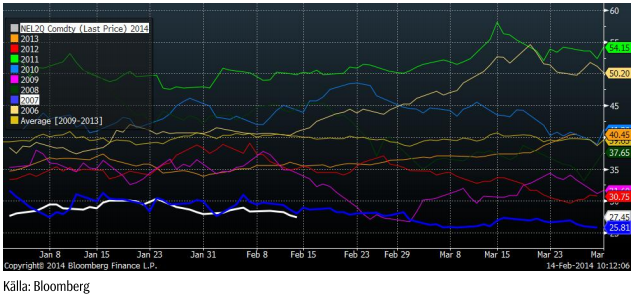
Det är omöjligt att säga var botten är. Det lägsta priset på Q2-kontraktet år 2007 var 25.8 euro per MWh, som vi ser i nedanstående diagram över det vid var tid kortaste Q2-kontraktets pris.
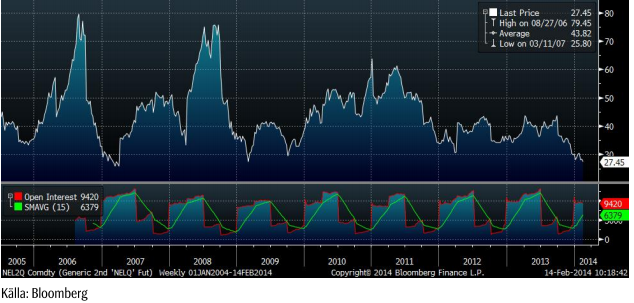
I diagrammet nedan ser vi prisutvecklingen på Q2-kontrakten under det första kvartalet varje år sedan 2006. Det andra kvartalets kontrakt är på den lägsta nivån sedan åtminstone 2006. I diagrammet nedan ser vi prisutvecklingen på Q2 2014 som den vita kurvan och Q2 2007 som den blå kurvan. Som vi ser, ser prisutvecklingen i år ut att röra sig snarlikt prisutvecklingen under 2007 sedan början av året. Om detta fortsätter kommer prisnedgången att fortsätta.
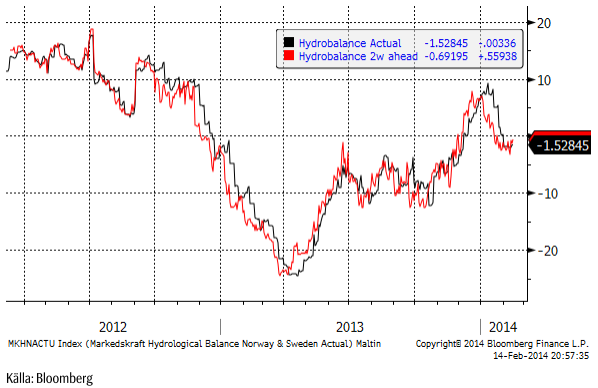
Prognosen för hydrologisk balans är enligt Markedskraft mer eller mindre oförändrad från förra veckan. Vädret i Norden är dock milt och nederbördsrikt just nu.
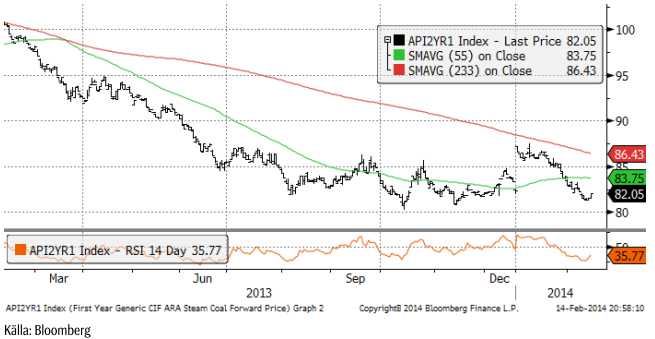
Terminspriset för leverans av kol nästa år har fallit från 87 dollar till 82.30. Priset är alltså tillbaka på bottennivåerna från oktober. Priset ligger under produktionskostnaden för gruvorna i Australien, Sydamerika och Kanada. Den australiensiska dollar har under samma period fallit med 8% mot US-dollarn, så där är en av förklaringarna till varför kolpriset inte har stigit i US-dollartermer. Som vi ser handlade kolpriset upp i fredags. Kanske är det en vändning?
Risken är stor att de stora kollagren (”kolhögar överallt”) i Europa och det milda vädret i Norden fortsätter att påverka elpriset nedåt resten av vårvintern. Tekniskt är stödet vid 28.50 brutet, vilket är en signal att ta stoppar. Rekommendationen kan inte bli annat än neutral som högst just nu. Man ska dock vara observant på om priset går tillbaka över 28.50 euro per MWh, med tanke på att priset är på absoluta bottennivåer i ett historiskt perspektiv.
Naturgas
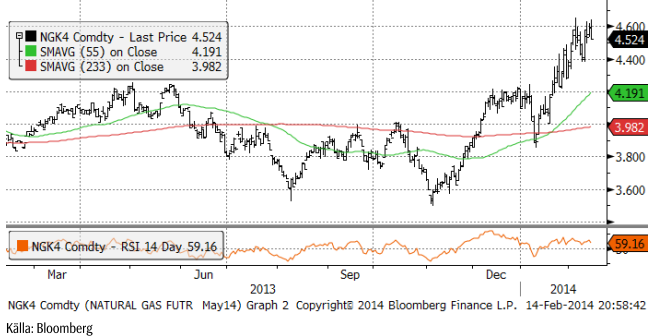
Det har fortsatt att vara kallt i USA, men nu börjar man se en omsvängning. Naturgaspriset har faktiskt backat lite från förra veckans 4.60 till 4.52 i fredags.
Basmetaller
Vi har en mer eller mindre positiv pristrend i basmetallerna som helhet, men med svag tendens sedan början av året. Den nedgången ”borde” vara nära sitt slut (eller inte). Den väntade optimismen efter det kinesiska nyåret har inte infunnit sig. Marknadens aktörer väntar fortfarande på ny information om tillståndet i den kinesiska efterfrågan. En pusselbit delades ut den här veckan. Januari månads importstatistik visade ovanligt hög import (+10%) och export (+10.6%). Importen intresserar naturligtvis råvarumarknaden mest. Importen av koppar och järnmalm nådde rekordnivåer. Marknaden blev dock inte fullt så imponerad, eftersom den höga importen hänger ihop med årsskifteseffekter. Som vanligt byggs det lager innan året och en del tyder på att varor har bokats och registrerats tidigare, men levereras på det nya året. Det finns en klar risk att februari-statistiken inte kommer att vara lika imponerande. Marknaden behöver se februaristatstiken för att få ökat förtroende.
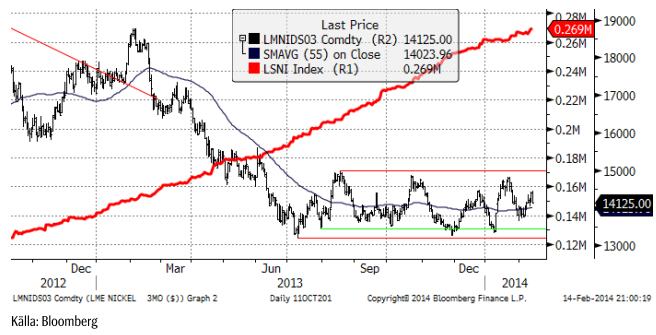
Från ett tradingperspektiv, föredrar vi fortfarande att handla nickel som om den var inom ett prisintervall, och inte i en trend, även om vi favoriserar den långa sidan mer än den korta.
Koppar
Som du kunnat läsa i inledningen till basmetallsegmentet här ovan, är vi lite oroade för kopparmarknaden. Risken för ökat utbud i kombination med skuldproblemen i Kina och risken för bankrutter inom den svarta banksektorn där, utgör en klar risk för nedsidan i kopparpriset. Just nu ser det dock inte ut att ske, i närtid i alla fall. Marknaden visar stark efterfrågan med backwardation i terminskurvan. Kinas import är extremt stark. Dessutom är vi just nu i de säsongsmässigt starka första och andra kvartalen. Vi skulle inte bli förvånade om kopparpriset testar de senaste toppnoteringarna någon gång de kommande månaderna.
Ur ett tradingperspektiv, gör osäkerheterna att vi inte vill ta någon position i metallen just nu. I vår fundamentala prognos för det genomsnittliga priset för året (7450), väntar vi oss en stark marknad under det första halvåret, sedan att priset handlar svagare i Q3 och med en möjlig återhämtning under Q4.
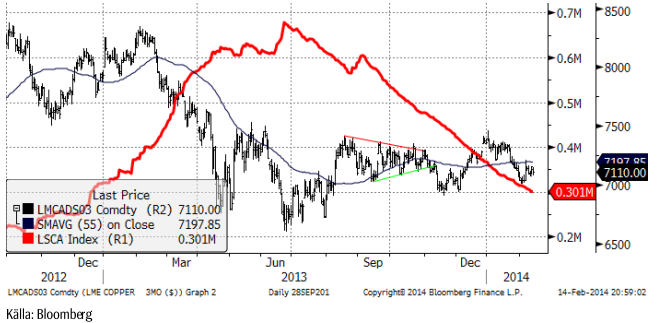
Vi rekommenderar neutral position i koppar.
Aluminium
Aluminium har handlat starkare sedan priset noterade femårslägsta den 3 februari vid 1671 dollar. Det är alltid riskabelt att vara kort råvaror som handlar så långt ner i förhållande till produktionskostnaden. Den fundamentala balansen visar äntligen på konstruktiva tendenser. Som väntat har blankarna börjat köpa tillbaka positioner.
Konsumenter har varit på köpsidan. De tar tillvara varje prisnedgång för att köpa ytterligare hedgar. Sammantaget har detta tagit tillbaka priset till den ”gamla” tekniska stödnivån vid ca 1750 dollar. Premierna i den amerikanska marknaden har planat ut vid de extrema nivåer kring 440 dollar per ton. Enligt våra källor i den fysiska marknaden skeppas nu aluminium från Mellanöstern till USA för att dra fördel av de höga premierna. CME har startat ett nytt terminskontrakt på den fysiska premien och det visar redan snabbt ökande öppen balans. LME planerar fortfarande att introducera ett kontrakt. De nya LME-reglerna för lagerhanteringen kommer på lite längre sikt att dämpa premierna. En annan effekt av den höga premien är att finansieringsaffärer inte rullas framåt, när contangot mellan cash + premium till termin (utan premium) på LME inte ger tillräckligt avans. Risken för högre räntor i och med att FED har inlett tapering och att klockan tickar för nästa räntehöjningscykel påverkar sannolikt också.
I vilket fall, finns ett behov för ytterligare minskning i produktionen av aluminium. Så länge detta inte materialiseras, finns risken att aluminiummarknaden går in i överskott igen, om vi inte får se starkare efterfrågan än förväntat.
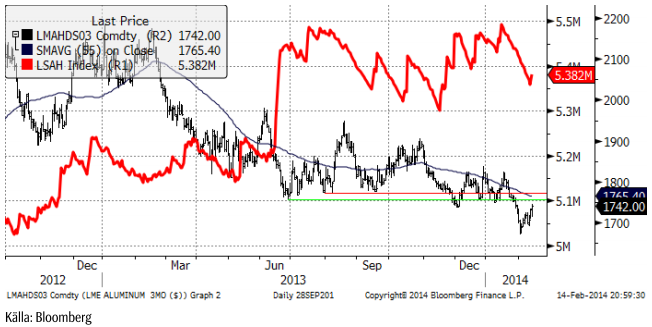
Vi fortsätter med neutral rekommendation på aluminium.
Zink
Zink har gjort imponerande vinster de senaste veckorna. Samtidigt, som vi noterade för ett par veckor sedan, har styrkan mattats av oron i tillväxtländerna. Terminsmarknaden handlar fortfarande cash till 3-månaders på samma nivå och längre kontrakt med ett litet contango. Givet att balanserna på längre sikt förbättras från 2015 och framåt, tycker vi att kurvan är ganska billig.
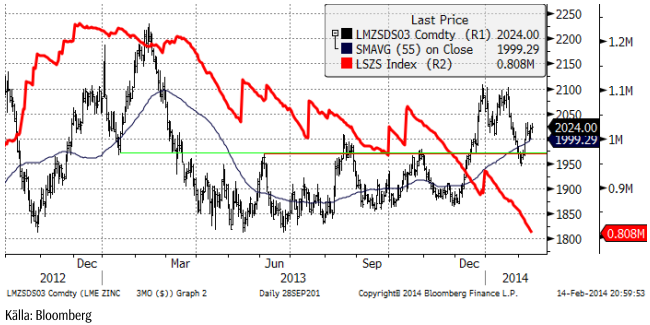
Vi rekommenderar köp av ZINK S eller BULL ZINK X4 S.
Nickel
Nickel handlar mitt i prisintervallet, vid 14,200 dollar. Det återspeglar osäkerheten kring det indonesiska exportförbudet. Marknadens aktörer drar sig för att ta positioner i avvaktan på nyheter från den indonesiska regeringen. Värt att notera är att priset på nickelmalm från Malaysia, som delvis är ett alternativ för NPI-producenter, har gått upp i pris. Malm inom Kina blir också dyrare. Scenariot vi beskrivit tidigare för nickel är i stort sett fortfarande relevant och innebär att det finns en begränsad nedsida i nickelpriset. Risken är på uppsidan för resten av året.
Guld
Det är nu tydligt att guld verkligen noterade en botten vid 1200 dollar per uns. Fredagens handel var haussartad. Det är dock vanligt att det sista man ser av en prisuppgång i guld är en ”spik” av det slaget. Det känns inte rätt att så här sent i en uppgång som pågått i två månader, gå in och köpa. Vi tycker det är bättre att avvakta den rekyl som brukar följa.
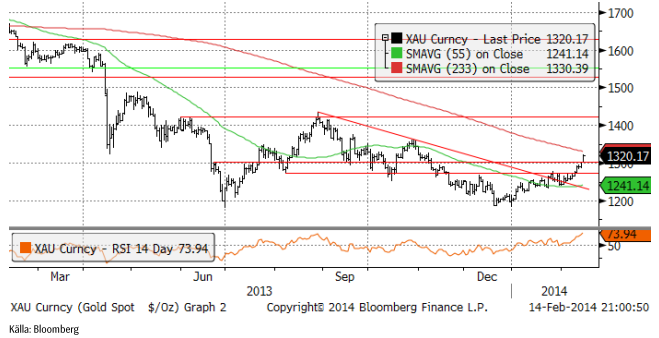
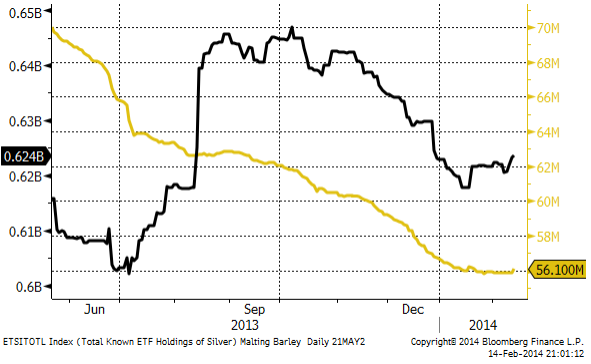
ETF-statistiken visar infllöden i silver-ETF:er (svart kurva) men inte lika tydligt i ETF-er på guld (gul kurva).
Vi fortsätter tills vidare med neutral vy på guld.
Silver
Silver bröt motståndet i fredags och steg kraftigt. Prisrörelsen var mycket snabb och priset är nu nästan uppe vid nästa motstånd, vilket gör att det är för sent att rekommendera köp.
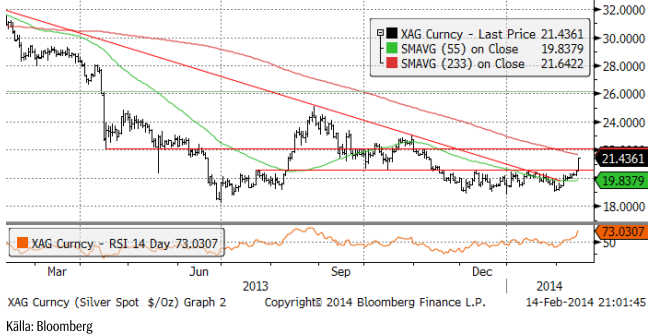
Vi fortsätter med neutral vy på silver.
Platina & Palladium
Platina, trots sin mycket lugnare utveckling än både guld och silver, har ett marknadsbeteende som i början av en trendvändning uppåt. Rekylen nedåt efter uppgången i början på året stannade på en högre nivå än botten i december. Det är ett positivt tecken. Trendlinjen för den fallande pristrenden bröts i början av januari. Även om det skulle komma en liten rekyl nedåt nu, skulle det inte förändra bilden av att en större trendvändning är på gång.
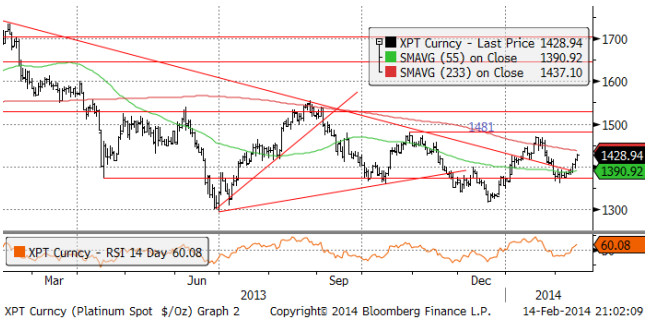
Palladium, där prisuppgången varit snabb seden botten för ett par veckor sedan, mötte säljare i fredags, vilket fick priset att stänga långt under dagens högsta notering. Palladium är alltså fortsatt ”cappad” på uppsidan och eftersom priset redan är ”högt” inom intervallet, rekommenderar vi neutral position.
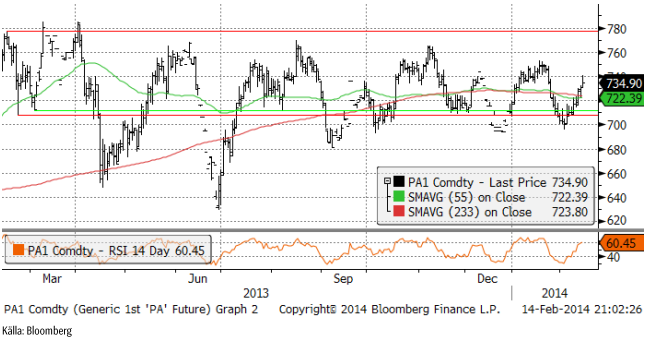
Vi rekommenderar alltså köp av både platina och neutral i palladium.
Kaffe
Det har varit skyfall i Sao Paulo de senaste dagarna. Regnvädret rör sig norrut mot kaffeodlingarna i Minas Gerais. Prisuppgången stannade vid en nivå kring 140 cent per pund när väderleksprognoserna visade att regnvädret faktiskt var på väg norrut. Tekniskt har priset bildat en ”vimpel” vid 140 cent och en sådan formation brukar följas av antingen ett brott uppåt (mot 160 cent) eller ett fall tillbaka. Marknaden försöker nu som bäst få grepp om vad den långsiktiga effekten av torkan är på kaffeskörden i Brasilien. Det är möjligt att man kommer fram till att minskningen i skörd de kommande åren är så stor att priset borde gå upp. Vi ska komma ihåg att USDA genom en survey under hösten räknat ut att den genomsnittliga produktionskostnaden i Brasilien är 147 cent. Priset på 140 cent idag är alltså inte så högt att det skulle locka så många kaffeodlare att expandera. Bortfallen produktion kanske inte ersätts. Det talar för en fortsatt prisuppgång.
Vietnam rapporterade att exporten i januari var 36% lägre än förra året.
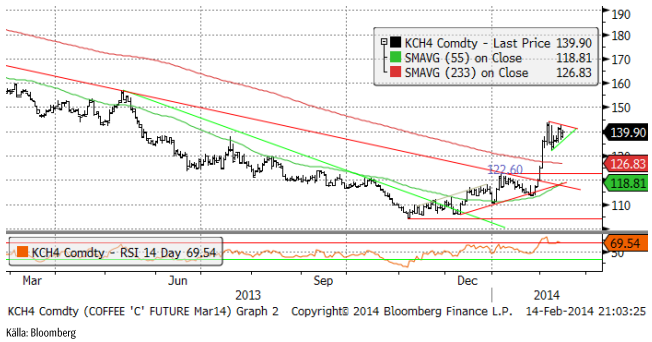
Vi fortsätter med köprekommendation.
Det finns nu också mini futures på kaffe, som erbjuder högre hävstång. Se SEB-bankens utbud.
[box]SEB Veckobrev Veckans råvarukommentar är producerat av SEB Merchant Banking och publiceras i samarbete och med tillstånd på Råvarumarknaden.se[/box]
Disclaimer
The information in this document has been compiled by SEB Merchant Banking, a division within Skandinaviska Enskilda Banken AB (publ) (“SEB”).
Opinions contained in this report represent the bank’s present opinion only and are subject to change without notice. All information contained in this report has been compiled in good faith from sources believed to be reliable. However, no representation or warranty, expressed or implied, is made with respect to the completeness or accuracy of its contents and the information is not to be relied upon as authoritative. Anyone considering taking actions based upon the content of this document is urged to base his or her investment decisions upon such investigations as he or she deems necessary. This document is being provided as information only, and no specific actions are being solicited as a result of it; to the extent permitted by law, no liability whatsoever is accepted for any direct or consequential loss arising from use of this document or its contents.
About SEB
SEB is a public company incorporated in Stockholm, Sweden, with limited liability. It is a participant at major Nordic and other European Regulated Markets and Multilateral Trading Facilities (as well as some non-European equivalent markets) for trading in financial instruments, such as markets operated by NASDAQ OMX, NYSE Euronext, London Stock Exchange, Deutsche Börse, Swiss Exchanges, Turquoise and Chi-X. SEB is authorized and regulated by Finansinspektionen in Sweden; it is authorized and subject to limited regulation by the Financial Services Authority for the conduct of designated investment business in the UK, and is subject to the provisions of relevant regulators in all other jurisdictions where SEB conducts operations. SEB Merchant Banking. All rights reserved.

Rebounding along with most markets. But concerns over solidity of Gaza peace may also contribute. Brent crude fell 0.8% yesterday to $61.91/b and its lowest close since May this year. This morning it is bouncing up 0.9% to $62.5/b along with a softer USD amid positive sentiment with both equities and industrial metals moving higher. Concerns that the peace in Gaza may be less solid than what one might hope for also yields some support to Brent. Bets on tech stocks are rebounding, defying fears of trade war. Money moving back into markets. Gold continues upwards its strong trend and a softer dollar helps it higher today as well.

US crude & products probably rose 5.6 mb last week (API) versus a normal seasonal decline of 2.4 mb. The US API last night partial and thus indicative data for US oil inventories. Their data indicates that US crude stocks rose 7.4 mb last week, gasoline stocks rose 3.0 mb while Distillate stocks fell 4.8 mb. Altogether an increase in commercial crude and product stocks of 5.6 mb. Commercial US crude and product stocks normally decline by 2.4 mb this time of year. So seasonally adjusted the US inventories rose 8 mb last week according to the indicative numbers by the API. That is a lot. Also, the counter seasonal trend of rising stocks versus normally declining stocks this time of year looks on a solid pace of continuation. If the API is correct then total US crude and product stocks would stand 41 mb higher than one year ago and 6 mb higher than the 2015-19 average. And if we combine this with our knowledge of a sharp increase in production and exports by OPEC(+) and a large increase in oil at sea, then the current trend in US oil inventories looks set to continue. So higher stocks and lower crude oil prices until OPEC(+) switch to cuts. Actual US oil inventory data today at 18:00 CET.
US commercial crude and product stocks rising to 1293 mb in week 41 if last nights indicative numbers from API are correct.

Crude oil soon coming to a port near you. OPEC has lifted production sharply higher this autumn. At the same time demand for oil in the Middle-East has fallen as we have moved out of summer heat and crude oil burn for power for air-conditioning. The Middle-East oil producers have thus been able to lift exports higher on both accounts. Crude oil and condensates on water has shot up by 177 mb since mid-August. This oil is now on its way to ports around the world. And when they arrive, it will likely help to lift stocks onshore higher. That is probably when we will lose the last bit of front-end backwardation the the crude oil curves. That will help to drive the front-month Brent crude oil price down to the $60/b line and revisit the high $50ies/b. Then the eyes will be all back on OPEC+ when they meet in early November and then again in early December.
Crude oil and condensates at sea have moved straight up by 177 mb since mid-August as OPEC(+) has produced more, consumed less and exported more.

When it starts to move lower it moves rather quickly. Gaza, China, IEA. Brent crude is down 2.1% today to $62/b after having traded as high as $66.58/b last Thursday and above $70/b in late September. The sell-off follows the truce/peace in Gaze, a flareup in US-China trade and yet another bearish oil outlook from the IEA.
A lasting peace in Gaze could drive crude oil at sea to onshore stocks. A lasting peace in Gaza would probably calm down the Houthis and thus allow more normal shipments of crude oil to sail through the Suez Canal, the Red Sea and out through the Bab-el-Mandeb Strait. Crude oil at sea has risen from 48 mb in April to now 91 mb versus a pre-Covid normal of about 50-60 mb. The rise to 91 mb is probably the result of crude sailing around Africa to be shot to pieces by the Houthis. If sailings were to normalize through the Suez Canal, then it could free up some 40 mb in transit at sea moving onshore into stocks.
The US-China trade conflict is of course bearish for demand if it continues.
Bearish IEA yet again. Getting closer to 2026. Credibility rises. We expect OPEC to cut end of 2025. The bearish monthly report from the IEA is what it is, but the closer we get to 2026, the more likely the IEA is of being ball-park right in its outlook. In its monthly report today the IEA estimates that the need for crude oil from OPEC in 2026 will be 25.4 mb/d versus production by the group in September of 29.1 mb/d. The group thus needs to do some serious cutting at the end of 2025 if it wants to keep the market balanced and avoid inventories from skyrocketing. Given that IEA is correct that is. We do however expect OPEC to implement cuts to avoid a large increase in inventories in Q1-26. The group will probably revert to cuts either at its early December meeting when they discuss production for January or in early January when they discuss production for February. The oil price will likely head yet lower until the group reverts to cuts.
Dubai: The Mid-East anchor dragging crude oil lower. Surplus emerging in Mid-East pricing. Crude oil prices held surprisingly strong all through the summer. A sign and a key source of that strength came from the strength in the front-end backwardation of the Dubai crude oil curve. It held out strong from mid-June and all until late September with an average 1-3mth time-spread premium of $1.8/b from mid-June to end of September. The 1-3mth time-spreads for Brent and WTI however were in steady deterioration from late June while their flat prices probably were held up by the strength coming from the Persian Gulf. Then in late September the strength in the Dubai curve suddenly collapsed. Since the start of October it has been weaker than both the Brent and the WTI curves. The Dubai 1-3mth time-spread now only stands at $0.25/b. The Middle East is now exporting more as it is producing more and also consuming less following elevated summer crude burn for power (Aircon) etc.
The only bear-element missing is a sudden and solid rise in OECD stocks. The only thing that is missing for the bear-case everyone have been waiting for is a solid, visible rise in OECD stocks in general and US oil stocks specifically. So watch out for US API indications tomorrow and official US oil inventories on Thursday.
No sign of any kind of fire-sale of oil from Saudi Arabia yet. To what we can see, Saudi Arabia is not at all struggling to sell its oil. It only lowered its Official Selling Prices (OSPs) to Asia marginally for November. A surplus market + Saudi determination to sell its oil to the market would normally lead to a sharp lowering of Saudi OSPs to Asia. Not yet at least and not for November.
The 5yr contract close to fixed at $68/b. Of importance with respect to how far down oil can/will go. When the oil market moves into a surplus then the spot price starts to trade in a large discount to the 5yr contract. Typically $10-15/b below the 5yr contract on average in bear-years (2009, 2015, 2016, 2020). But the 5yr contract is usually pulled lower as well thus making this approach a moving target. But the 5yr contract price has now been rock solidly been pegged to $68/b since 2022. And in the 2022 bull-year (Brent spot average $99/b), the 5yr contract only went to $72/b on average. If we assume that the same goes for the downside and that 2026 is a bear-year then the 5yr goes to $64/b while the spot is trading at a $10-15/b discount to that. That would imply an average spot price next year of $49-54/b. But that is if OPEC doesn’t revert to cuts and instead keeps production flowing. We think OPEC(+) will trim/cut production as needed into 2026 to prevent a huge build-up in global oil stocks and a crash in prices. But for now we are still heading lower. Into the $50ies/b.
Some rebound but not much. Brent crude rebounded 1.5% yesterday to $65.47/b. This morning it is inching 0.2% up to $65.6/b. The lowest close last week was on Thursday at $64.11/b.
The curve structure is almost as week as it was before the weekend. The rebound we now have gotten post the message from OPEC+ over the weekend is to a large degree a rebound along the curve rather than much strengthening at the front-end of the curve. That part of the curve structure is almost as weak as it was last Thursday.
We are still on a weakening path. The message from OPEC+ over the weekend was we are still on a weakening path with rising supply from the group. It is just not as rapidly weakening as was feared ahead of the weekend when a quota hike of 500 kb/d/mth for November was discussed.
The Brent curve is on its way to full contango with Brent dipping into the $50ies/b. Thus the ongoing weakening we have had in the crude curve since the start of the year, and especially since early June, will continue until the Brent crude oil forward curve is in full contango along with visibly rising US and OECD oil inventories. The front-month Brent contract will then flip down towards the $60/b-line and below into the $50ies/b.
At what point will OPEC+ turn to cuts? The big question then becomes: When will OPEC+ turn around to make some cuts? At what (price) point will they choose to stabilize the market? Because for sure they will. Higher oil inventories, some more shedding of drilling rigs in US shale and Brent into the 50ies somewhere is probably where the group will step in.
There is nothing we have seen from the group so far which indicates that they will close their eyes, let the world drown in oil and the oil price crash to $40/b or below.
The message from OPEC+ is also about balance and stability. The world won’t drown in oil in 2026. The message from the group as far as we manage to interpret it is twofold: 1) Taking back market share which requires a lower price for non-OPEC+ to back off a bit, and 2) Oil market stability and balance. It is not just about 1. Thus fretting about how we are all going to drown in oil in 2026 is totally off the mark by just focusing on point 1.
When to buy cal 2026? Before Christmas when Brent hits $55/b and before OPEC+ holds its last meeting of the year which is likely to be in early December.
Brent crude oil prices have rebounded a bit along the forward curve. Not much strengthening in the structure of the curve. The front-end backwardation is not much stronger today than on its weakest level so far this year which was on Thursday last week.

The front-end backwardation fell to its weakest level so far this year on Thursday last week. A slight pickup yesterday and today, but still very close to the weakest year to date. More oil from OPEC+ in the coming months and softer demand and rising inventories. We are heading for yet softer levels.


Vad guldets uppgång egentligen betyder för världen

Spotpriset på guld över 4300 USD och silver över 54 USD
Crude oil soon coming to a port near you

Guld och silver stiger hela tiden mot nya höjder
The Mid-East anchor dragging crude oil lower

OPEC+ missar produktionsmål, stöder oljepriserna

Ett samtal om guld, olja, fjärrvärme och förnybar energi

Goldman Sachs höjer prognosen för guld, tror priset når 4900 USD
Guld nära 4000 USD och silver 50 USD, därför kan de fortsätta stiga
Are Ukraine’s attacks on Russian energy infrastructure working?
-
 Nyheter3 veckor sedan
OPEC+ missar produktionsmål, stöder oljepriserna
-
 Nyheter4 veckor sedan
Ett samtal om guld, olja, fjärrvärme och förnybar energi
-
 Nyheter2 veckor sedan
Goldman Sachs höjer prognosen för guld, tror priset når 4900 USD
-
 Nyheter2 veckor sedan
Guld nära 4000 USD och silver 50 USD, därför kan de fortsätta stiga
-
Analys4 veckor sedan
Are Ukraine’s attacks on Russian energy infrastructure working?
-

 Nyheter3 veckor sedan
Blykalla och amerikanska Oklo inleder ett samarbete
-

 Nyheter4 veckor sedan
Guldpriset uppe på nya höjder, nu 3750 USD
-
Nyheter3 veckor sedan
Ett samtal om guld, olja, koppar och stål