

Analys
SEB – Råvarukommentarer, 14 oktober 2013

Rekommendationer
 *) Avkastningen anges för 1:1 certifikaten där både BULL och 1:1 certifikat är angivna.
Inledning
Vi går över till neutral rekommendation på EL S och BULL EL X4 S. Anledningen är att elpriset stigit i veckan, medan kostnadsfaktorerna bakom: kolpris och utsläppsrätter fallit i pris. Vi tror att det finns potential för elpriset att backa och att man bör vänta ut den rekylen för att köpa igen – beroende på hur kol- och utsläppsrättsmarknaderna också utvecklar sig.
Guld och andra ädelmetaller har utvecklat sig svagt och testar just nu tekniska stöd. Om de bryts kan priserna falla ytterligare.
Många marknader som gått starkt och där vi haft rätt i våra rekommendationer som baserar sig på en allmän, men osynkroniserad återhämtning i råvarumarknaderna, ser att stå inför en rekyl nedåt. Det är ett helt naturligt marknadsbeteende och förändrar inte vår positiva grundsyn. Den allmänna rekommendationen blir då att vänta ut rekylen och försöka komma in i marknaden till bättre pris.
Råolja – Brent
Oljepriset steg med 1% förra veckan och OLJA S-certifikatet steg med 3%, delvis pga rabatten på terminerna, men till största delen på grund av att dollarn steg mot svenska kronor. Oljepriset slog i motståndet vid 112 dollar och stängde i fredags i 111 dollar per fat.
Amerikanska DOE publicerar ingen statistik, eftersom den delen av statsförvaltningen är stängd.
Frankrike har återigen fastställt förre presidenten Sarkozys förbud mot prospektering av skiffergas och skifferolja. Frankrike anses vara det land i Europa som har störst sådana resurser. I Brasilien, på land strax innanför semesterparadiset Natal har vad som förefaller vara en större oljefyndighet påträffats. Mexikos regering har fattat beslut att i grunden förbättra förutsättningarna för det nationella oljebolaget PEMEX. PEMEX har varit en sorglig historia, det mest plundrade oljebolaget bland plundrade oljebolag i världen. De har inte ens fått behålla nog med pengar i bolaget för att täta oljeläckor som är vida överstiger de från Deepwater Horizon i Mexikanska golfen. Än mindre syssla med normalt underhåll och naturligtvis inte utveckla ny produktion. Mexiko är ett mycket oljerikt land. Om Mexiko verkligen börjar driva PEMEX effektivt kan produktionen öka väsentligt med påverkan på oljepriset. Statlig produktionsbeskattning som kostnadsdrivare i oljepriset förklaras av Marian Radetzki i artikeln ”Politiska förvecklingar – inte OPEC:s marknadskontroll – förklarar oljeprisets fenomenala utveckling” i Ekonomisk Debatt nummer 2 / 2013.
En lägre internationell handel med är en direkt konsekvens av att USA:s inhemska produktion är på väg mot en ny rekordproduktion med minskat importbehov som följd. USA lär ha svårt att exportera olja, pga den 100 år gamla ”Jones Act”, som dikterar att sådan export måste ske på fartyg byggda i USA, registrerade och ägda av en amerikan och ha amerikansk besättning och kapten. Idag finns knappast någon sådan oljetanker.
SEB tror att priset rör sig ner mot 105 dollar mot slutet av året. På kort sikt är det intressant att se om priset bryter igenom motståndet på 112 dollar.
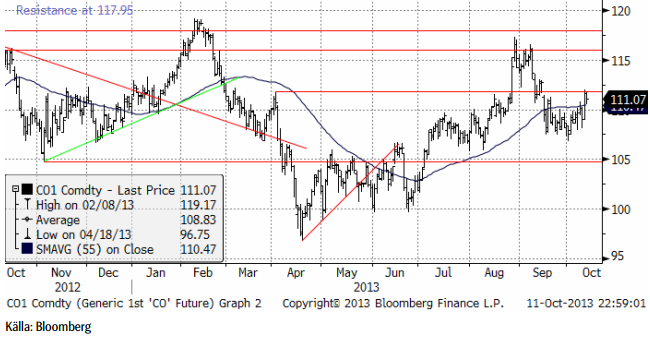
På grund av den attraktiva rabatten på terminer i oljemarknaden och för att vi inte ser någon omedelbar risk för väsentligt lägre pris på olja rekommenderar vi innehav i OLJA S.
Elektricitet
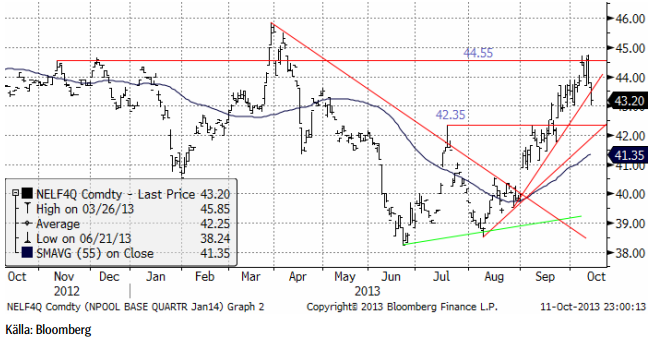
Elpriset backade rejält i fredags. Priset nådde i veckan upp till 44.60 euro per MWh, men orkade inte genom det motstånd som väntade där på 44.55.
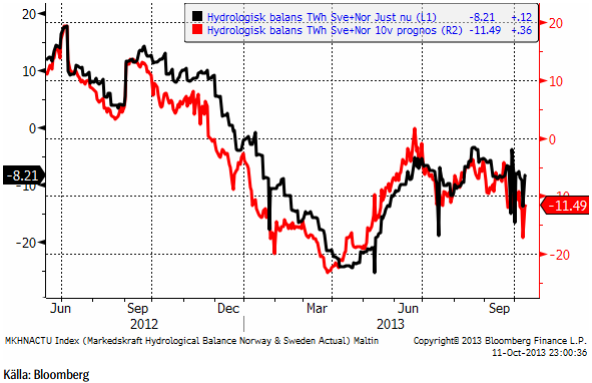
Markedskrafts prognos för hydrologisk balans, har fallit till -11.49 TWh för 10-veckorsprognosen.
Kontraktet för den närmaste månadens leverans av energikol har backat.
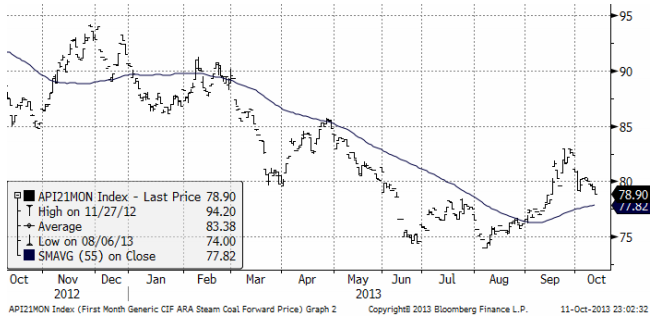
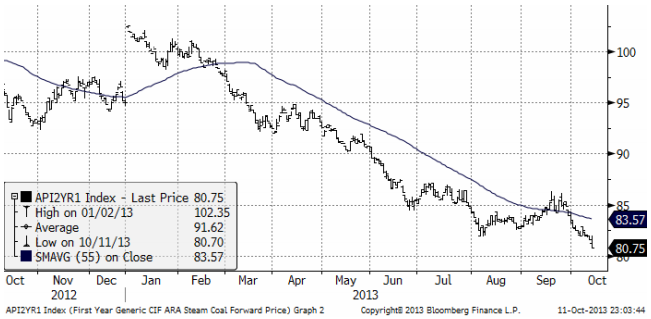
Årskontraktet på energikol har dock fallit till en ny bottennotering på 80.75 dollar per ton.
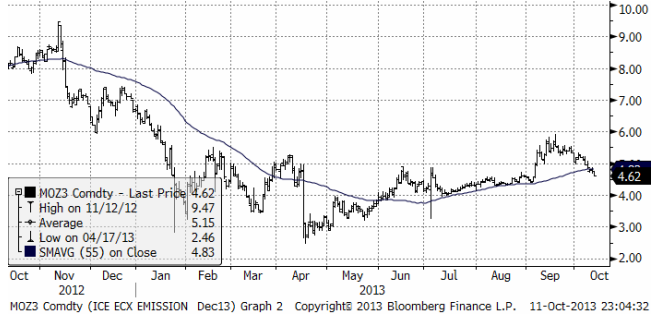
Priset på utsläppsrätter har också backat.
Vi har en långsiktigt positiv vy på elpriset baserat på en normalisering av marknaden för kol – drivet dels av begränsad produktionstillväxt pga det för låga priset och för att efterfrågan tar fart på grund av en konjunkturuppgång. Elpriset har den senaste tiden gått upp kraftigt på Nasdaq, men de faktorer vi baserar vår prognos på, har gått ner i pris.
Vi rekommenderar att man tar hem vinster i EL S och BULL EL X4 S och vi rekommenderar neutral position. Kommer priset på kvartalskontraktet ner till 42 till 42.50 euro kan man kanske köpa igen, om en botten där tycks etablera sig. Faktorerna bakom det långsiktiga ”caset” tror vi fortfarande på, men veckans prisnedgång i dessa: kol och utsläppsrätter – motiverar även en nedgång i elpriset, som vi inte har sett fullt ut än. Vi vill understryka att den här rekommendationen om vinsthemtagning och neutral position handlar om ”timing” och inte om det långsiktiga ”investerings-caset”.
Naturgas
Naturgasprisets rekyl nedåt i slutet av september stängde på en högre nivå än nedgången i augusti, vilket är ett styrketecken. 4 dollar per MMBtu är dock ett motstånd på ovansidan.
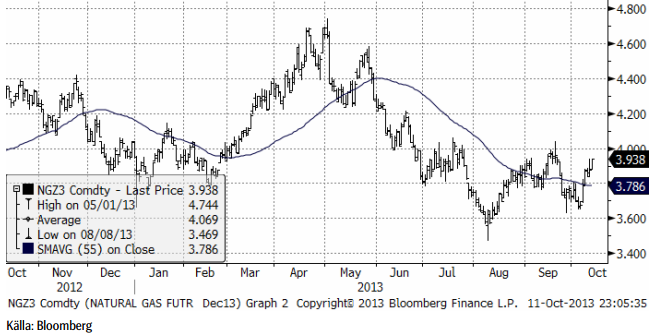
Vi har neutral rekommendation.
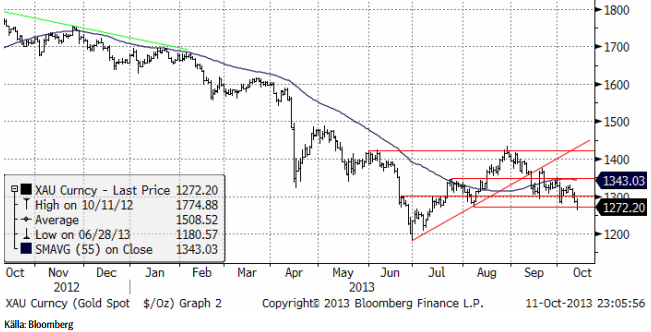
Guld & Silver
Guldpriset föll med 3% i veckan och stängde precis på ett det sista tekniska stödet på nedsidan innan priset faller till 1200 dollar. Tekniskt ser det ut som om marknaden kommer att handla ner till 1200 dollar igen och det finns inga garantier för att priset på guld inte går ännu lägre. Andra råvarumarknader som haft ett överkott i produktionen sedan årsskiftet 2010/2011, när konjunkturen vände ner och produktionen av råvaror kom ikapp efterfrågetakten, har vänt upp när nu konjunkturen vänt uppåt igen och de låga priserna fått producenter att dra ner. Detta har inte hänt i guldmarknaden. Guldproducenter har alltid förefallit mer övertygade om just deras råvaras förestående hausse än andra råvaruproducenter har gjort. Jag känner inte till någon guldproducent som kastat in handduken på grund av kostnader, om vi bortser från bristfälligt finansierade prospekteringsbolag. De flesta tolkar en förestående lösning på budgetkrisen i USA som negativt för guldet, dvs som en minskad takt i skuldökningen i USA; en förlust för den sittande presidenten. Detta har påverkat guldmarknaden negativt. Medan Kinas inflation, enligt Kinas statistiska centralbyrå, är 2.6%, är verkligheten av råvaruprisboomen där förmodligen betydligt högre, men Kinas guldköp dominerar inte över USA:s. Kinas ekonomi är än så länge ungefär lika kraftfull som Italiens. Italienarna är i och för sig oroliga för en skatt på sparande. IMF kom i veckan ut med en rapport som föreslår en skatt på 10% av eurozonens medborgares sparande som en metod att lösa skuldkrisen. Det är en metod som Italien använde sig av för att lösa skuldkrisen efter valutakrisen i början av 1990-talet. Det naturliga för de flesta är dock att ta ut pengarna från bankkontot, inte att köpa guld.
Guldpriset har inte ändrat trend än. Och det troliga är att nedgången fortsätter.
Nedan ser vi kursdiagrammet för silver i dollar per troy ounce. Det ser ut som om 20 dollar ska testas igen.
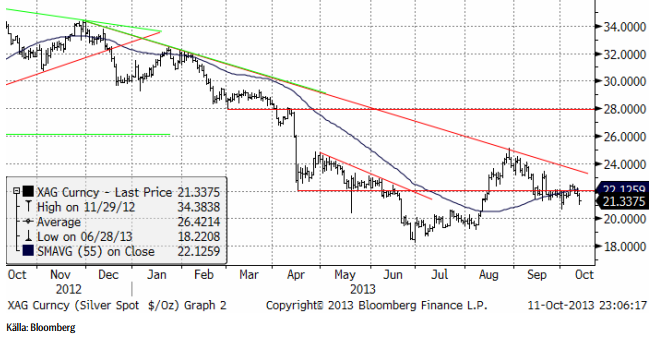
Vi fortsätter att vara neutrala guld och silver och skulle inte vilja köpa någon av dem idag.
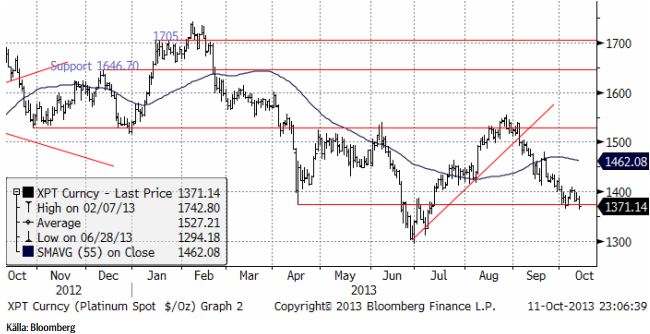
Platina & Palladium
Platinapriset stängde i fredags på ett teniskt stöd. Det har varit en solid nedgång sedan månadsskiftet augusti-september och det marknaden är i behov av en uppgång, men om guldmarknaden faller igenom sitt stöd, bör även platina fall ner mot 1300 dollar. Priset står just nu och väger. Jag tror mer på en nedgång. Om priset går över 1400 dollar har vi däremot en köpsignal, enligt teknisk analys.
Nedan ser vi frontmånadskontraktet på palladium. Palladium ligger fortfarande i en slags sidledes rörelse, utan trend.
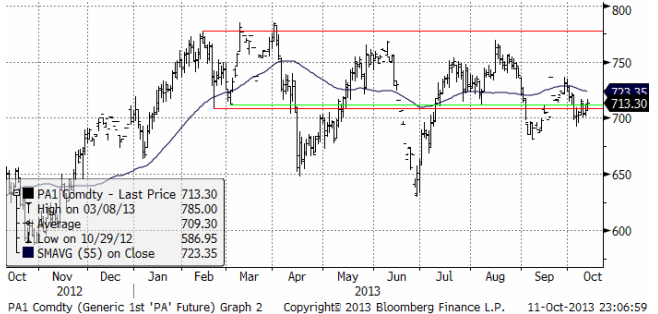
Vi är för närvarande neutrala platina och palladium, men om palladium skulle falla bara något lite, skulle vi vilja haka på och ta en kort position via BEAR PALLAD X4 S. Vi skulle absolut inte vilja köpa någon av dem.
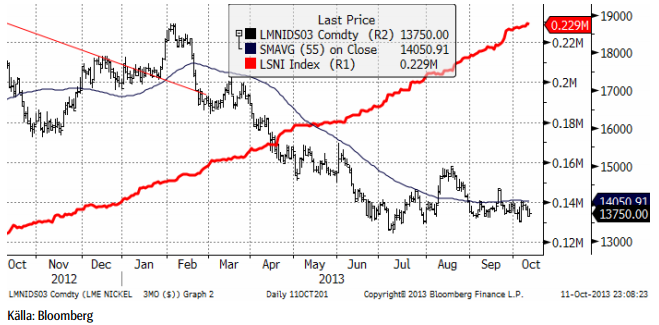
Koppar
Den årliga höjdpunkten för metallbranschen, ”LME Week” inföll förra veckan. Huvudtalaren på LME-veckans seminarium sammanfattade sin syn på metallmarknaden med uttalandet : ”en fast golv och ett mjukt tak” De flesta som samlades i London för den traditionella LME – veckan höll nog med om det, åtminstone vad gäller golvet. Diskussionerna på de olika konferenserna och mötena handlade mest om mjukheten i taket. De flesta metallmarknader präglas av ett överutbud, men i olika faser. Vissa marknaders överutbud ökar och andra minskar.
Den nye VD:n för LME talade om ökad öppenhet, utan att ge några konkreta exempel på vad det kan innebära. Han nämnde att den nye kinesiska börsen HEX ägande kan innebära några nya produkter, t ex på järnmalm och kol.
I veckan annonserade CME att man introducerar ett aluminiumkontrakt som ska ha månadsvisa terminer. LME har som bekant dagliga, dvs det finns alltid ett kontrakt som går i leverans varje dag. CME äger via sitt dotterbolag NYMEX (COMEX), redan en börs för aluminium, som är futures. Den har dock aldrig varit särskilt populär i jämförelse med LME:s kontrakt. Bakgrunden till att CME startar handel i en kopia av LME:s kontrakt är den kritik som riktats mot köbildningen vid LME:s lagerhus, som gjort att marknaden för fysisk metall avviker prismässigt väldigt mycket från LME:s kontrakt. CME skulle använda sina egna lagerhus i USA, enligt den pressrelease som publicerades i veckan. LME:s flytt till Kina, sannolikt motiverad till inte liten del av EU:s nya lagförslag MiFID 2, som allvarligt kommer att förstöra möjligheterna att handla terminer på råvaror inom EU, öppnar för ny konkurrens från CME i västvärlden.
Handeln på börsen var av naturliga skäl tunn, i veckan som gick. Svaghet var tydlig i början av veckan, och i synnerhet koppar handlades ner, av allt att döma pga en stor säljorder. Mot slutet av veckan kom köparna in och handlade upp marknaderna igen. Koppar och nickel avslutade veckan 1 – 2% lägre, medan aluminium och zink stängde veckan upp i samma storleksordning. Lagren vid LME fortsatte att minska i veckan som gick och vi tror att kopparpriset kommer att testa motstånden på ovansidan från i somras.
Codelco publicerade premien för katoder för nästa år under helgen till förra veckan. Den hamnade på 112 dollar per ton, en höjning från årets 85 dollar. Det är ett tecken på den mindre smältverkskapaciteten, som orsakas av underhållsarbeten och nedläggningar.
Efterfrågan är god. Det har sagts att kopparmarknaden skulle behöva 1 mt / år mer produktionskapacitet per år för att hålla jämna steg med den långsiktiga efterfrågeökningen. Det låga priset nu är lite för lågt för att stimulera den här produktionsökningen.
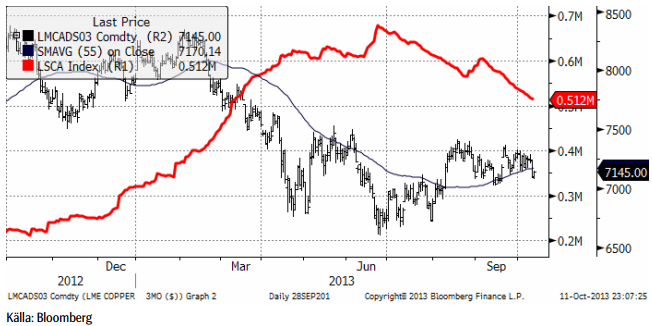
Vi rekommenderar köp av KOPPAR S.
Aluminium
Folk gick till LME-veckan med en baissig inställning till aluminium, men åkte nog hem något mindre negativa. I mitten av förra veckan visade en del analytiker ett mindre överskott (produktion > konsumtion) än tidigare och Alcoa publicerade sin kvartalsrapport i onsdags – som skrev om ett kommande underskott! Även om folk anser detta som tämligen osannolikt, räckte bränslet för en prisuppgång. Efter uppgången mot 1890 i fredags börjar marknaden se lite dyr ut istället. Det finns trots allt ett överskott och Kina investerar just nu i ny kapacitet istället för att dra ner. Alcoa behöll sin prognos på en stadig efterfrågeökning om 7% per år, vilket är i linje med, men något högt, jämfört med de flesta analytikers prognoser. Så länge utbudet ökar mindre än efterfrågan kommer det att ske en långsam, men stadig förbättring av den grundläggande balansen, men fortfarande finns det stora lager som måste betas av.
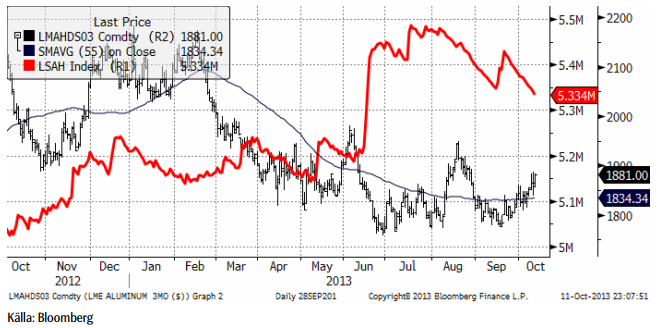
Vi har neutral rekommendation, men lutar mot en köprekommendation.
Zink
Zink har till viss del en liknande situation som aluminium, där Kina är mer eller mindre självförsörjande, med massor av smältverkskapacitet. De långsiktigt positiva utsikterna för zink beror på gruvsektorn och nedläggningar under de kommande åren. Just nu finns det tillräckligt med material, men som vi har noterat går marknaden mot ett underskott. Detta kommer delvis även att komma från stigande efterfrågan. Bilförsäljningen i Kina ökade med 21% i augusti till 1,59 miljoner. Bilindustrin är den viktigaste sektorn för zink. 50-60% av zinkkonsumtionen går till galvaniserat stål, och av detta används ca hälften som rostskyddat stål i bilar.
Tekniskt ser marknaden ut att ha etablerat en botten vid 1800 – 1850 dollar per ton. Samtidigt finns motstånd vid 1950 – 2000 dollar. Vi tror att dessa nivåer kommer att testas och slutligen brytas.
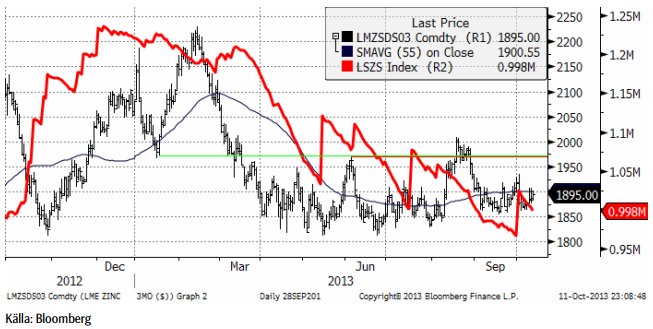
Vi fortsätter med en köprekommendation av ZINK S.
Nickel
Nickelpriset stängde veckan med ett litet plus, men tekniskt ser det ut som om det skulle kunna komma en vända ner till, innan priserna vänder upp.
Samtalen i London under LME-veckan var fokuserade på sannolikheten för ett indonesiskt exportförbud från januari 2014. Realpolitik indikerar dock att det inte kommer att bli ett förbud, därför att landet behöver exportintäkterna. De senaste två veckorna har ett par gruvor lagts ner: Falcondo i Dominikanska Republiken med 15,000 ton årlig produktion av ferronickel och Votoantims gruva i Brasilien med 19,000 ton årlig produktion av nickel. När det gäller Kinas produktion av nickeltackjärn (NPI) menade personer på LME-veckan vi talat med att kostnaden snarare är på väg ner, än upp. Fokus fram till nyår kommer att ligga på hur Indonesien gör med sitt exportförbud.
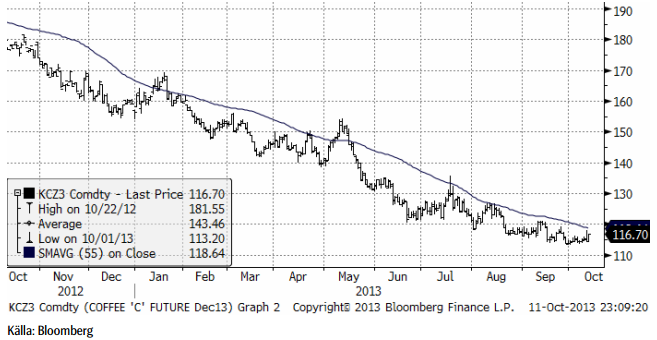
Kaffe
Kaffepriset noterade nya, fräscha, bottennoteringar i veckan som gick. Trenden är nedåtriktad. Vi väntar på en uppgång, men fortsätter att vänta av timing-skäl. På lite längre sikt borde kaffe vara en given vinnare.
Odlingsåret 2012/13 är nu avslutat i alla exportländer. International Coffee Organization skriver i sin senaste månadsrapport att total global produktion uppgår till 145.2 miljoner säckar (60 Kg). Detta är 12.8 miljoner säckar mer än 2011/12, en ökning med 9.6%. Robusta står för den största ökningen med 11.6% till 56.4 miljoner säckar, medan produktionsökningen av arabica var 8.4% till 88.8 miljoner säckar. Global produktion under 2012 (kalenderår) uppgår enligt ICO till 142 miljoner säckar och följer den ökningstakt om 2.4% som har registrerats de senaste fyra åren. Det råder alltså fortfarande en överproduktion i världen. Orsaken att de höga priserna får några år sedan ledde till ökad plantering av kaffebuskar. Det tar minst två år innan de
börjar ge skörd.
I Colombia, som sedan 2008/09 haft stora problem med bladmöglet ”roya”, har man ersatt odlingarna med nya sorter, som är resistenta mot bladmöglet. För två år sedan var produktionen nere i 7.7 miljoner säckar, men har skördat 9.93 miljoner säckar under 2012/13-säsongen, som slutade i september. Det är 1 miljon mer än USDA förutspått. Det är möjligt att Colombia kan nå 12 miljoner säckar under 2013/14, när de nya kaffebuskarna börjar bära frukt ordentligt för att nästa år kanske nå upp till 14
miljoner säckar.
I Vietnam, som väntat en rekordskörd av robusta har drabbats av skyfall, vilket fördröjer skörden.
Brasilianska Cepea säger att det är först under 2014 som regeringens interventionsköp kan börja visa sig i priserna.
Vi behåller tills vidare neutral rekommendation, tills vi ser tecken på ett trendbrott.
[box]SEB Veckobrev Veckans råvarukommentar är producerat av SEB Merchant Banking och publiceras i samarbete och med tillstånd på Råvarumarknaden.se[/box]
Disclaimer
The information in this document has been compiled by SEB Merchant Banking, a division within Skandinaviska Enskilda Banken AB (publ) (“SEB”).
Opinions contained in this report represent the bank’s present opinion only and are subject to change without notice. All information contained in this report has been compiled in good faith from sources believed to be reliable. However, no representation or warranty, expressed or implied, is made with respect to the completeness or accuracy of its contents and the information is not to be relied upon as authoritative. Anyone considering taking actions based upon the content of this document is urged to base his or her investment decisions upon such investigations as he or she deems necessary. This document is being provided as information only, and no specific actions are being solicited as a result of it; to the extent permitted by law, no liability whatsoever is accepted for any direct or consequential loss arising from use of this document or its contents.
About SEB
SEB is a public company incorporated in Stockholm, Sweden, with limited liability. It is a participant at major Nordic and other European Regulated Markets and Multilateral Trading Facilities (as well as some non-European equivalent markets) for trading in financial instruments, such as markets operated by NASDAQ OMX, NYSE Euronext, London Stock Exchange, Deutsche Börse, Swiss Exchanges, Turquoise and Chi-X. SEB is authorized and regulated by Finansinspektionen in Sweden; it is authorized and subject to limited regulation by the Financial Services Authority for the conduct of designated investment business in the UK, and is subject to the provisions of relevant regulators in all other jurisdictions where SEB conducts operations. SEB Merchant Banking. All rights reserved.

Market is starting to take US/Iran headlines with a pinch of salt. Brent crude rose $2.8/b yesterday to an official close of $112.1/b. But after that it traded as low as $108.05/b before ending late night at around $109.7/b. Through the day it traded in a range of $106.87 – 112.72/b amid a flurry of news or rumors from Iran and the US. ”US temporary sanctions during negotiations” (falls alarm). ”We will bomb Iran” (not anyhow),… etc. While the market is still fluctuating to this kind of news flow, it is starting to take such headlines with a pinch of salt.

We’ll see. Maybe, maybe not. The Brent M1 contract is trading at $110.2/b this morning which very close to the average ticks through yesterday of $110.4/b.
Trump with bearish, verbal intervention whenever Brent trades above $110/b it seems. What seems to be a pattern is that Trump states something like ”very good negotiations going on with Iran”, ”New leaders in Iran are great,..”, ”Great progress in negotiations,…”, ”Deal in sight,..” etc whenever the Brent M1 contract trades above $110/b. An effort to cool the market. These hot air verbal interventions from Trump used to have a heavy bearish impact on prices, but they now seems to have less and less effect unless they are backed by reality.
As far as we can see there has been no real progress in the negotiations between the US and Iran with both sides still standing by their previous demands.
Iran is getting stronger while the cease fire lasts making a return to war for Trump yet harder. Iran is naturally in constant preparation for a return to war given Trump’s steady threats of bombing Iran again. Iran is naturally doing what ever is possible to prepare for a return to war. And every day the cease fire lasts it is better prepared. This naturally makes it more and more difficult and dangerous for the US to return to warring activity versus Iran as the consequences for energy infrastructure in the Persian Gulf will be more and more severe the longer the cease fire lasts. Israel seems to see it this way as well. That the war is not won and that current frozen state of a cease fire gives Iran opportunity to rebuild military and politically.
Global inventories are drawing down day by day. How much? In the meantime the Strait of Hormuz stays closed. There is varying measures and estimates of how much global inventories are drawing down. Our rough estimate, back of the envelope, is that global inventories are drawing down by at least some 10 mb/d or about 300 mb/d in a balance between loss of supply versus demand destruction. Other estimates we see are a monthly draw of 250-270 mb/d. The IEA only ’measured’ a draw in global observable stocks of 117 mb in April with oil on water rising 53 mb while on shore stocks fell 170 mb. But global stocks are hard to measure with large invisible, unmeasured stocks. As such a back of the envelope approach may be better.
Oil products is what the world is consuming. Oil product prices likely to rise while product stocks fall. Strategic Petroleum Reserves (SPR) are predominantly crude oil. Discharging oil from OECD SPR stocks, a sharp reduction in Chinese crude imports and a reduction in global refinery throughput of 6-7 mb/d has helped to keep crude oil markets satisfactorily supplied. But global inventories are drawing down none the less. And oil products is really what the world is consuming. So if global refinery throughput stays subdued, then demand will eventually have to match the supply of oil products. The likely path forward this summer is a steady draw down in jet fuel, diesel and gasoline. Higher prices for these. Then, if possible, higher refinery throughput and higher usage of crude in response to very profitable refinery margins. And lastly sharper draw in crude stocks and higher prices for these. But some 6 mb/d of oil products used to be exported through the Strait of Hormuz. And it may not be so easy to ramp up refinery activity across the world to compensate. Especially as Ukraine continues to damage Russian refineries as well as Russian crude production and export facilities.
Watch oil product stocks and prices as well as Brent calendar 2027. What to watch for this summer is thus oil product inventories falling and oil product premiums to crude rising. Another measure to watch is the Brent crude 2027 contract as it rises steadily day by day as the Strait of Hormuz stays closed and global oil inventories decline. The latter is close to the highest level since the start of the war and keeps rising.
The Brent M1 contract and the Brent 2027 prices and current price of jet fuel in Europe (ARA). All in USD/b

Our back of the envelope calculation of the global shortage created by the closure of the Strait of Hormuz. Note that 3.5 mb/d of discharge from SPR is also a draw. Note also that ’Forced demand loss’ of 2.5 mb/d is probably temporary and will fall back towards zero as logistics are sorted out leaving ’Price demand loss’ to do the job of balancing the market. Thus a shortfall of at least 9 mb/d created by the closure. More if SPR discharge is included and more if Forced demand loss recedes.

Brent is climbing higher. Front-month is at USD 106.3/bl this morning, close to a weekly high and a USD 9/bl jump from Mondays open. This is the move we flagged as a risk earlier in the week: the market shifting from ”a deal is around the corner” to ”this is going to take longer than we thought”.

Analyst Commodities, SEB
During April, rest-of-year Brent remained remarkably stable around USD 90/bl. A stability which rested on one single assumption: the SoH reopens around 1 May. That assumption is now slowly falling apart.
As we highlighted yesterday: every week of delay beyond 1 May adds (theoretically) ish USD 5/bl to the rest-of-year average, as global inventories draw 100 million barrels per week. i.e., a mid-May reopening implies rest-of-year Brent closer to USD 100/bl, and anything pushing into June or July takes us meaningfully higher.
What’s changed in the last 48 hours:
#1: The US military has formally warned that clearing suspected sea mines from SoH could take up to six months. That is a completely different timescale from what the financial market is pricing. Even a political deal tomorrow does not immediately reopen the strait.
#2: Trump has shifted his tone from urgency to ”strategic patience”. In yesterday’s press conference: ”Don’t rush me… I want a great deal.” The market is reading this as a president no longer feeling pressured by timelines, with the naval blockade running in the background.
#3: So far, the military activity is escalating, not de-escalating. Axios reports Iran is laying more mines in SoH. The US 3rd carrier strike group (USS George H.W. Bush) is arriving with two countermine vessels. Trump yesterday ordered the US Navy to destroy any Iranian boats caught laying mines. While CNN reports that the Pentagon is actively drawing up plans to strike Iranian SoH capabilities and individual Iranian military leaders if the ceasefire collapses. i.e., NOT a attitude consistent with an imminent deal!
Spot crude and product prices eased off the early-April highs on a combination of system rerouting and deal optimism. Both now weakening. Goldman estimates April Gulf output is reduced by 14.5 mbl/d, or 57% of pre-war supply, a number that keeps getting worse the longer this drags on.
Demand-side adaptation is ongoing: S. Korea has cut its Middle East crude dependence from 69% to 56% by pulling more from the Americas and Africa, and Japan is kicking off a second round of SPR releases from 1 May. But SPRs are finite.
Ref. to the negotiations, we should not bet on speed. The current Iranian leadership is dominated by genuine hardliners willing to absorb economic pain and run the clock to extract concessions. That is not a setup for a rapid resolution. US/Israeli media briefings keep framing the delay as ”internal Iranian divisions”, the reality is more complicated and points toward weeks and months, not days.
Our point is that the complexity is large, and higher prices have only just started (given a scenario where the negotiations drag out in time). The market spent April leaning on the USD 90/bl rest-of-year assumption; that case is diminishing by the hour. If ”early May reopening” is replaced by ”June, July or later” over the next week or two, both crude and products have meaningful room to reprice higher from here. There is a high risk being short energy and betting on any immediate political resolution(!).
Down on Friday. Up on Monday. The Brent June crude oil contract traded down 5.1% last week to a close of $90.38/b. It reached a high of $103.87/b last Monday and a low of $86.09/b on Friday as Iran announced that the Strait of Hormuz was fully open for transit. That quickly changed over the weekend as the US upheld its blockade of Iranian oil exports while Iran naturally responded by closing the SoH again. The US blew a hole in the engine room of the Iranian ship TOUSKA and took custody of the ship on Sunday. Brent crude is up 5.6% this morning to $95.4/b.
The cease-fire is expiring tomorrow. The US has said it will send a delegation for a second round of negotiations in Islamabad in Pakistan. But Iran has for now rejected a second round of talks as it views US demands as unrealistic and excessive while the US is also blocking the Strait of Hormuz.
While Brent is up 5% this morning, the financial market is still very optimistic that progress will be made. That talks will continue and that the SoH will fully open by the start of May which is consistent with a rest-of-year average Brent crude oil price of around $90/b with the market now trading that balance at around $88/b.
Financial optimism vs. physical deterioration. We have a divergence where the financial market is trading negotiations, improvements and resolution while at the same time the physical market is deteriorating day by day. Physical oil flows remain constrained by disrupted flows, longer voyage times and elevated freight and insurance costs.
Financial markets are betting that a US/Iranian resolution will save us in time from violent shortages down the road. But every day that the SoH remains closed is bringing us closer to a potentially very painful point of shortages and much higher prices.
The US blockade is also a weapon of leverage against its European and Asian allies. When Iran closed the SoH it held the world economy as a hostage against the US. The US blockade of the SoH is of course blocking Iranian oil exports. But it is also an action of disruption directed towards Europe and Asia. The US has called for the rest of the world to engaged in the war with Iran: ”If you want oil from the Persian Gulf, then go and get it”. A risk is that the US plays brinkmanship with the global oil market directed towards its European and Asian allies and maybe even towards China to force them to engage and take part. Maybe unthinkable. But unthinkable has become the norm with Trump in the White House.


Sommarväder skapar prisrally på elbörsen
Oil product price pain is set to rise as the Strait of Hormuz stays closed into summer

Solkraften pressar elpriserna dagtid

Michel Gubel ger sin syn på oljemarknaden