

Analys
SEB – Råvarukommentarer, 11 februari 2013

Rekommendationer
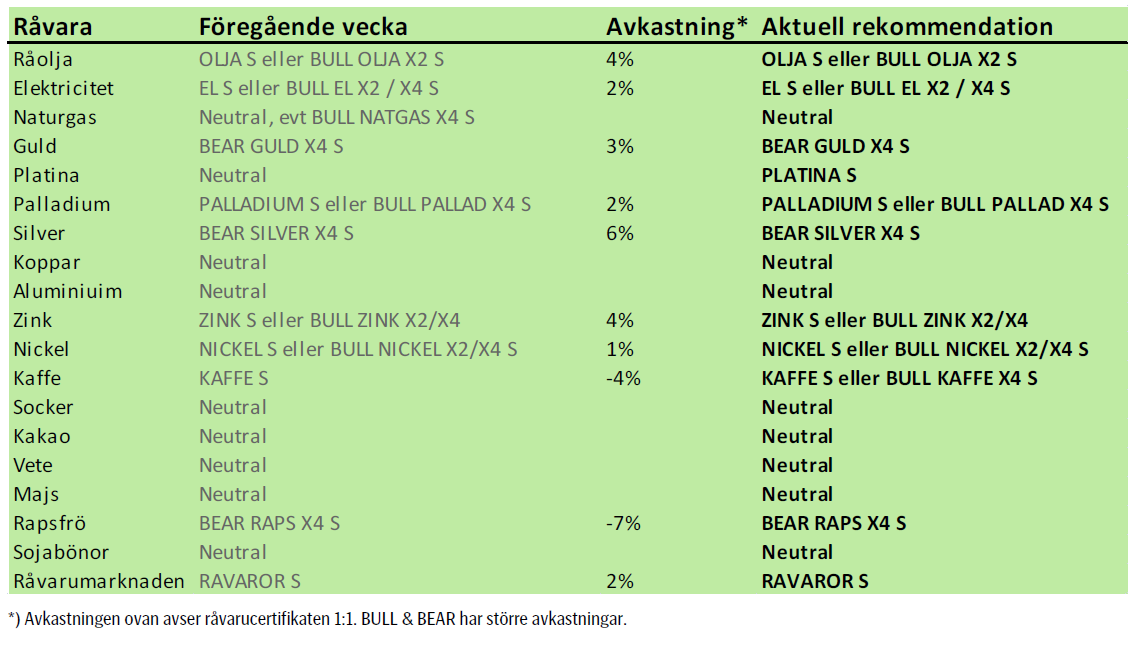
Inledning
Råvaruindex i svenska kronor steg med 2%, vilket medförde att råvaruindex-certifikatet RAVAROR S steg lika mycket. Aktiemarknaden hade däremot en blandad vecka, där i synnerhet råvarubolaget SSAB:s rapport fick aktien på fall. Råvaror och aktier är inte samma sak, som bekant.
Oljepriset fortsatte att stiga med stöd av tecken på en starkare konjunktur i kombination med att produktionen kortsiktigt stryps av Saudiarabien och på grund av hoten om våld även i Algeriet och Libyen.
Som väntat steg elpriset på Nordpool, vilket fick BULL EL X4 S att stiga med 9% på en vecka. Vi tror att det kan komma en rekyl nedåt, men i ett större perspektiv verkar det som om elpriserna håller på att förbereda sig för en fas av prisuppgång. Såväl marknaden för kol, som utsläppsrätter stärktes i veckan som gick; under stöd av starkare global konjunktur.
I fredags publicerade USDA sina månadsvisa estimat (gissningar) om produktion, konsumtion och utgående lager för vete, majs och sojabönor, bland annat. Det var något av en icke-händelse med endast marginella förändringar i siffrorna.
Kaffepriset föll i veckan, men orosmolnen hopar sig för produktionen i Mellanamerika. I International Coffee Organisations senaste månadsrapport lyfts svampsjukdomarna fram som mycket värre än vad marknaden hittills uppfattat. Samma svampangrepp fick för hundra år sedan ön Ceylon att byta från kaffe till te.
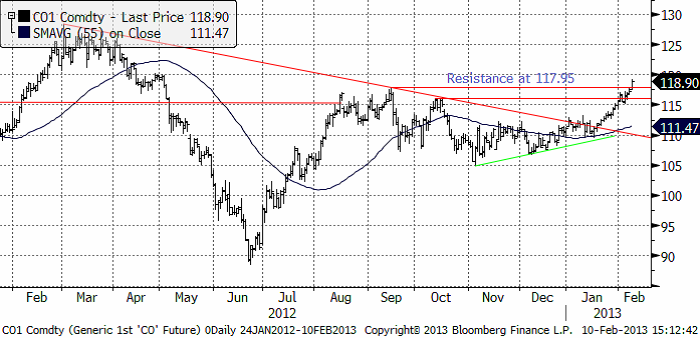
Råolja – Brent
Råoljepriset har brutit alla närliggande tekniska motstånd och har fritt upp till 125 dollar. Vi fortsätter att rekommendera köp av olja. Bäst är om man kan komma in lite billigare efter en rekyl.
Lagren och lagerförändringarna i USA per för den senaste avrapporterade veckan, enligt Department of Energy och American Petroleum Institute visas nedan.
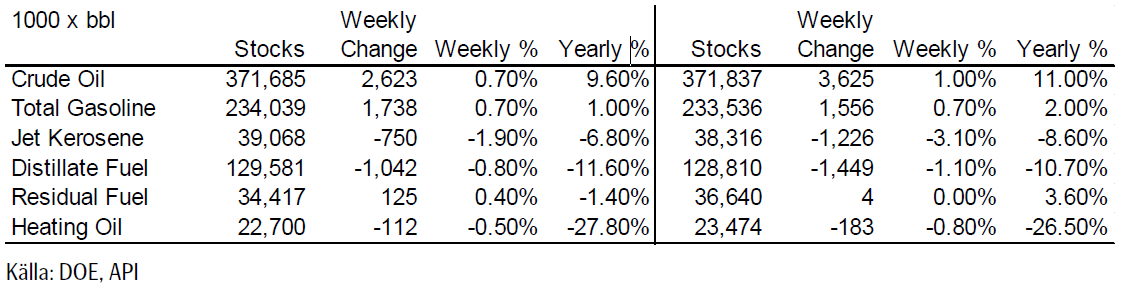
Lagren för destillat och heating oil, som redan låg under förra årets nivå, forsätter att minska. Detta är stödjande.
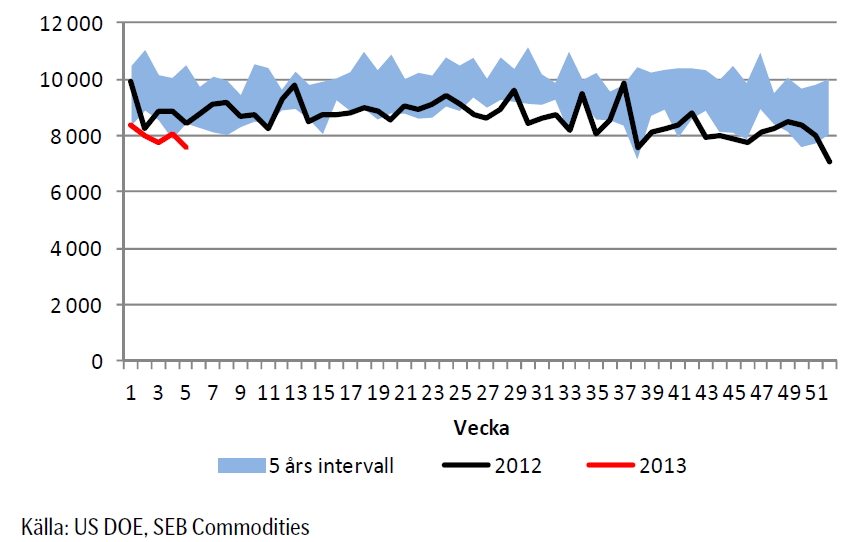
Råoljelagren fortsatte att byggas på. Nedan ser vi amerikanska råoljelager enligt DOE i tusen fat. Den svarta kurvan är 2012 års lagernivåer vecka för vecka och den lilla röda linjen är 2013 års nivå. Vi ser att lagernivåerna fortsätter att vara högre än de varit sedan 2007 för den här tiden på året.
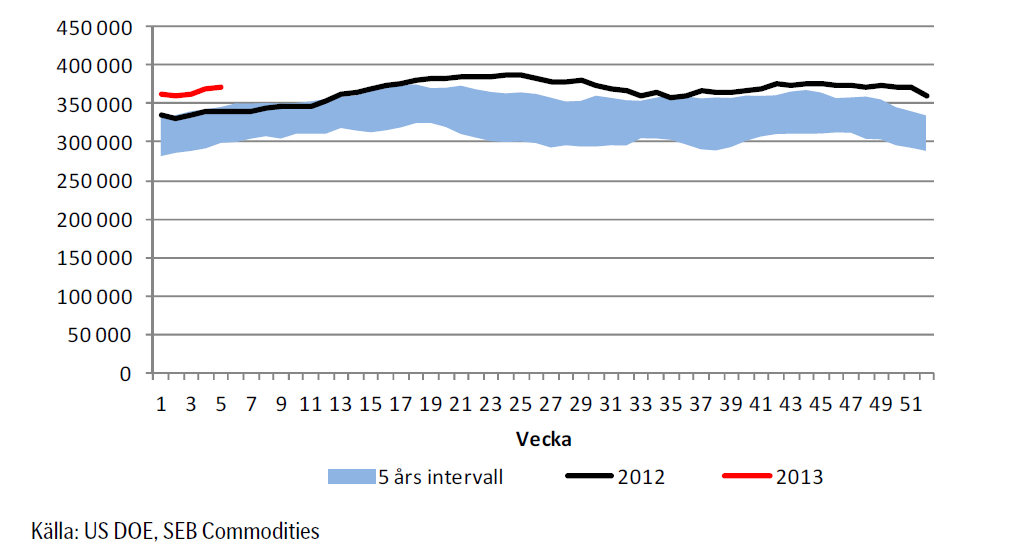
Lagren ökar samtidigt som vi ser att importen av råolja till USA fortsätter att minska. Man kan ana att konjunktur och den nya ”fracking” tekniken ligger bakom.
Sammanfattningsvis: Köprekommendationen forsätter.
Elektricitet
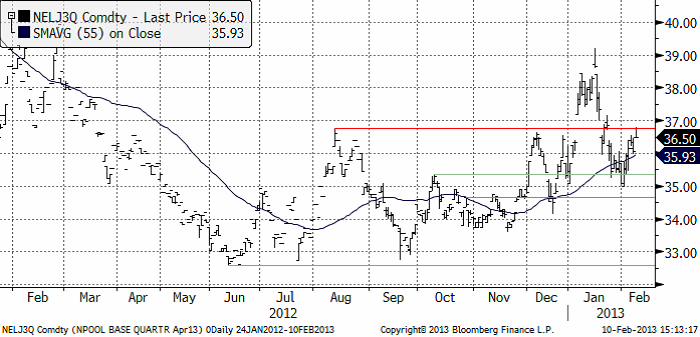
Elpriset steg snabbt i veckan och stötte på motstånd där det fanns ett i väntan sedan tidigare. Det kan komma en rekyl nedåt. Vi tror att det i så fall är ett köptillfälle. Vi håller fast vid vår rekommendation att köpa EL S eller någon av BULL EL X2 S och BULL EL X4 S, för dem som är villiga att ta mer risk. Prisuppgången i veckan för BULL EL X4 S var hela 9%. Elpriset har kommit ner så pass, till 35 euro per ton, att de kan vara en god idé att försöka köpa BULL EL X2 eller X4 S på de här nivåerna.
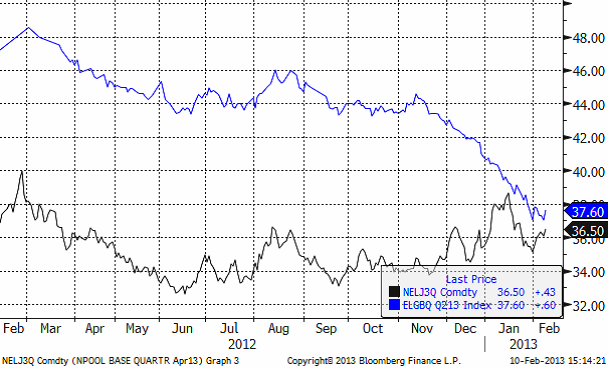
Elpriset i Tyskland (den blåa linjen nedan) gjorde verkar ha stabiliserat sig i veckan som gick, som vi ser i diagrammet nedan.
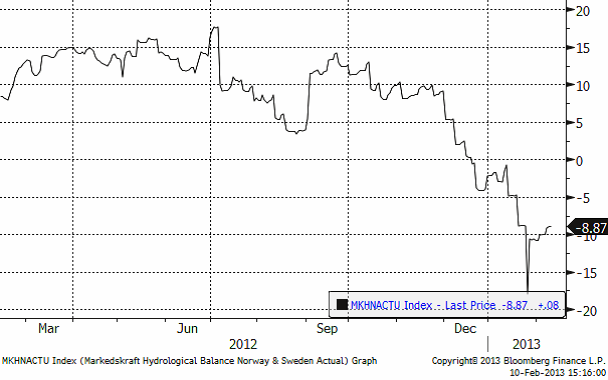
Den hydrologiska balansen för NordPools börsområde gick i veckan från ett underskott på 10 TWh till ett underskott på -8.87 TWh. Det är ”bullish”.
Sammanfattningsvis. Vi tror att det finns goda möjligheter för ytterligare prisuppgång, eventuellt efter en liten rekyl, och rekommenderar en köpt position i el.
Naturgas
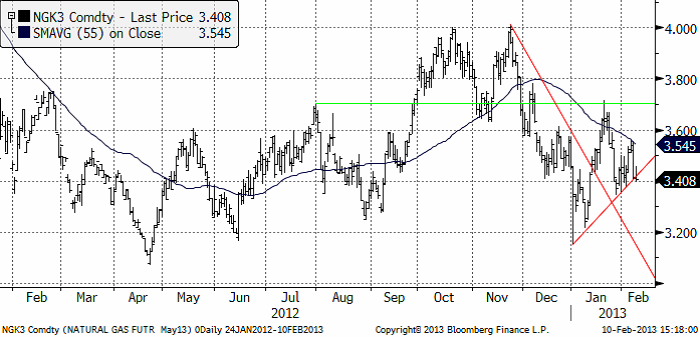
Naturgasterminen på NYMEX (mars 2013) gick först upp i början av förra veckan, och föll sedan tillbaka ner. Veckans uppgång nådde inte lika långt som uppgången innan. Det är ett svaghetstecken. Den uppåtgående stödlinjen bröts sedan i fredags. Det är bara precis ett brott, och kanske inte ska säljas på rakt av. Men skulle priset falla under 3.40 i början av veckan som nu börjar, får vi nog tolka det som en kortsiktig säljsignal från den tekniska analysen.
Guld och Silver
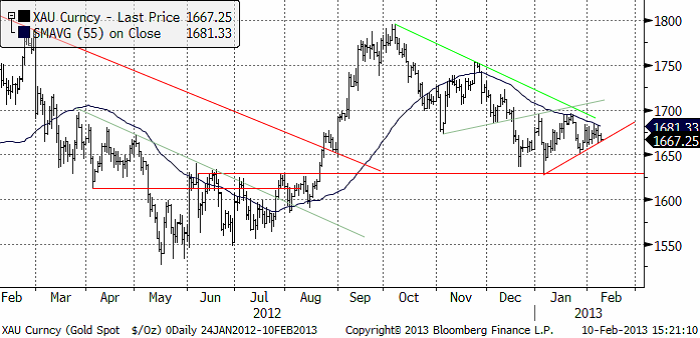
Guldpriset orkade som väntat inte ta sig över föregående topp. Mot slutet av veckan vände priset ner igen. Fredagens handel stannade precis på det kortsiktiga stödet, som vi ser i diagrammet nedan. Får vi ett brott nedåt i veckan som kommer så ger det en förnyad säljsignal.
Vi noterar också att guldmarknaden forsätter att bilda ”trianglar” i sin pendling uppåt och nedåt. Det innebär att ett brott uppåt omedelbart genererar en köpsignal. Skulle priset med andra ord gå upp till över 1700 dollar, har vi en köpsignal. Just nu är dock den senaste signalen en säljsignal. Med reservation för att det kan bli en snabb rekommendationsförändring, håller vi fortfarande fast vid den säljrekommendation vi haft sedan december.
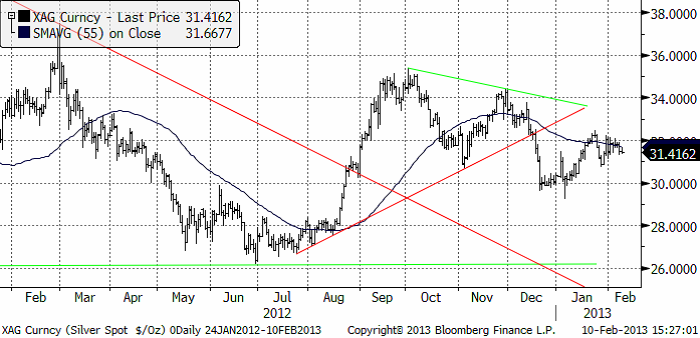
Nedan ser vi kursdiagrammet för silver i dollar per troy ounce. Situationen är snarlik den för guld. Rekyl ner till 30 dollar är att vänta. Kortsiktig BEAR-rekommendation för silver också.
Platina & Palladium
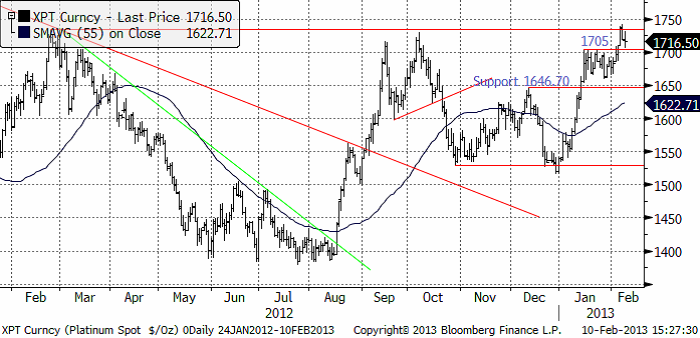
Platina bröt uppåt efter en tids konsolidering. Priset gick upp till motståndet på 1734 dollar och stötte i där, som du kunde läsa förra veckan. Nu är 1705 dollar ett tekniskt stöd. Det här är ett spännande läge, för att konsolideringen mellan 1650 och 1705 kan betraktas som en ”flagga” på vägen upp. Dessa brukar dyka upp halvvägs upp i en uppgångsfas. Därmed skulle priset kunna gå upp till 1850. Det som behövs är att motståndet på 1734 dollar definitivt bryts. Vi fortsätter att rekommendera köp av Plantina, t ex med PLATINA S eller BULL PLATIN X4 S.
Palladium fortsatte stiga i början på förra veckan, men föll sedan tillbaka på vinsthemtagningar. Det ser ut som om uppgångsfasen från 700 dollar till 750 kan tänkas behöva en konsolidering vid dessa nya nivåer, innan priset kan fortsätta upp. Men trenden är definitivt uppåtriktad och rekyler bör hellre betraktas som köptillfällen, än som en orsak att lämna marknaden.
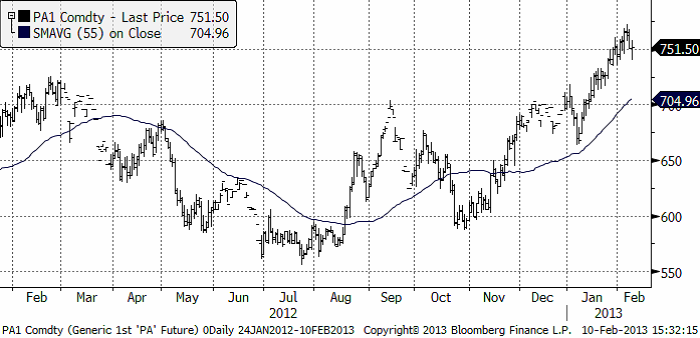
Vi rekommenderar en köpt position i palladium, t ex med certifikatet PALLADIUM S eller med BULL PALLAD X4 S, för den som önskar ta mer risk.
Basmetaller
Efter summering av veckans stängningspriser ser det inte ut att ha hänt så mycket. Metallerna är i de flesta fall i princip oförändrade från måndag morgon till fredag kväll. Rörelserna har ändå varit stora däremellan. Vi varnade för en rekyl efter den starka uppgången veckan dessförinnan. Det var just det som skedde. Börser och råvaror fick sig en törn inledningsvis, ökad Europaoro får väl tillskrivas den huvudsakliga orsaken. Men ibland behövs också korrigeringar för att ge ny kraft.
Priserna föll 2-3 % för att under torsdagen och fredagen återhämta, och således stänga oförändrade. Undantaget är favoriten zink som trots en rejäl rekyl stänger upp 1,6 %. Marknaden fick en extra impuls av fredagens handelssiffror från Kina som visade en 25 % -ig ökning av exporten i januari. Importsiffrorna var också starka med en ökning med 28 %, det senare och beror säkert på att ”bokningar” gjorts före det kinesiska nyårsfirandet nästa vecka. Med många kinesiska aktörer på ledighet nästa vecka förväntas volymerna vara begränsade, vilket i sig kan skapa lite oförutsedda prisrörelser. Men troligast är avvaktande handel.
Koppar
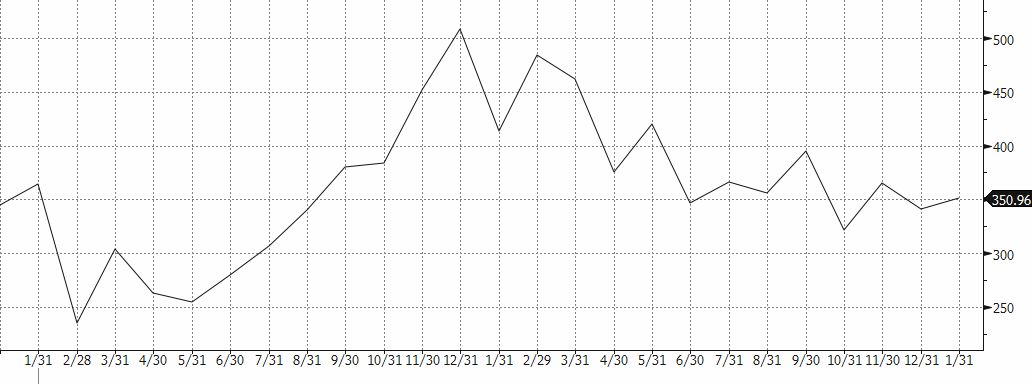
Kinas importsiffror för koppar kom in på 350 958 ton, + 2,9 % i januari jämfört med december. Jämfört med januari förra året föll importen med 15,2 % (se månadsstatistiken nedan). Trenden är fallande under året. Möjligtvis anas en tendens till ”urbottning”. Det blir också intressant hur den utvecklas framöver, efter det kinesiska nyåret. Förra året tog det fart under våren.
Kinas kopparimport (1000-tals ton)
Tekniskt sett ser det relativt positivt ut. Efter brottet ur den stora ”triangelformationen”, rekylerade marknaden ned i veckan. Intressant att notera är ”utbrottsnivån” testades och det vände upp exakt på linjen (se nedan). Det brukar vara ett positivt tecken. Om priset lyckas ta sig över toppen för 2 veckor sen kring $8350, öppnas det upp för en uppgång i trendkanalen upp mot nivåer kring $8600.
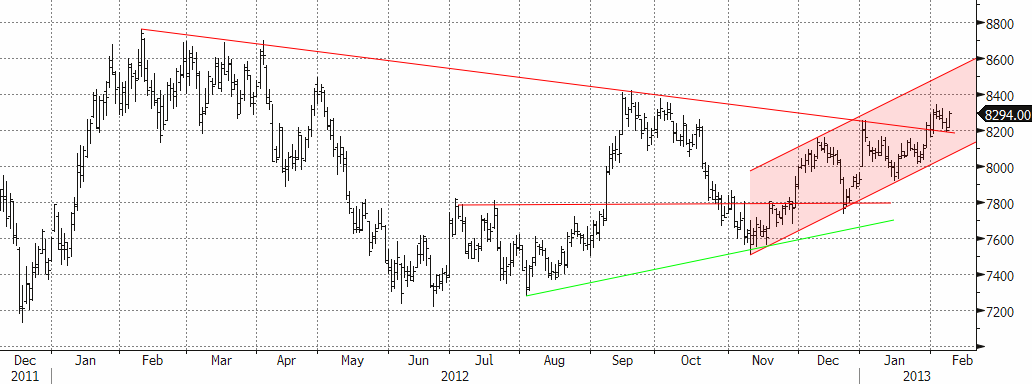
Som vi skrivit tidigare tyder mycket på ökat utbud för koppar, vilket ökar risken för en lite trögare marknad. Vi ser inte den stora potentialen på koppar på uppsidan just nu. Vi rekommenderar därför en fortsatt neutral position i koppar.
Aluminium
Tekniskt sett liknar bilden den för koppar. ”Utbrottspunkten” tangerades exakt. Om förra veckans topp på $2150 passeras öppnar det upp för ytterligare uppgång. Som vi tidigare skrivit begränsar det överhängande lagret möjligheterna för stora uppgångar. Vi rekommenderar därför fortsättningsvis en neutral position i aluminium.
Zink
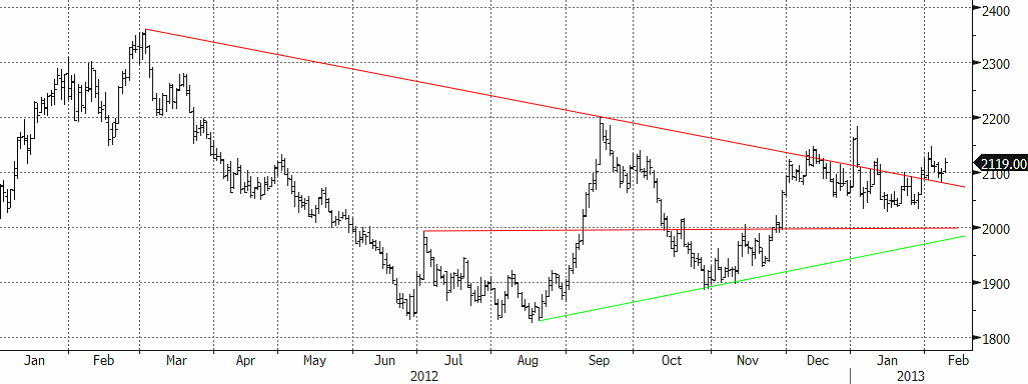
Vi varnade för en rekyl, och den kom, men kanske inte så omfattande som väntat. Den stoppade vid $2150. Om vi jämför den tekniska bilden med koppar och aluminium, så kom aldrig priset ned till utbrottspunkten, och det är ett styrketecken. Tekniskt sett får vi en mycket stark stängning som talar för fortsatt uppgång. Vi kvarstår med vår bedömning att marknaden håller på att ”omvärdera” zinken på förväntan om att den fundamentala balansen håller på att svänga om (från stora överskott till mer balanserat). Den ökande produktionen i Kina förra året har väntats minska under Q1. Den senaste statistiken gällande Kinas gruvproduktion visar en fortsatt ökning, vilket riskerar att försena scenariot något.
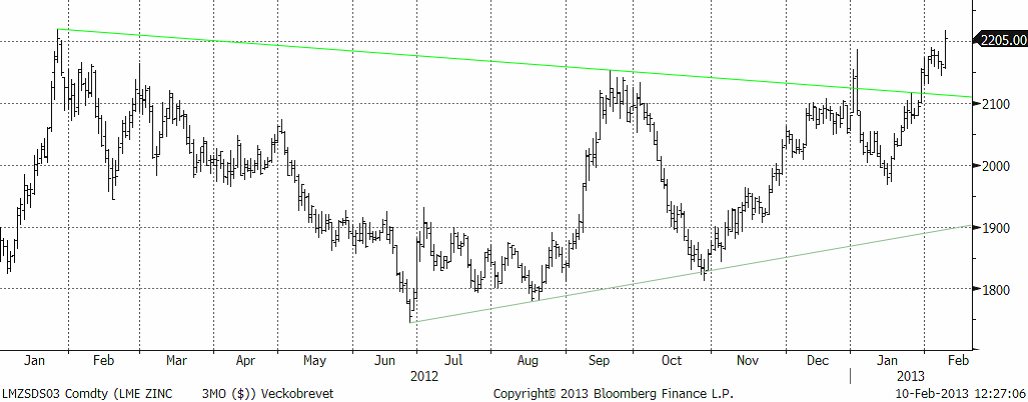
Vi rekommenderar köp av ZINK S eller BULL ZINK X2 / X4 S för den som vill ta mer risk. Efter de senaste veckornas kraftiga uppgång finns fortfarande risk för en rekyl. För nya köp bör man avvakta en eventuell rekyl ned mot intervallet $2000-$2100.
För den som köpt bör man avvakta veckans inledning för att se om marknaden orkar igenom toppen från januari 2011 på $2020 (i fredags handlades $2018 som högst!). På lite längre sikt är potentialen stor med målet $2400 på 1-2 månaders sikt.
Nickel
Rekylen blev relativt kraftig för nickel, med ett fall från $18760 ned till $18150 som lägst. Priset återhämtade sig, men inte riktigt som övriga metaller. Marknaden är fortsatt tveksam till den fundamentala situationen. Kommentarer från den fysiska marknaden indikerar att ”det finns gott om nickel”, samtidigt som rapporter gör gällande att exporten av nickelmalm från Indonesien till Kina ökar igen, vilket riskerar att öka utbudet av s.k. Nickel Pig Iron i Kina (vilket i sin tur minskar efterfrågan på nickelbärande skrot och primärnickel). Som vi tidigare skrivit kan dock nickel erfarenhetsmässigt ofta överraska. Den tekniska bilden är väldigt tydlig med nästa motståndsnivå vid $19000 och därefter $22000. För den som följde rådet att ta hem vinst i början av veckan, kan det vara värt att gå in igen kring ”utbrottspunkten” $18000 med ett nytt köp.
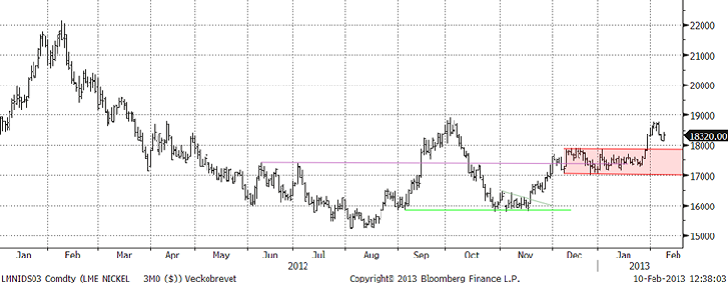
Vi rekommenderar köp av NICKEL S eller BULL NICKEL X2 / X4 S för den som vill ta mer risk. Efter de senaste veckornas kraftiga uppgång finns risk för en rekyl. För nya köp bör man avvakta en eventuell rekyl ned mot ”utbrottsnivån” $18000. För den som köpt tidigare bör man kortsiktigt ta hem vinst vid motståndsnivån $19000. På lite längre sikt är potentialen större med målet $22 000 på 1-2 månaders sikt.
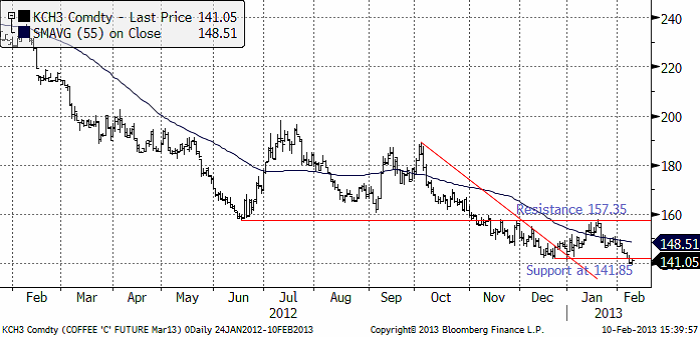
Kaffe
Kaffepriset föll oväntat i veckan som och studsade på 140 cent per pund. ”Stödet” på 141.85 fungerar nu som motstånd. Vi tror trots allt att marknaden befinner sig i en vändningsfas efter två års kraftigt prisfall. Den jämna prisnivån 140 cent fungerar också som ett stöd i sig. Det finns säkerligen en hel del köpordrar lagda på den nivån. Men vi skulle vilja se priset stiga över stödnivån på 141.85 cent för att förtroendet för att vändningsfasen ska ske på den här nivån ska stärkas.
Det har kommit ännu mer information som borde ge stöd för marknaden. International Coffee Organisation (”ICO”) publicerade den senaste månadsrapporten i torsdags. Där står att marknaden just nu tyngs av stora säljintressen i robusta. Om krisen i Mellanamerika, som vi tidigare rapporterat om står:
”In Central America, outbreaks of coffee leaf rust have now been reported in all major coffeeproducing countries. Authorities in Costa Rica have declared a state of emergency in order to tackle the spread of the fungus. In Guatemala and El Salvador, there are reports that rust could have affected 40_50% of all coffee plants, with both countries enacting programmes to provide fungicide to coffee farmers. Nicaragua has also recently launched a campaign to train experts and growers against the spread, while Honduras has declared a phytosanitary emergency. Coffee leaf rust has also been reported in certain parts of Mexico. This outbreak could have serious long_term implications for the production of Washed Arabicas in Central America, with the region potentially losing around 2.5 to 3 million bags of coffee.”
I diagrammet nedan ser vi lite längre prishistorik på kaffe. I den nedre delen av diagrammet ser vi en priscykel om lite drygt fyra år. Den verkar finnas där (statistiskt säkerställd). Kanske har den sitt ursprung i vartannatårs-karaktären av skördens storlek från arabica-busken, i kombination med hur lantbrukarna reagerar på den och prisförändringarna. Enligt den här pris-cykeln, är priset nära en cyklisk botten nu.
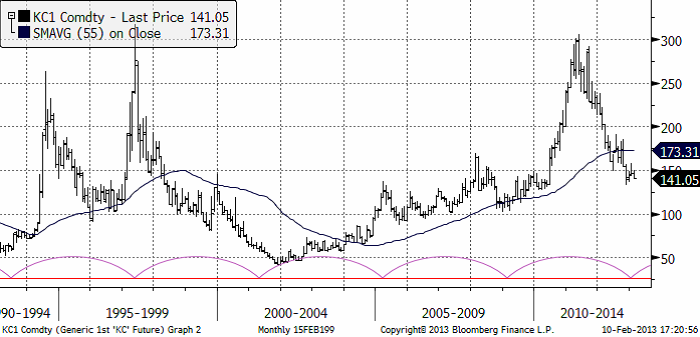
Vi fortsätter att rekommendera köp av KAFFE S eller BULL KAFFE X4 S för den som vill ta mer risk.
Socker
Sockerpriset (mars 2013) föll kraftigt i början av veckan. Den förra botten från januari på 18 cent, fungerade nu som ett stöd. I fredags stängde mars-kontraktet på 18.14 cent per pund. Det är strax över stödet på 18 cent. Trenden är nedåtriktad och kraften av den rörelsen ”bör” enligt beprövad erfarenhet få stödet att brytas, kanske redan i veckan.
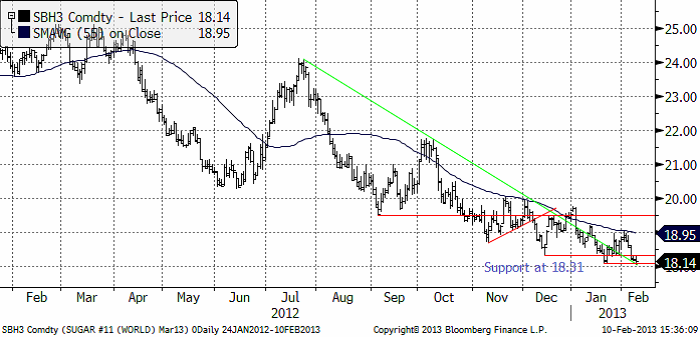
Vi fortsätter med neutral rekommendation på socker, i avvaktan på mer tecken på att prisfallet är över.
[box]SEB Veckobrev Veckans råvarukommentar är producerat av SEB Merchant Banking och publiceras i samarbete och med tillstånd på Råvarumarknaden.se[/box]
Disclaimer
The information in this document has been compiled by SEB Merchant Banking, a division within Skandinaviska Enskilda Banken AB (publ) (“SEB”).
Opinions contained in this report represent the bank’s present opinion only and are subject to change without notice. All information contained in this report has been compiled in good faith from sources believed to be reliable. However, no representation or warranty, expressed or implied, is made with respect to the completeness or accuracy of its contents and the information is not to be relied upon as authoritative. Anyone considering taking actions based upon the content of this document is urged to base his or her investment decisions upon such investigations as he or she deems necessary. This document is being provided as information only, and no specific actions are being solicited as a result of it; to the extent permitted by law, no liability whatsoever is accepted for any direct or consequential loss arising from use of this document or its contents.
About SEB
SEB is a public company incorporated in Stockholm, Sweden, with limited liability. It is a participant at major Nordic and other European Regulated Markets and Multilateral Trading Facilities (as well as some non-European equivalent markets) for trading in financial instruments, such as markets operated by NASDAQ OMX, NYSE Euronext, London Stock Exchange, Deutsche Börse, Swiss Exchanges, Turquoise and Chi-X. SEB is authorized and regulated by Finansinspektionen in Sweden; it is authorized and subject to limited regulation by the Financial Services Authority for the conduct of designated investment business in the UK, and is subject to the provisions of relevant regulators in all other jurisdictions where SEB conducts operations. SEB Merchant Banking. All rights reserved.

Rebounding along with most markets. But concerns over solidity of Gaza peace may also contribute. Brent crude fell 0.8% yesterday to $61.91/b and its lowest close since May this year. This morning it is bouncing up 0.9% to $62.5/b along with a softer USD amid positive sentiment with both equities and industrial metals moving higher. Concerns that the peace in Gaza may be less solid than what one might hope for also yields some support to Brent. Bets on tech stocks are rebounding, defying fears of trade war. Money moving back into markets. Gold continues upwards its strong trend and a softer dollar helps it higher today as well.

US crude & products probably rose 5.6 mb last week (API) versus a normal seasonal decline of 2.4 mb. The US API last night partial and thus indicative data for US oil inventories. Their data indicates that US crude stocks rose 7.4 mb last week, gasoline stocks rose 3.0 mb while Distillate stocks fell 4.8 mb. Altogether an increase in commercial crude and product stocks of 5.6 mb. Commercial US crude and product stocks normally decline by 2.4 mb this time of year. So seasonally adjusted the US inventories rose 8 mb last week according to the indicative numbers by the API. That is a lot. Also, the counter seasonal trend of rising stocks versus normally declining stocks this time of year looks on a solid pace of continuation. If the API is correct then total US crude and product stocks would stand 41 mb higher than one year ago and 6 mb higher than the 2015-19 average. And if we combine this with our knowledge of a sharp increase in production and exports by OPEC(+) and a large increase in oil at sea, then the current trend in US oil inventories looks set to continue. So higher stocks and lower crude oil prices until OPEC(+) switch to cuts. Actual US oil inventory data today at 18:00 CET.
US commercial crude and product stocks rising to 1293 mb in week 41 if last nights indicative numbers from API are correct.

Crude oil soon coming to a port near you. OPEC has lifted production sharply higher this autumn. At the same time demand for oil in the Middle-East has fallen as we have moved out of summer heat and crude oil burn for power for air-conditioning. The Middle-East oil producers have thus been able to lift exports higher on both accounts. Crude oil and condensates on water has shot up by 177 mb since mid-August. This oil is now on its way to ports around the world. And when they arrive, it will likely help to lift stocks onshore higher. That is probably when we will lose the last bit of front-end backwardation the the crude oil curves. That will help to drive the front-month Brent crude oil price down to the $60/b line and revisit the high $50ies/b. Then the eyes will be all back on OPEC+ when they meet in early November and then again in early December.
Crude oil and condensates at sea have moved straight up by 177 mb since mid-August as OPEC(+) has produced more, consumed less and exported more.

When it starts to move lower it moves rather quickly. Gaza, China, IEA. Brent crude is down 2.1% today to $62/b after having traded as high as $66.58/b last Thursday and above $70/b in late September. The sell-off follows the truce/peace in Gaze, a flareup in US-China trade and yet another bearish oil outlook from the IEA.
A lasting peace in Gaze could drive crude oil at sea to onshore stocks. A lasting peace in Gaza would probably calm down the Houthis and thus allow more normal shipments of crude oil to sail through the Suez Canal, the Red Sea and out through the Bab-el-Mandeb Strait. Crude oil at sea has risen from 48 mb in April to now 91 mb versus a pre-Covid normal of about 50-60 mb. The rise to 91 mb is probably the result of crude sailing around Africa to be shot to pieces by the Houthis. If sailings were to normalize through the Suez Canal, then it could free up some 40 mb in transit at sea moving onshore into stocks.
The US-China trade conflict is of course bearish for demand if it continues.
Bearish IEA yet again. Getting closer to 2026. Credibility rises. We expect OPEC to cut end of 2025. The bearish monthly report from the IEA is what it is, but the closer we get to 2026, the more likely the IEA is of being ball-park right in its outlook. In its monthly report today the IEA estimates that the need for crude oil from OPEC in 2026 will be 25.4 mb/d versus production by the group in September of 29.1 mb/d. The group thus needs to do some serious cutting at the end of 2025 if it wants to keep the market balanced and avoid inventories from skyrocketing. Given that IEA is correct that is. We do however expect OPEC to implement cuts to avoid a large increase in inventories in Q1-26. The group will probably revert to cuts either at its early December meeting when they discuss production for January or in early January when they discuss production for February. The oil price will likely head yet lower until the group reverts to cuts.
Dubai: The Mid-East anchor dragging crude oil lower. Surplus emerging in Mid-East pricing. Crude oil prices held surprisingly strong all through the summer. A sign and a key source of that strength came from the strength in the front-end backwardation of the Dubai crude oil curve. It held out strong from mid-June and all until late September with an average 1-3mth time-spread premium of $1.8/b from mid-June to end of September. The 1-3mth time-spreads for Brent and WTI however were in steady deterioration from late June while their flat prices probably were held up by the strength coming from the Persian Gulf. Then in late September the strength in the Dubai curve suddenly collapsed. Since the start of October it has been weaker than both the Brent and the WTI curves. The Dubai 1-3mth time-spread now only stands at $0.25/b. The Middle East is now exporting more as it is producing more and also consuming less following elevated summer crude burn for power (Aircon) etc.
The only bear-element missing is a sudden and solid rise in OECD stocks. The only thing that is missing for the bear-case everyone have been waiting for is a solid, visible rise in OECD stocks in general and US oil stocks specifically. So watch out for US API indications tomorrow and official US oil inventories on Thursday.
No sign of any kind of fire-sale of oil from Saudi Arabia yet. To what we can see, Saudi Arabia is not at all struggling to sell its oil. It only lowered its Official Selling Prices (OSPs) to Asia marginally for November. A surplus market + Saudi determination to sell its oil to the market would normally lead to a sharp lowering of Saudi OSPs to Asia. Not yet at least and not for November.
The 5yr contract close to fixed at $68/b. Of importance with respect to how far down oil can/will go. When the oil market moves into a surplus then the spot price starts to trade in a large discount to the 5yr contract. Typically $10-15/b below the 5yr contract on average in bear-years (2009, 2015, 2016, 2020). But the 5yr contract is usually pulled lower as well thus making this approach a moving target. But the 5yr contract price has now been rock solidly been pegged to $68/b since 2022. And in the 2022 bull-year (Brent spot average $99/b), the 5yr contract only went to $72/b on average. If we assume that the same goes for the downside and that 2026 is a bear-year then the 5yr goes to $64/b while the spot is trading at a $10-15/b discount to that. That would imply an average spot price next year of $49-54/b. But that is if OPEC doesn’t revert to cuts and instead keeps production flowing. We think OPEC(+) will trim/cut production as needed into 2026 to prevent a huge build-up in global oil stocks and a crash in prices. But for now we are still heading lower. Into the $50ies/b.
Some rebound but not much. Brent crude rebounded 1.5% yesterday to $65.47/b. This morning it is inching 0.2% up to $65.6/b. The lowest close last week was on Thursday at $64.11/b.
The curve structure is almost as week as it was before the weekend. The rebound we now have gotten post the message from OPEC+ over the weekend is to a large degree a rebound along the curve rather than much strengthening at the front-end of the curve. That part of the curve structure is almost as weak as it was last Thursday.
We are still on a weakening path. The message from OPEC+ over the weekend was we are still on a weakening path with rising supply from the group. It is just not as rapidly weakening as was feared ahead of the weekend when a quota hike of 500 kb/d/mth for November was discussed.
The Brent curve is on its way to full contango with Brent dipping into the $50ies/b. Thus the ongoing weakening we have had in the crude curve since the start of the year, and especially since early June, will continue until the Brent crude oil forward curve is in full contango along with visibly rising US and OECD oil inventories. The front-month Brent contract will then flip down towards the $60/b-line and below into the $50ies/b.
At what point will OPEC+ turn to cuts? The big question then becomes: When will OPEC+ turn around to make some cuts? At what (price) point will they choose to stabilize the market? Because for sure they will. Higher oil inventories, some more shedding of drilling rigs in US shale and Brent into the 50ies somewhere is probably where the group will step in.
There is nothing we have seen from the group so far which indicates that they will close their eyes, let the world drown in oil and the oil price crash to $40/b or below.
The message from OPEC+ is also about balance and stability. The world won’t drown in oil in 2026. The message from the group as far as we manage to interpret it is twofold: 1) Taking back market share which requires a lower price for non-OPEC+ to back off a bit, and 2) Oil market stability and balance. It is not just about 1. Thus fretting about how we are all going to drown in oil in 2026 is totally off the mark by just focusing on point 1.
When to buy cal 2026? Before Christmas when Brent hits $55/b and before OPEC+ holds its last meeting of the year which is likely to be in early December.
Brent crude oil prices have rebounded a bit along the forward curve. Not much strengthening in the structure of the curve. The front-end backwardation is not much stronger today than on its weakest level so far this year which was on Thursday last week.

The front-end backwardation fell to its weakest level so far this year on Thursday last week. A slight pickup yesterday and today, but still very close to the weakest year to date. More oil from OPEC+ in the coming months and softer demand and rising inventories. We are heading for yet softer levels.


Vad guldets uppgång egentligen betyder för världen

Spotpriset på guld över 4300 USD och silver över 54 USD
Crude oil soon coming to a port near you

Guld och silver stiger hela tiden mot nya höjder
The Mid-East anchor dragging crude oil lower

OPEC+ missar produktionsmål, stöder oljepriserna

Ett samtal om guld, olja, fjärrvärme och förnybar energi

Goldman Sachs höjer prognosen för guld, tror priset når 4900 USD
Guld nära 4000 USD och silver 50 USD, därför kan de fortsätta stiga
Are Ukraine’s attacks on Russian energy infrastructure working?
-
 Nyheter3 veckor sedan
OPEC+ missar produktionsmål, stöder oljepriserna
-
 Nyheter4 veckor sedan
Ett samtal om guld, olja, fjärrvärme och förnybar energi
-
 Nyheter2 veckor sedan
Goldman Sachs höjer prognosen för guld, tror priset når 4900 USD
-
 Nyheter2 veckor sedan
Guld nära 4000 USD och silver 50 USD, därför kan de fortsätta stiga
-
Analys3 veckor sedan
Are Ukraine’s attacks on Russian energy infrastructure working?
-

 Nyheter2 veckor sedan
Blykalla och amerikanska Oklo inleder ett samarbete
-

 Nyheter4 veckor sedan
Guldpriset uppe på nya höjder, nu 3750 USD
-
Nyheter2 veckor sedan
Ett samtal om guld, olja, koppar och stål