

Analys
SEB Råvarubrev 6 februari 2018

 Volatilitens återkomst.
MARKNADEN I KORTHET
Stark arbetsmarknadsstatistik från USA tillsammans med något högre löneökningar eldade ytterligare på den redan stigande räntetrenden samt skruvade upp förväntningarna om möjligen ytterligare en FED höjning (från 3 – 4 stycken) under 2018. Uppenbarligen var detta tillräckligt för att oroa köparna, av en redan överköpt börs, om stigande risker. Som vi förra veckan pekade på tyckte vi att det var lite oroande att börsen gick upp samtidigt som marknaden börjat köpa volatilitet i form av VIX och V2X index. 2018 blir sannolikt året då volatiliteten återkommer till marknaderna. När volatiliteten nu ökar tvingas förvaltare minska sin risk för att anpassa portföljerna till en högre volatilitet. Italien visar opinionsundersökningarna på att inget av de tre stora blocken kommer att nå egen majoritet. Mitten/höger koalitionen är största grupp men M5S största enskilda parti. 4:e mars får vi se hur stökig en eventuell regeringsbildning kommer att bli och hur svag denna riskerar att bli. I Tyskland arbetar man vidare mot en ny stor koalition. Löneförhandlingarna med IG Metall kan komma att bli besvärliga då de kräver 6 % löneökning i år (arbetsgivarna erbjuder 2 %) och möjligheten att gå ned i arbetstid. Förra veckan hölls en varningsstrejk. Nästa vecka, den 15:e, börjar Kina fira Hundens år och är då stängda t.o.m. den 21:a.

Anders Söderberg, Redaktör
Råvaror: Så fick vi till slut lite rekyl på oljepriset men man kan inte annat säga än att den rätt beskedliga (än så länge) nedgången visar på en underliggande styrka. Antalet borriggar fortsatte förra veckan att öka dock i en något lägre takt en föregående vecka. En Saudisk rapport pekar på fortsatt mycket dålig avkastning för skifferoljebolagen. Merparten av de undersökta bolagen gör fortsatt förluster och den sammanvägda avkastningen magra 0,8 %. Efter en viss tveksamhet har nu också industrimetallerna fallit tillbaka något och då främst på den tilltagande börsoron. Detta bör dock bara vara av godo då vi plockar ned den överköpta situationen något. Ädelmetaller har inte reagerat nämnvärt på börsoron. Vi tycker dock fortfarande att relativprissättningen palladium/platina är fortsatt extrem. El-terminen gör ett försök att bryta högre, så gör också utsläppsrätterna. Uppgången i vetepriset (US) har tagit en liten paus men kyla och torka i södra delen av odlingsbältet utgör fortsatt en uppåtrisk. Kakao, som vi tittade på förra veckan har klättrat något högre.
Valuta: Dollar och yen tjänar båda på börsoron som varandes tryggare hamnar. Kronan brukar också ta lite stryk under sådana här oroligare perioder.
Börser: Stigande börs och stigande volatilitetsindex (VIX & V2X) visade sig vara ett relevant varningstecken. Den paraboliska uppgången för framför allt amerikanska börser har nu avslutats och vi har fallit tillbaka till en mer uthållig lutning. Vi betraktar än så länge det som en impulsiv korrektion och inte en mer långsiktig trendvändning, vilket inte utesluter en studs och ytterligare en botten.
Räntor: Obligationsräntorna fortsatte upp t.o.m. måndagens tilltagande börsoro då de föll tillbaka något. Kortsiktigt kan vi mycket väl se en rekyl på ränteuppgången, som dock på lite sikt bör fortsätta.
OBSERVATIONER I SAMMANDRAG
- Olja – korrektion!
- Nickel – ett steg tillbaka.
- Guld – svag utveckling trots börsraset.
- DAX – botten ur! Trolig rekyl, inte vändning, uppåt.
- USD/SEK – oron guidar dollarn högre.
- OMX30 – botten är troligtvis inte nådd.
En placering i certifikat och warranter är förknippat med risker. Du kan förlora hela ditt investerade kapital. Läs mer om riskerna i SEB:s offentliggjorda Grundprospekt för certifikat- och warrantprogram på seb.se/cert eller seb.se/mini
OLJA BRENT
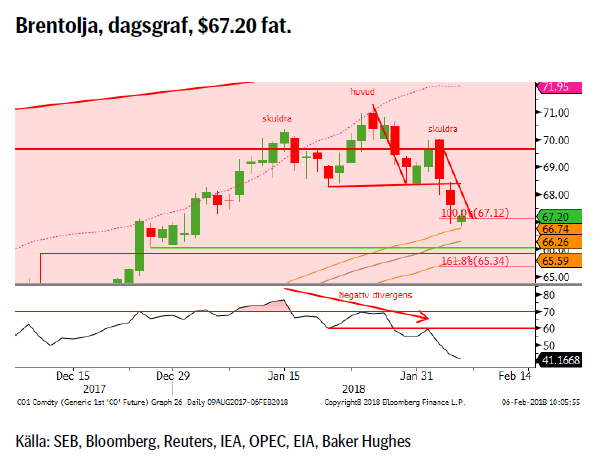 Så kom den då äntligen, korrektionen. Ett minimimål, $67.12, har redan klarats av och vattendelaren mellan en mindre och en större korrektion återfinns nu i 55d mv bandet. Ett varningstecken, tycker jag, är att trots rekylen så har spekulanterna, både Nymex och Brent, fortsatt att öka den långa nettopositioneringen till ännu ett nytt rekord. Ökad lång positionering och fallande kurser brukar inte vara något framgångsrecept. Den minskade skillnaden mellan Brent och WTI priset bör i detta fall också vara på marginalen negativt för Brent.
Konklusion: Äntligen korrektion!
OBSERVATIONER
+ Saudierna vill fortsätta samarbetet in i 2019.
+ Kinas import ökar åter.
+ Förlängningen av produktionsbegränsningarna.
+ Att förlängningen nu också omfattar Libyen och Nigeria.
+ Geopolitikens återkomst i form av en riskpremie i oljepriset.
+ Kurvans negativa lutning (backwardation) gör det lönsammare att ligga lång.
+ Långa spekulativa nettopositioner är rekordstora och ökar fortfarande.
+ Ökad global efterfrågan och uppreviderad global tillväxt.
+ Produktionen i Venezuela har fallit till den lägsta på decennier.
+ Tekniskt har vi nu mött ett primärt mål för uppgången.
– Fortsatt uppbyggnad av långa spekulativa positioner trots fallande pris. Risk för stopp loss försäljningar.
– Fortsatt ökning av nya borriggar.
– Troligt att dollarn återtar en del förlorad mark givet oron.
– Nettopositioneringen, Brent + WTI, har nått nytt rekord.
– Amerikansk produktion, enligt EIA, når 10.3m fpd under 2018, en upprevidering med 300k fpd sedan föregående månad.
– De geopolitiska riskerna har minskat något.
– Antalet borrade men inte igångsatta oljebrunnar, s.k. DUC’s (Drilled but UnCompleted) bara ökar (brist på ”frackers”?).
– Tekniskt sett en möjlig huvud/skuldra toppformation och om det stämmer, ytterligare lägre priser som följd.
Tillgängliga certifikat:
BULL OLJA X1, X2, X4, X5, & X10 S
BEAR OLJA X1, X2, X4, X5 & X10 S
NICKEL
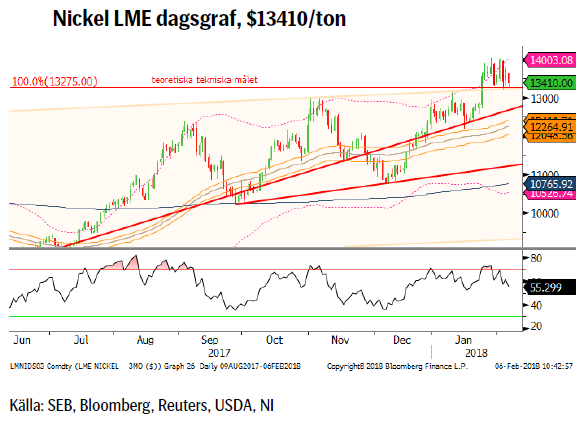 Priset har nu stabiliserats strax ovanför taket på den två år långa stigande kanalen. Det som håller priset uppe är sannolikt det fortsatta rallyt i kobolt (+25 % sedan december) vilket ökar trycket på att utveckla katoder (för batterier) baserade på andra billigare metaller såsom nickel och mangan. Men för att försvara ytterligare högre nickelpriser behövs en rejäl uppskalning av elbilsförsäljningen och inte minst vilken katodmix som kommer att bli den dominerande bland batteritillverkarna (idag finns åtminstone fem olika katoder för litiumbatterier att välja mellan).
Konklusion: Se upp för säljare vid återinträde i den tidigare stigande parallellkanalen.
OBSERVATIONER
+ Billigare för batteritillverkare än kobolt.
+ 2017 kommer att landa på ett underskott och även 2018 spås göra så.
+ Rostfritt har gått starkare än förväntat.
+ IMF har justerat upp global tillväxt och utsikterna i närtid goda.
+ Lång spekulativ nettopositionering ökade till den högsta på ett år och det är långa kontrakt som öppnas upp.
+ Fallande dollar har pressat upp metallpriserna.
+ Ökad optimism i råvaror vilket leder till inflöden i råvarufonder.
+ Optimism om elbilssektorn (vilket är för tidigt, tror jag).
+ Kostnadsgolvet har stigit.
+ Tekniskt en positiv signal att vi brutit upp ur den stigande kanalen.
– Större än förväntad kinesisk produktion.
– Lagren är stora men ses fortsätta falla 2018/2019.
– Indonesisk export kommer att öka årligen de närmaste åren.
– Australien har flera nya projekt på gång.
– Om det klarnar runt miljölagarna på Filippinerna.
– Se upp för mars som tillsammans med maj är den sämsta månaden de senaste tio åren.
– Kinesisk skulduppbyggnad oroande snabb/hög vilken möts av stigande räntor.
– Lägre infrastruktur och bostadsinvesteringar i Kina.
– Negativ divergens i flera tidsintervall.
Tillgängliga certifikat:
BULL NICKEL X1, X2 & X4 S
BEAR NICKEL X1, X2 & X4 S
GULD
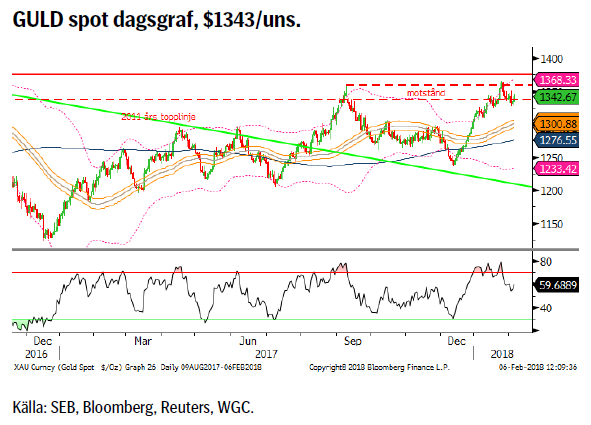 Å ena sidan något starkare dollar och högre räntor å andra sidan kraftig börsoro och stigande volatilitet. Än så länge har dock guldet inte rört sig mycket. Dock följde vi det historiska mönstret och steg (2.84 %) i januari vilket gör att 7/10 senaste åren har varit positiva. Även februari har ett likadant mönster så vi får väl se om vi kan få ett nytt test av motståndsområdet, det talar i alla fall säsongsmönstret för. Den långa nettopositioneringen har minskat och det beror nästan helt på att långa kontrakt stängts.
Konklusion: Än så länge svag respons på börsoron.
OBSERVATIONER
+ Newcrest Mining rapporterade om ett betydligt högre kostnadsgolv 2017.
+ Inflationstrycket i USA fortsätter upp, nu senast med löneökningstakten lite över förväntat.
+ Rykten om minskad moms (f.n. 18 %) på investeringsguld i Ryssland
+ Nedgången i Bitcoin bara fortsätter.
+ Säsongsmässigt så är januari och februari normalt sett relativt bra månader för guldet.
+ Utvecklingen av den kinesiska guld ETF marknaden.
+ Efterfrågan på mynt och tackor drevs framför allt av kineser.
+ Shariastandarden för guld är långsiktigt positivt.
+ Tekniskt så är vi nu väl ovanför 55d mv bandet.
– Den spekulativa (både netto och brutto) långa positioneringen har minskat.
– Reaktionen på börsnedgången fortsatt begränsad.
– En större dollarkorrektion bör snart vara på väg.
– Klubbandet av den amerikanska skattererformen.
– Dåligt gensvar på spänningarna Saudiarabien/Iran.
– Venezuelas betalar nu läkemedelsimport med guld.
– Realräntorna är i stigande.
– $1350/75 området måste passeras innan en positivare vy appliceras.
– Tekniskt sett så är det negativt att marknaden stöttes bort från motståndsområdet.
Tillgängliga certifikat:
BULL GULD X1, X2, X4, X5 & X10 S
BEAR GULD X1, X2, X4, X5 & X10 S
DAX
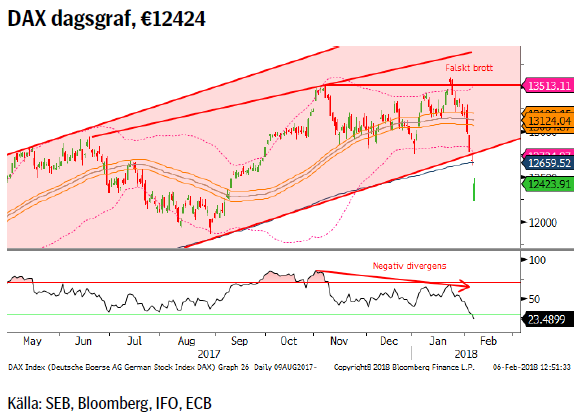 Det falska uppsidesbrottet följde skolboken och attraherade säljarna, dock i en omfattning som naturligtvis inte går att förutse. Nästa slag blev dock brottet under 55dagars bandet (vilket är väldigt illa efter ett falskt brott). Resultatet blev ytterligare försäljningar och en exit ned från de senaste årens stigande parallellkanal. Med RSI fortsatt fallande så är det troligt att vi ännu inte sett botten i denna korrektion. Dock kan vi mycket väl återtesta kanalbrottet innan nästa nedgångsfas inträder. Skulle vi dock ta oss tillbaka in i kanalen (och göra så innan februari är slut) ljusnar det dock en hel del.
Konklusion: Botten ur! Trolig rekyl, inte vändning, uppåt.
OBSERVATIONER
+ Historiken, upp 7/10 senaste åren, är positiv för mars.
+ Fortsatt bra ekonomisk statistik (EU & Ty inköpschefsindex).
+ SDP & CDU/CSU fortsätter mejsla fram ett regeringsprogram.
+ Eurozons index för banker har brutit ut på uppsidan.
+ Nu tillväxt i alla euro-länder.
+ ECB lär hålla räntorna låga för lång tid framöver.
+ Den långa vågräkningen är fortsatt positiv (så länge inte 10474 passeras på nedsidan).
– Mycket dålig prisutveckling efter att minimimålet, en ny topp, nåtts.
– Den starka euron bör börja oro ECB.
– IG Metall hotar med storstrejk.
– Tyska långa räntor är fortsatt i stigande 100 % upp sedan mitten av december (0,3 – 0,6 %).
– Brittisk bilförsäljning har fallit kraftigt (en av de största exportmarknaderna för tysk bilindustri).
– Dieselgate (vi har inte sett slutet på detta än).
– Exit den positiva kanalen.
– Tekniskt har vi nu säljsignaler i flera tidsintervall vilka också underbyggs av de negativa divergenserna.
Tillgängliga certifikat:
BULL DAX X2, X5, X10 & X15 S
BEAR DAX X1, X2, X5, X10 & X15 S
USD/SEK
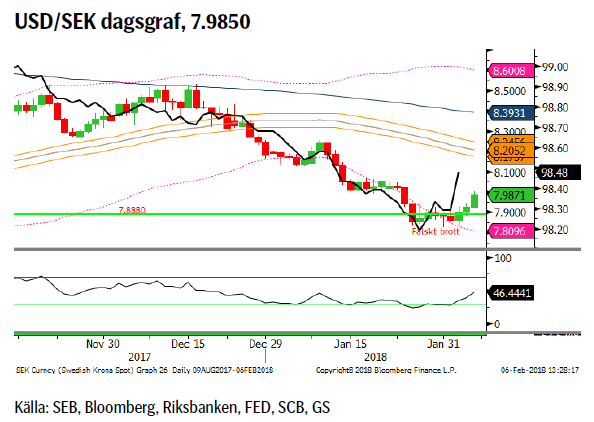 Med en tajtare monetär situation (US financial conditions index innehåller bl.a. räntenivåer, krediter, aktiekurser m.m.), dock upp från den lättaste nivån sedan 1999, verkar aktiemarknaden ha fått stora frossan. Dessutom finns det också en tendens att när index ett pekar mot en stramare situation så stärks även dollarn (se svart linje i grafen nedan). Om det förhållandet fortsatt gäller (och att aktieoron kvarstår) så torde det föranleda en fortsatt rekyl uppåt för dollarn.
Konklusion: Tillbaka över åttan?
OBSERVATIONER
+ Global börsoro har en tendens till att stärka dollar och yen.
+ Inflationen är så sakteliga i stigande i USA varför marknaden nu börjar prisa in fyra snarare än tre höjningar under 2018.
+ Fram tills Riksbanken gör sin första höjning kommer räntedifferensen USA – Sverige att öka.
+ Atlanta FED indikatorn pekar på 5,4 % årstillväxt under kvartal 1 2018.
+ Feds minskning av balansräkningen.
+ Financial conditions pekar mot tajtare monetär situation.
+ Fortsatt rekordkort dollarpositionering mot euron.
+ Det kommande Italienska valet.
+ Amerikansk rapportsäsong har varit mycket starkare än den svenska.
+ Tekniskt sett i en möjlig bottenformation i och med det falska brottet under 7.8880.
– Europa har fortsatt att överraska positivt.
– Överoptimism över det amerikanska skattepaketet.
– Skuldtaket är ännu inte på plats.
– Ökat budgetunderskott och därigenom ökad upplåning.
– Fallande dollar trend.
– Tekniskt är uppgången än så länge dåligt underbyggd med bristande moment.
Tillgängliga certifikat:
BULL USD/SEK X1 & X4 S
BEAR USD/SEK X1 & X4 S
OMXS30
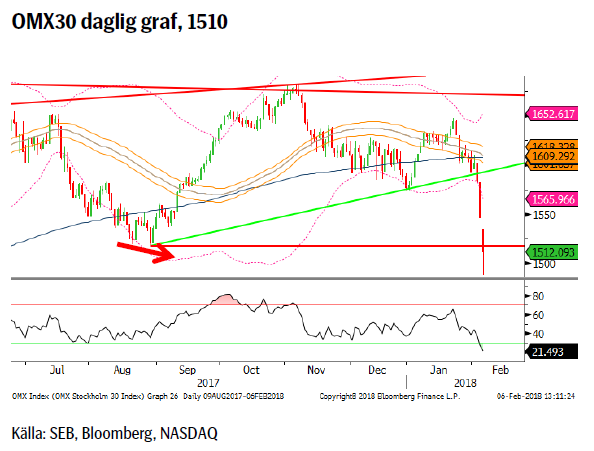 Till slut blev det för många negativa signaler (novembers månadssäljsignal, förr förra veckans veckosäljsignal, fallet under 55d/233d mv samt dödskorset (55 ned under 233d mv). Summa summarum blev tyngden för stor och priset rasade. Tittar vi historiskt så brukar denna typ av brutal nedgång ofta avslutas med någon form av dubbelbotten, ofta i form av en spik under den första botten. Skulle vi åter följa det mönstret så bör vi snart se en lite bättre studs (tillbaka till gapet?) och därefter en ny botten.
Konklusion: Fylla gapet och sedan ned igen?
OBSERVATIONER
+ Säsongsmässigt feb historiskt (upp 8/10 senaste år) starkt.
+ Mjuk Riksbank väntar med första höjningen trots högre KPIF.
+ Svensk ek statistik fortsätter att vara relativt positiv och EU dito allt starkare.
+ Det långsiktiga vågmönstret är fortsatt positivt.
+ Om vi kan stänga tillbaka över 1518 och framför allt 1574.
– Fortsatt bekräftad nedgång för svensk bomarknad.
– PMI vände åter ned.
– Vi har brutit under 55d mv bandet och 233d mv.
– En negativ månadsvändningssignal i november.
– Negativa veckosignaler.
– Vi har nu ett, 55/233d, dödskors på plats.
– Vi har brutit under föregående korrektionsbotten.
Tillgängliga certifikat:
BULL OMX X5, X10 & X15 S
BEAR OMX X1, X5, X10 & X15 S
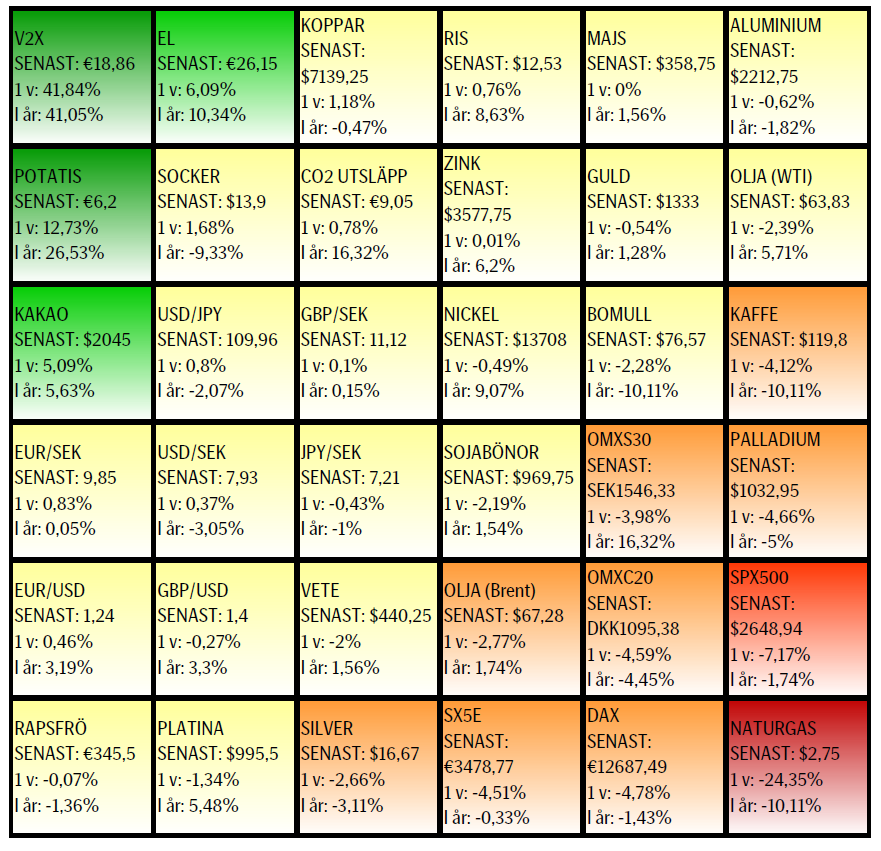
UTVECKLING SENASTE VECKAN SAMT SEDAN ÅRETS BÖRJAN
[box]SEB Veckobrev Veckans råvarukommentar är producerat av SEB:s Commodities Sales desk och publiceras i samarbete och med tillstånd på Råvarumarknaden.se[/box]
KÄLLOR
Bloomberg, Reuters, SEB
VILLKOR
För varje enskilt certifikat/mini future finns Slutliga Villkor som anger de fullständiga villkoren. Slutliga Villkor finns tillgängligt på kurssidan för respektive certifikat/mini future på www.seb.se, Börs & finans, fliken Strukturerade placeringar.
RISKER
En sammanfattning av de risker som är förknippade med Börshandlade certifikat generellt finns i Produktbroschyren för respektive certifikat eller mini future som är tillgängligt på seb.se/cert respektive seb.se/mini. För en fullständig bild av riskerna behöver du ta del av SEB:s offentliggjorda Grundprospekt för Certifikat- och Warrantprogram som är publicerat på www.seb.se/cert respektive seb.se/mini.
DISCLAIMER
Detta marknadsföringsmaterial, framtaget av SEB:s Commodities Sales desk, har upprättats enbart i informationssyfte.
Även om innehållet är baserat på källor som SEB bedömt som tillförlitliga ansvarar SEB inte för fel eller brister i informationen. Den utgör inte oberoende, objektiv investeringsanalys och skyddas därför inte av de bestämmelser som SEB har infört för att förebygga potentiella intressekonflikter. Yttranden från SEB:s Commodities Sales desk kan vara oförenliga med tidigare publicerat material från SEB, då den senare hänvisas uppmanas du att läsa den fullständiga rapporten innan någon åtgärd vidtas.
Dokumentationen utgör inte någon investeringsrådgivning och tillhandahålls till dig utan hänsyn till dina investeringsmål. Du uppmanas att självständigt bedöma och komplettera uppgifterna i denna dokumentation och att basera dina investeringsbeslut på material som bedöms erforderligt. Alla framåtblickande uttalanden, åsikter och förväntningar är föremål för risker, osäkerheter och andra faktorer och kan orsaka att det faktiska resultatet avviker väsentligt från det förväntade. Historisk avkastning är ingen garanti för framtida resultat. Detta dokument utgör inte ett erbjudande att teckna några värdepapper eller andra finansiella instrument. SEB svarar inte för förlust eller skada – direkt eller indirekt, eller av vad slag det vara må – som kan uppkomma till följd av användandet av detta material eller dess innehåll.
Observera att det kan förekomma att SEB, dess ledamöter, dess anställda eller dess moder- och/eller dotterbolag vid olika tillfällen innehar, har innehaft eller kommer att inneha aktier, positioner, rådgivningsuppdrag i samband med corporate finance-transaktioner, investment- eller merchantbanking-uppdrag och/eller lån i de bolag/finansiella instrument som nämns i materialet.
Materialet är avsett för mottagaren, all spridning, distribuering mångfaldigande eller annan användning av detta meddelande får inte ske utan SEB:s medgivande. Materialet riktar sig inte till personer vars medverkan kräver ytterligare prospekt, registrerings- eller andra åtgärder än vad som följer av svensk rätt. Det åligger var och en att iaktta sådana restriktioner. Materialet får inte distribueras i eller till land där distribution kräver ovan nämnda åtgärder eller strider mot reglering i sådant land. Materialet riktar sig således inte till fysiska eller juridiska personer hemmahörande i USA eller i något annat land där publicering eller tillhandahållande av materialet är förbjudet eller strider mot tillämpliga bestämmelser i landet.
Oaktat detta får SEB tillåta omfördelning av materialet till utvald tredje part i enlighet med gällande avtal. Materialet får inte spridas till fysiska eller juridiska personer som är medborgare eller har hemvist i ett land där sådan spridning är otillåten enligt tillämplig lag eller annan bestämmelse.
Skandinaviska Enskilda Banken AB (publ) är ett publikt aktiebolag och står under tillsyn av Finansinspektionen samt de lokala finansiella tillsynsmyndigheter i varje jurisdiktionen där SEB har filial eller dotterbolag.

The latest weekly report from the US DOE showed a substantial drawdown across key petroleum categories, adding more upside potential to the fundamental picture.

Commercial crude inventories (excl. SPR) fell by 5.8 million barrels, bringing total inventories down to 415.1 million barrels. Now sitting 11% below the five-year seasonal norm and placed in the lowest 2015-2022 range (see picture below).
Product inventories also tightened further last week. Gasoline inventories declined by 2.1 million barrels, with reductions seen in both finished gasoline and blending components. Current gasoline levels are about 3% below the five-year average for this time of year.
Among products, the most notable move came in diesel, where inventories dropped by almost 4.1 million barrels, deepening the deficit to around 20% below seasonal norms – continuing to underscore the persistent supply tightness in diesel markets.
The only area of inventory growth was in propane/propylene, which posted a significant 5.1-million-barrel build and now stands 9% above the five-year average.
Total commercial petroleum inventories (crude plus refined products) declined by 4.2 million barrels on the week, reinforcing the overall tightening of US crude and products.


A classic case of “buy the rumor, sell the news” played out in oil markets, as Brent crude has dropped sharply – down nearly USD 10 per barrel since yesterday evening – following Iran’s retaliatory strike on a U.S. air base in Qatar. The immediate reaction was: “That was it?” The strike followed a carefully calibrated, non-escalatory playbook, avoiding direct threats to energy infrastructure or disruption of shipping through the Strait of Hormuz – thus calming worst-case fears.
After Monday morning’s sharp spike to USD 81.4 per barrel, triggered by the U.S. bombing of Iranian nuclear facilities, oil prices drifted sideways in anticipation of a potential Iranian response. That response came with advance warning and caused limited physical damage. Early this morning, both the U.S. President and Iranian state media announced a ceasefire, effectively placing a lid on the immediate conflict risk – at least for now.
As a result, Brent crude has now fallen by a total of USD 12 from Monday’s peak, currently trading around USD 69 per barrel.
Looking beyond geopolitics, the market will now shift its focus to the upcoming OPEC+ meeting in early July. Saudi Arabia’s decision to increase output earlier this year – despite falling prices – has drawn renewed attention considering recent developments. Some suggest this was a response to U.S. pressure to offset potential Iranian supply losses.
However, consensus is that the move was driven more by internal OPEC+ dynamics. After years of curbing production to support prices, Riyadh had grown frustrated with quota-busting by several members (notably Kazakhstan). With Saudi Arabia cutting up to 2 million barrels per day – roughly 2% of global supply – returns were diminishing, and the risk of losing market share was rising. The production increase is widely seen as an effort to reassert leadership and restore discipline within the group.
That said, the FT recently stated that, the Saudis remain wary of past missteps. In 2018, Riyadh ramped up output at Trump’s request ahead of Iran sanctions, only to see prices collapse when the U.S. granted broad waivers – triggering oversupply. Officials have reportedly made it clear they don’t intend to repeat that mistake.
The recent visit by President Trump to Saudi Arabia, which included agreements on AI, defense, and nuclear cooperation, suggests a broader strategic alignment. This has fueled speculation about a quiet “pump-for-politics” deal behind recent production moves.
Looking ahead, oil prices have now retraced the entire rally sparked by the June 13 Israel–Iran escalation. This retreat provides more political and policy space for both the U.S. and Saudi Arabia. Specifically, it makes it easier for Riyadh to scale back its three recent production hikes of 411,000 barrels each, potentially returning to more moderate increases of 137,000 barrels for August and September.
In short: with no major loss of Iranian supply to the market, OPEC+ – led by Saudi Arabia – no longer needs to compensate for a disruption that hasn’t materialized, especially not to please the U.S. at the cost of its own market strategy. As the Saudis themselves have signaled, they are unlikely to repeat previous mistakes.
Conclusion: With Brent now in the high USD 60s, buying oil looks fundamentally justified. The geopolitical premium has deflated, but tensions between Israel and Iran remain unresolved – and the risk of missteps and renewed escalation still lingers. In fact, even this morning, reports have emerged of renewed missile fire despite the declared “truce.” The path forward may be calmer – but it is far from stable.
Analys
A muted price reaction. Market looks relaxed, but it is still on edge waiting for what Iran will do
Brent crossed the 80-line this morning but quickly fell back assigning limited probability for Iran choosing to close the Strait of Hormuz. Brent traded in a range of USD 70.56 – 79.04/b last week as the market fluctuated between ”Iran wants a deal” and ”US is about to attack Iran”. At the end of the week though, Donald Trump managed to convince markets (and probably also Iran) that he would make a decision within two weeks. I.e. no imminent attack. Previously when when he has talked about ”making a decision within two weeks” he has often ended up doing nothing in the end. The oil market relaxed as a result and the week ended at USD 77.01/b which is just USD 6/b above the year to date average of USD 71/b.

Brent jumped to USD 81.4/b this morning, the highest since mid-January, but then quickly fell back to a current price of USD 78.2/b which is only up 1.5% versus the close on Friday. As such the market is pricing a fairly low probability that Iran will actually close the Strait of Hormuz. Probably because it will hurt Iranian oil exports as well as the global oil market.
It was however all smoke and mirrors. Deception. The US attacked Iran on Saturday. The attack involved 125 warplanes, submarines and surface warships and 14 bunker buster bombs were dropped on Iranian nuclear sites including Fordow, Natanz and Isfahan. In response the Iranian Parliament voted in support of closing the Strait of Hormuz where some 17 mb of crude and products is transported to the global market every day plus significant volumes of LNG. This is however merely an advise to the Supreme leader Ayatollah Ali Khamenei and the Supreme National Security Council which sits with the final and actual decision.
No supply of oil is lost yet. It is about the risk of Iran closing the Strait of Hormuz or not. So far not a single drop of oil supply has been lost to the global market. The price at the moment is all about the assessed risk of loss of supply. Will Iran choose to choke of the Strait of Hormuz or not? That is the big question. It would be painful for US consumers, for Donald Trump’s voter base, for the global economy but also for Iran and its population which relies on oil exports and income from selling oil out of that Strait as well. As such it is not a no-brainer choice for Iran to close the Strait for oil exports. And looking at the il price this morning it is clear that the oil market doesn’t assign a very high probability of it happening. It is however probably well within the capability of Iran to close the Strait off with rockets, mines, air-drones and possibly sea-drones. Just look at how Ukraine has been able to control and damage the Russian Black Sea fleet.
What to do about the highly enriched uranium which has gone missing? While the US and Israel can celebrate their destruction of Iranian nuclear facilities they are also scratching their heads over what to do with the lost Iranian nuclear material. Iran had 408 kg of highly enriched uranium (IAEA). Almost weapons grade. Enough for some 10 nuclear warheads. It seems to have been transported out of Fordow before the attack this weekend.
The market is still on edge. USD 80-something/b seems sensible while we wait. The oil market reaction to this weekend’s events is very muted so far. The market is still on edge awaiting what Iran will do. Because Iran will do something. But what and when? An oil price of 80-something seems like a sensible level until something do happen.


Sommarvädret styr elpriset i Sverige

Samtal om flera delar av råvarumarknaden
Tightening fundamentals – bullish inventories from DOE

Jonas Lindvall är tillbaka med ett nytt oljebolag, Perthro, som ska börsnoteras

Oljan, guldet och marknadens oroande tystnad

Stor uppsida i Lappland Guldprospekterings aktie enligt analys

Brookfield ska bygga ett AI-datacenter på hela 750 MW i Strängnäs
Silverpriset släpar efter guldets utveckling, har mer uppsida

Uppgången i oljepriset planade ut under helgen

Låga elpriser i sommar – men mellersta Sverige får en ökning
-
 Nyheter3 veckor sedan
Stor uppsida i Lappland Guldprospekterings aktie enligt analys
-
 Nyheter4 veckor sedan
Brookfield ska bygga ett AI-datacenter på hela 750 MW i Strängnäs
-
 Nyheter3 veckor sedan
Silverpriset släpar efter guldets utveckling, har mer uppsida
-
 Nyheter3 veckor sedan
Uppgången i oljepriset planade ut under helgen
-
 Nyheter3 veckor sedan
Låga elpriser i sommar – men mellersta Sverige får en ökning
-
Analys3 veckor sedan
Very relaxed at USD 75/b. Risk barometer will likely fluctuate to higher levels with Brent into the 80ies or higher coming 2-3 weeks
-

 Nyheter2 veckor sedan
Mahvie Minerals växlar spår – satsar fullt ut på guld
-
 Nyheter1 vecka sedan
Oljan, guldet och marknadens oroande tystnad