

Analys
SEB Råvarubrev 19 maj 2015

Varoufakis Trusted Investments LLC – ”we dig gold!”
 MARKNADEN I KORTHET
Förra veckan gick råvaror generellt sett starkt med en uppgång i SEB:s råvaruindex – vilket i sig är möjligt att handla genom våra börshandlade certifikat! – om cirka 1 procent. Detta var bättre än aktier globalt sett och det var bara Asienbörserna som orkade upp till en liknande eller högre nivå. Energisektorn gick starkt och drogs upp av ökningar i råolja. Vi ser dock att långa spekulativa positioner i Brentolja har börjat falla och OPEC fortsätter att ligga på en mycket hög produktionsnivå. Samtidigt rör vi oss förvisso mot en period med ökad efterfrågan på inte minst bensin.
Bland jordbruksprodukterna gick priset på vete kraftigt upp då regn i USA riskerar att förstöra delar av skörden. Priset på socker gick å sin sida kraftigt åt motsatta hållet, det vill säga ned, vilket var i linje med vår rekommendation. Rörelsen berodde mycket på en indisk skörd större än förväntad. Däremot steg priset på kaffe då brasilianska bönder plötsligt började lagra sina bönor som en reaktion på att man anser att priset är för lågt. Vi tar därför hem vinsten på vår sockerrekommendation, men ligger kvar i vår korta kafferekommendation då vi tycker att det ändå finns ett fundamentalt nedåttryck i priset. Dock måste man noga följa utvecklingen av en annalkande el Niño, vilken sannolikt kommer vara en mycket viktig faktor för kaffe- och sockerpriserna de kommande månaderna.
Den sektor som gick starkast bland råvarorna var dock ädelmetaller, där guldet och silvret – det senare uppträder ofta som guldet men med större svängningar – gick upp 3 respektive 6,7 procent över veckan. Dock försvagades US-dollarindex med cirka 1,75 procent, vilket är en del av förklaringen. I detta nummer av Råvarubrevet initierar vi en köprekommendation på guld, men inte enbart baserat på den senaste tidens svagare US-dollar. Vi tror att guldpriset kommer att fortsätta uppåt då volatiliteten i euron, driven högre av oron kring Grekland och en eventuell Grexit, kommer att göra att investerare söker sig till guld. Det finns också ett gott övrigt fundamentalt stöd för ett högre guldpris, såsom att det mycket sällan har gått under en nivå som korresponderar mot vad som ungefärligt är stora producenters marginalkostnad för produktion av metallen. I stycket om guld förklarar vi våra tankar i en litet längre text än vad vi brukar ha med. Detta då caset bygger på just nu aktuella faktorer och är av något litet bredare karaktär. Läs mer där!
Vi diskuterar också rörelser i basmetaller och initierar återigen en kort rekommendation i aluminium, som vi tror kommer gå ned i pris baserat bland annat på att Kina producerar rekordnivåer av metallen och dessutom exporterar mer och mer.
TRENDER I SAMMANDRAG
- Överlag en stark tidigare vecka för råvaror
- Guldpriset kommer stärkas på basis av ytterligare oro relaterad till Grekland
- Snart köpläge på Brentolja, men det lär löna sig att vänta på en bättre ingångsnivå
- el Niño en avgörande faktor framöver för priset på kaffe och socker. Fundamentalt nedåttryck finns kvar, men priset kan sticka iväg uppåt på grund av vädereffekterna
- Priset på aluminium lär sjunka då Kina producerar och exporterar allt mer
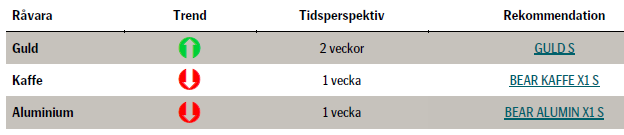
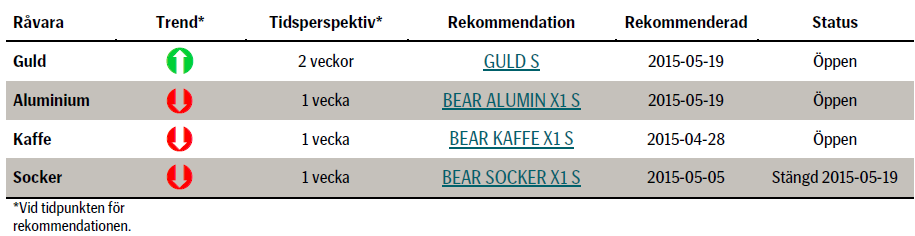
VECKANS REKOMMENDATIONER
En placering i certifikat och warranter är förknippat med risker. Du kan förlora hela ditt investerade kapital. Läs mer om riskerna i SEB:s offentliggjorda Grundprospekt för certifikat- och warrantprogram på seb.se/cert eller seb.se/mini.
OLJA
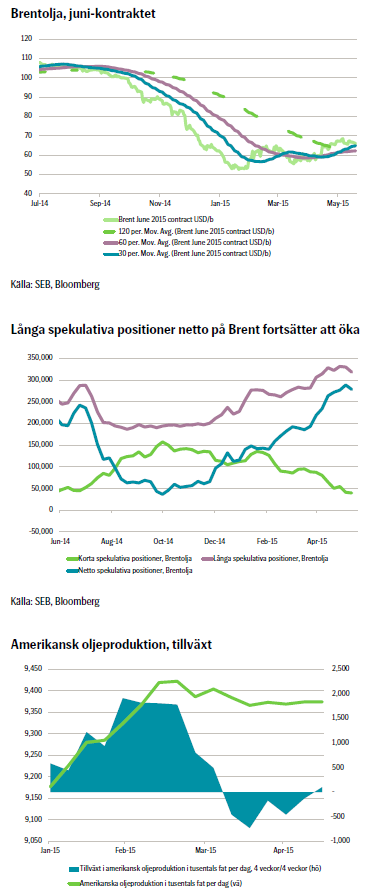 Brentoljepriset steg med 1 procent förra veckan och stängde på 66,81 US-dollar per fat. Givet att US-dollarindex försvagades med 1,8 procent under samma period var det dock inte mycket till ökning. Veckans högsta notering var 68,52 US-dollar per fat och det såg aldrig riktigt ut som om priset skulle ta sig över 70 US-dollar per fat vilket det gjorde förra veckan. Marknaden hade en känsla av en viss svaghet i priset och köparna verkade vara försiktiga.
Internationella Energirådet (IEA) släppte förra veckan sin månatliga rapport och den kalkylerade balansen mellan utbud och efterfrågan såg negativ ut för priset. IEA justerade ned sitt estimerade behov för OPEC-olja under 2015 från 29,5 till 29,2 miljoner fat per dag baserat på ett prognosticerat högre utbud från andra producenter än OPEC. Trots detta producerade OPEC 31,2 miljoner fat per dag i april och i genomsnitt i år 30,7 miljoner fat. Därför borde globala oljelager jämfört med säsongsnormalen ha ökat med ungefär 180 miljoner fat under årets första fyra månader. OECD:s oljelager har dock bara ökat med 45 miljoner fat, vilket skulle innebära att det har byggts upp ytterligare lager med olja utanför OECD om 135 miljoner fat och dessutom på tvärs mot säsongstrenden. Detta är mycket svårt att precisera och värdera.
Vad som däremot är mycket klart är att OECD-lager utanför USA är mindre än vad som är normalt. Global oljeproduktion har växt starkt i den supertunna delen av spektrumet medan efterfrågan från raffinaderier är mot mitten av spektrumet vad gäller vikten på råoljan. Då tillväxten i efterfrågan för supertunna råoljor är begränsad och det finns begränsad möjlighet att exportera, så bygger USA fortsatt upp sina oljelager, samtidigt som man fortsätter att vara världens näst största råoljeimportör. OPEC fortsätter att lyfta sina officiella priser (OSPs) vilket visar att de har ringa problem att få sin höga produktion av råolja såld.
Det finns en svaghet i den fysiska handeln av lätta råoljelaster över Atlanten och spekulativa positioner i både WTI och Brent har börjat falla. Icke desto mindre rör vi oss mot en tid av högre en efterfrågan i juni och sedan juli. OECD-lager är som konstaterat mindre än normalt utanför USA och OPEC producerar redan på mycket höga nivåer. Den globala bensinmarknaden är pressad redan innan vi går in i säsongen av ökad efterfrågan. En kraftig försvagning i US-dollarn har den senaste tiden hjälpt till att trycka oljepriset uppåt. Nu är det omvänt. US-dollarn stärks och oljepriset faller tillbaka.
TREND
- Bullish i juli, men väntar på en lägre ingångsnivå på priset
- Investerare reducerar sina långa positioner. Detta är bearish på kort sikt
- Amerikanska skifferoljeriggar lär öka i antal i juni. Ger bearish känsla i marknaden, men ännu mer supertunn råolja är inte vad marknaden efterfrågar
- OECD-lager av olja är under normal nivå utanför USA och OPEC producerar på en mycket hög nivå. Global efterfrågan på bensin är redan pressad då vi nu rör oss mot säsongen med högst efterfrågan
REKOMMENDATION
- Var beredd att köpa, men vänta på lägre ingångsnivå
Bjarne Schieldrop
Chefsanalytiker råvaror
SEB
GULD
Den magiska metallen guld har haft en intressant utveckling senaste tiden. Från att många förutspått att den skulle falla i pris har den delvis på grund av vikande US-dollarkurs och Greklandsdebacle återigen hamnat i fokus för uppgång. Vi tror att guldpriset kommer att stärkas baserat på några fundamentala faktorer:
 För varje deadline som Grekland närmar sig gällande landets skuldåterbetalning eller relaterad till landets bail-out, så kommer euro-kursen i allt högre grad bli driven av rubriker; oavsett hur trolig en Grexit egentligen är. Vi har senaste veckorna sett stor osäkerhet inför skuldförfall till IMF och senast förra veckan visade det sig att landet använde IMF-pengar för att betala ett förfall till just IMF. Om två veckor har landet ett ytterligare förfall att betala till Valutafonden.
Vi närmar oss också en annan mycket viktig deadline: Slutet på Greklands bail-outprogram, vilket är sista juni. Då skall landet kunna stå på egna ben och på pappret vara som vilket EMU-land som helst. Rent krasst verkar det inte vara så sannolikt. Volatiliteten i euron kommer framöver därför troligtvis öka än mer än vad den redan har gjort.
Anledningen är också att många tror på en ökad sannolikhet för att ytterligare länder skall vilja lämna euron givet att Grekland gör det. Hur sannolikt är dock detta? Rent krasst kan man tänka sig att omvärldens vetskap om EMU:s ekonomiska förutsättningar är stora, men det kanske är svårare att förstå och kvantifiera hur viktiga EU och EMU egentligen är för Europas människor. Hur många vet exempelvis att Angela Merkel är uppvuxen i DDR? Det är sannolikt en anledning till att förbundskanslern, en av EU:s och EMU:s viktigaste personer, bevisligen har arbetat obevekligt för att rädda valutaunionen. Många är de européer som ser unionerna som de projekt för fred och stabilitet vilka är fundamenten för dem. Hur som helst prisar omvärlden ändå in en viss sannolikhet för en kris i euron och för varje deadline Grekland närmar sig kommer volatiliteten i valutan med största sannolikhet att öka. Detta är någonting som flertalet investerare finner vara mindre önskvärt och kommer därför se sig om efter andra placeringar.
Vad betyder detta ur ett råvaruperspektiv? Vad har detta med guldpriset att göra? Om man identifierar åtta (8) tillfällen från år 2000 då euron kraftigt har försvagats mot US-dollarn – exempelvis finanskrisens utbrott 2008, ECB:s första stora långa refinansieringsomgång 2009 samt Greklands konkurs 2012 – och ser hur guldpriset har utvecklats, så ser man att det två månader efteråt har gått ned i genomsnitt mindre än en procent. Man skulle kunna tänka sig att investerare i stor grad har flytt från euron till US-dollarn under flera av dessa tillfällen och generellt borde gälla att guldet försvagas när US-dollarn stärks.
Intressant och viktigt i sammanhanget är att US-dollarindex och euro-index tidigare i stor utsträckning har varit varandras motsatser, det vill säga att US-dollarn generellt sett har stärkts när euron har försvagats och vice versa, men sedan något år verkar det inte gälla i riktigt samma utsträckning. Nu råder också olika uppfattningar i marknaden om när Fed kommer höja räntan och senaste tidens data från USA har som bekant överraskat på nedsidan. US-dollarindex har också försvagats senaste månaderna.
Sammantaget kan oro relaterad till Grekland mycket väl leda till att vi kommer att se en generellt svagare euro, men inte automatiskt en generellt sett starkare US-dollar men även om detta skulle hända så finns argument för ett högre guldpris.
Ovan har vi lärt oss att guldpriset historiskt sett i genomsnitt har varit oförändrat till något litet lägre då euron har försvagats och US-dollarn ofta har stärkts. Senaste veckorna har vi sett en rörelse mot högre räntor både i USA och i Europa, samtidigt som US-dollarn likväl är inne i en period med en trend mot svagare nivåer. Det skulle mycket väl kunna leda till att guldpriset denna gång inte bara ligger kvar oförändrat, utan även stärks och vi har redan sett en rörelse mot högre nivåer. Vi tror därför att guldet, som ofta ses som en valuta, sannolikt kommer stärkas prismässigt då investerare köper guld för att undslippa ökad volatilitet i valutorna.
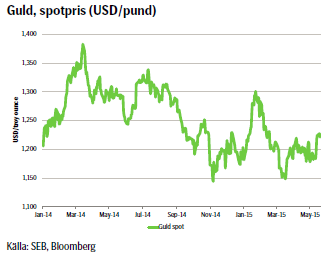
Vidare finns andra fundamentala faktorer som talar för ett starkare guldpris: Vi ser att guldet har varit nere under 1200 US-dollar per pund bara ett fåtal gånger sedan 2010 och då varje gång under kort tid. En del av förklaringen är att stora producenter av både nybrutet samt återvunnet guld har en marginalkostnad av produktion under längre tid kring 1100-1200 US-dollar per pund. Det i sig ger onekligen ett starkt fundamentalt stöd för priset, som idag ligger på nivåer kring 1220 US-dollar per pund och har börjat en klättring uppåt.
När man talar om högre räntor och guld vill man kanske också nämna något om inflationen, även om vi idag ser en mycket låg inflationstakt både i Europa och USA: Tittar vi historiskt över lång tid på årlig prisförändring på guld mot inflation, så ser man inget tydligt mönster. Däremot är det tydligt att inflationen i sig generellt i västvärlden har rört sig nedåt över en längre tid.
Sammantaget tror vi alltså på ett guldpris som kommer att stärkas i och med att volatiliteten i euron ytterligare kommer att öka. Huvudscenariot är att man går lång i guld fram till sista datumet för Greklands bail out-program, det vill säga sista juni, och då utvärderar situationen. Förstärkningen i guld kan dock mycket väl fortsätta efter det; både baserat på fortsatt rörelse i euron samt även en ytterligare försvagning i US-dollarn beroende på eventuell fortsatt svag utveckling och data. Det är dock delvis ett annat case.
TREND
- Greklandsoro kommer öka volatiliteten i euron
- Investerare ser sig om efter säkrare investering
- Guldpriset har fundamentalt stöd vid nivån kring 1200 US-dollar per pund
- Vi tror att guldpriset kommer att stiga under tiden som Grekland skapar fortsatt finansiell oro.
REKOMMENDATION
- GULD S – men håll koll på volatiliteten!
KAFFE
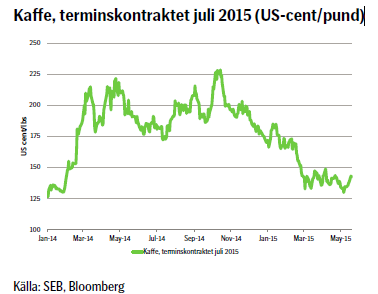 Sedan förra veckan har vi som vi trodde mycket riktigt sett försök att fortsätta sälja, följt av en konsolidering. Marknaden testade det förra veckan konstaterade motståndet vid 136,7 US-cent per pund men bröt igenom uppåt på torsdagen. Anledningen var sannolikt rapporter om att Australiensiska meteorologer sällade sig till sina amerikanska och japanska kollegor, vilka ser ett utbrott av el Niño som mer sannolikt. Man har sett signifikanta tecken över tropiska Stilla Havet. Kaffe och eventuellt också socker är några av de råvaror som riskerar att få störst påverkan i priset. Det är dock inte alls säkert att utvecklingen ger stöd för ett högre kaffepris – det beror helt på hur starka och långvariga effekterna blir, samt när de faktiskt kommer.
Någonting som ger fundamentalt stöd för kaffepriset är att en del brasilianska bönder har vägrat sälja sitt kaffe och nu istället lagrar det. Man tycker helt enkelt att priset är för lågt. Vidare har något mer kaffe av föregående års skörd sålts jämfört med året innan. Också en relativt stor andel av innevarande års skörd har redan sålts – det rapporteras om 15 procent – vilket tyder på god global efterfrågan och kanske högre än vad marknaden har räknat med. Dock är antagligen den främsta förklaringen att den brasilianska realen har stärkts mot US-dollarn. Sedan mitten av mars har realen varit i en trend mot förstärkning, vilket förvisso snarare har att göra med att amerikansk data har kommit in sämre än förväntat än att Brasiliansk ekonomi har gått relativt mycket bättre.
Fundamentalt tror vi fortfarande på ett lägre kaffepris, men en el Niño med potentiellt allvarliga effekter i kombination med en, som vi tror tillfälligt, starkare brasiliansk real har ställt till det. Förvisso tror vi att realen är i en korrektionsfas och skall fortsätta försvagas framöver. Det tekniska perspektivet ger fortfarande att kaffet är i en konsolideringsfas på väg nedåt. Priset testar lokala toppar, men trenden är negativ.
Sammantaget tror vi fundamentalt på ett lägre kaffepris och väljer trots allt att ligga kvar i vår rekommendation. Den aktive investeraren köper bear-certifikat och håller koll på nyheter kring el Niño.
TREND
- Pris i konsolidering mot lägre nivå
- Brasiliansk real i konsolidering mot lägre nivå
- Vi tror på ett lägre kaffepris, men eventuella effekter av el Niño oroar
REKOMMENDATION
- BEAR KAFFE X1 S – men håll koll på rapporter om el Niño!
EL
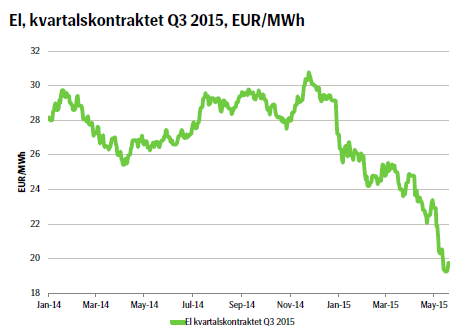 Med risk för att låta som en trasig LP-spelare måste vi återigen konstatera att mycket litet har förändrats i den Nordiska elmarknaden och marknaden fortsätter hela tiden att testa nya lägre nivåer. Tidigare konstaterade vi att priset bröt igenom nivån 22 euro per MWh men förra veckan bröt man även igenom nivån 20 euro per MWh.
Vi har senaste tiden haft en period med kallare temperatur än normalt, men denna tid på året ger det ingen större effekt på priset även om det ger ett visst stöd. Kolpriset har mer eller mindre rört sig sidledes, medan utsläppsrätter har handlat något litet dyrare under veckan. Den hydrologiska balansen är fortsatt i överskott och nivån börjar närma sig 10 TWh.
Meteorologerna har börjat varna för höga flöden i de nordliga vattendragen, men det svalare vädret gör att snösmältningen går långsammare. Det betyder förstås egentligen att man bara skjuter flödena på framtiden, vilket heller inte ger ett stöd för ett högre elpris.
Vi ser nog tyvärr inget annat alternativ än att repetera vad vi har konstaterat ett tag nu, nämligen att det fortfarande är press nedåt på priset men att vi trots det inte riktigt vågar ge en skarp säljrekommendation. En aktiv investerare kan förstås fortsatt sälja på lokala toppar. Det har vi sagt ett tag nu och priset har hela tiden pressats nedåt, men vi väljer att repetera detta. Det har dock som konstaterat visat sig att man kan tjäna pengar på marknadens svängningar!
TREND
- Priset på Nordisk el fortsätter att vara pressat på nedsidan
- Snösmältningen fördröjs något av det svalare vädret
- En aktiv investerare kan fortfarande köpa bear-certifikat på lokala toppar och bull-certifikat i lokala dalar
BASMETALLER
 Under veckan som gått har vi sett hemtagning av vinster över hela linjen – undantaget är kopparn, vilken höll emot bättre under förra veckan. De finansiella aktörerna har som vi tidigare har konstaterat i viss mån så att säga gått före marknaden. Det är således viktigt att efterfrågan faktiskt kommer ikapp nuvarande prisnivå – annars finns risk för besvikelser och en rekyl i priset.
Den metall som vi tror kommer att hålla trenden bäst just nu är zink. Prognosen är baserad på ett förväntat stort underskott i utbudet. Marknaden för nickel ser dock snarast ut att gå sidledes.
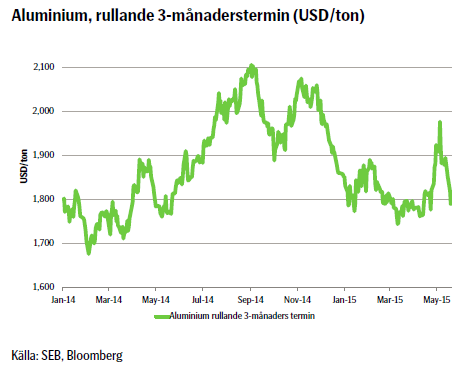
Aluminium å sin sida har återgått till ett mer normalt läge där vi ser bra contago i den kortare delen av kurvan. Detta innebär att spotpriset är lägre än kontrakt med förfall längre fram i tiden. Detta kan få effekten att material återigen stoppas in i finansieringsupplägg och följaktligen ser vi högre premier igen.
Vidare kommer också signaler om att Kina producerar rekordmängder av aluminium och därtill, som vi tidigare konstaterat, genom exportlättnader kommer att integrera den kinesiska marknaden för aluminium med den internationella. Det ser med andra ord ut som om priset på aluminium kommer att fortsätta att gå ned. Vi väljer därför att återinitiera en negativ vy på aluminium på kortare sikt.
TREND
- Hemtagning av vinst generellt i basmetaller
- Sannolikt underskott i utbudet av zink
- Vi tror dock att priset på aluminium kommer att gå ned baserat på fundamentala faktorer
REKOMMENDATION
- BEAR ALUMIN X1 S
AKTUELLA REKOMMENDATIONER
[box]SEB Veckobrev Veckans råvarukommentar är producerat av SEB:s Commodities Sales desk och publiceras i samarbete och med tillstånd på Råvarumarknaden.se[/box]
KÄLLOR
Bloomberg, Reuters, SEB
VILLKOR
För varje enskilt certifikat/mini future finns Slutliga Villkor som anger de fullständiga villkoren. Slutliga Villkor finns tillgängligt på kurssidan för respektive certifikat/mini future på www.seb.se, Börs & finans, fliken Strukturerade placeringar.
RISKER
En sammanfattning av de risker som är förknippade med Börshandlade certifikat generellt finns i Produktbroschyren för respektive certifikat eller mini future som är tillgängligt på seb.se/cert respektive seb.se/mini. För en fullständig bild av riskerna behöver du ta del av SEB:s offentliggjorda Grundprospekt för Certifikat- och Warrantprogram som är publicerat på www.seb.se/cert respektive seb.se/mini.
DISCLAIMER
Detta marknadsföringsmaterial, framtaget av SEB:s Commodities Sales desk, har upprättats enbart i informationssyfte.
Även om innehållet är baserat på källor som SEB bedömt som tillförlitliga ansvarar SEB inte för fel eller brister i informationen. Den utgör inte oberoende, objektiv investeringsanalys och skyddas därför inte av de bestämmelser som SEB har infört för att förebygga potentiella intressekonflikter. Yttranden från SEB:s Commodities Sales desk kan vara oförenliga med tidigare publicerat material från SEB, då den senare hänvisas uppmanas du att läsa den fullständiga rapporten innan någon åtgärd vidtas.
Dokumentationen utgör inte någon investeringsrådgivning och tillhandahålls till dig utan hänsyn till dina investeringsmål. Du uppmanas att självständigt bedöma och komplettera uppgifterna i denna dokumentation och att basera dina investeringsbeslut på material som bedöms erforderligt. Alla framåtblickande uttalanden, åsikter och förväntningar är föremål för risker, osäkerheter och andra faktorer och kan orsaka att det faktiska resultatet avviker väsentligt från det förväntade. Historisk avkastning är ingen garanti för framtida resultat. Detta dokument utgör inte ett erbjudande att teckna några värdepapper eller andra finansiella instrument. SEB svarar inte för förlust eller skada – direkt eller indirekt, eller av vad slag det vara må – som kan uppkomma till följd av användandet av detta material eller dess innehåll.
Observera att det kan förekomma att SEB, dess ledamöter, dess anställda eller dess moder- och/eller dotterbolag vid olika tillfällen innehar, har innehaft eller kommer att inneha aktier, positioner, rådgivningsuppdrag i samband med corporate finance-transaktioner, investment- eller merchantbanking-uppdrag och/eller lån i de bolag/finansiella instrument som nämns i materialet.
Materialet är avsett för mottagaren, all spridning, distribuering mångfaldigande eller annan användning av detta meddelande får inte ske utan SEB:s medgivande. Materialet riktar sig inte till personer vars medverkan kräver ytterligare prospekt, registrerings- eller andra åtgärder än vad som följer av svensk rätt. Det åligger var och en att iaktta sådana restriktioner. Materialet får inte distribueras i eller till land där distribution kräver ovan nämnda åtgärder eller strider mot reglering i sådant land. Materialet riktar sig således inte till fysiska eller juridiska personer hemmahörande i USA eller i något annat land där publicering eller tillhandahållande av materialet är förbjudet eller strider mot tillämpliga bestämmelser i landet.
Oaktat detta får SEB tillåta omfördelning av materialet till utvald tredje part i enlighet med gällande avtal. Materialet får inte spridas till fysiska eller juridiska personer som är medborgare eller har hemvist i ett land där sådan spridning är otillåten enligt tillämplig lag eller annan bestämmelse.
Skandinaviska Enskilda Banken AB (publ) är ett publikt aktiebolag och står under tillsyn av Finansinspektionen samt de lokala finansiella tillsynsmyndigheter i varje jurisdiktionen där SEB har filial eller dotterbolag.


The latest weekly report from the US DOE showed a substantial drawdown across key petroleum categories, adding more upside potential to the fundamental picture.

Commercial crude inventories (excl. SPR) fell by 5.8 million barrels, bringing total inventories down to 415.1 million barrels. Now sitting 11% below the five-year seasonal norm and placed in the lowest 2015-2022 range (see picture below).
Product inventories also tightened further last week. Gasoline inventories declined by 2.1 million barrels, with reductions seen in both finished gasoline and blending components. Current gasoline levels are about 3% below the five-year average for this time of year.
Among products, the most notable move came in diesel, where inventories dropped by almost 4.1 million barrels, deepening the deficit to around 20% below seasonal norms – continuing to underscore the persistent supply tightness in diesel markets.
The only area of inventory growth was in propane/propylene, which posted a significant 5.1-million-barrel build and now stands 9% above the five-year average.
Total commercial petroleum inventories (crude plus refined products) declined by 4.2 million barrels on the week, reinforcing the overall tightening of US crude and products.


A classic case of “buy the rumor, sell the news” played out in oil markets, as Brent crude has dropped sharply – down nearly USD 10 per barrel since yesterday evening – following Iran’s retaliatory strike on a U.S. air base in Qatar. The immediate reaction was: “That was it?” The strike followed a carefully calibrated, non-escalatory playbook, avoiding direct threats to energy infrastructure or disruption of shipping through the Strait of Hormuz – thus calming worst-case fears.
After Monday morning’s sharp spike to USD 81.4 per barrel, triggered by the U.S. bombing of Iranian nuclear facilities, oil prices drifted sideways in anticipation of a potential Iranian response. That response came with advance warning and caused limited physical damage. Early this morning, both the U.S. President and Iranian state media announced a ceasefire, effectively placing a lid on the immediate conflict risk – at least for now.
As a result, Brent crude has now fallen by a total of USD 12 from Monday’s peak, currently trading around USD 69 per barrel.
Looking beyond geopolitics, the market will now shift its focus to the upcoming OPEC+ meeting in early July. Saudi Arabia’s decision to increase output earlier this year – despite falling prices – has drawn renewed attention considering recent developments. Some suggest this was a response to U.S. pressure to offset potential Iranian supply losses.
However, consensus is that the move was driven more by internal OPEC+ dynamics. After years of curbing production to support prices, Riyadh had grown frustrated with quota-busting by several members (notably Kazakhstan). With Saudi Arabia cutting up to 2 million barrels per day – roughly 2% of global supply – returns were diminishing, and the risk of losing market share was rising. The production increase is widely seen as an effort to reassert leadership and restore discipline within the group.
That said, the FT recently stated that, the Saudis remain wary of past missteps. In 2018, Riyadh ramped up output at Trump’s request ahead of Iran sanctions, only to see prices collapse when the U.S. granted broad waivers – triggering oversupply. Officials have reportedly made it clear they don’t intend to repeat that mistake.
The recent visit by President Trump to Saudi Arabia, which included agreements on AI, defense, and nuclear cooperation, suggests a broader strategic alignment. This has fueled speculation about a quiet “pump-for-politics” deal behind recent production moves.
Looking ahead, oil prices have now retraced the entire rally sparked by the June 13 Israel–Iran escalation. This retreat provides more political and policy space for both the U.S. and Saudi Arabia. Specifically, it makes it easier for Riyadh to scale back its three recent production hikes of 411,000 barrels each, potentially returning to more moderate increases of 137,000 barrels for August and September.
In short: with no major loss of Iranian supply to the market, OPEC+ – led by Saudi Arabia – no longer needs to compensate for a disruption that hasn’t materialized, especially not to please the U.S. at the cost of its own market strategy. As the Saudis themselves have signaled, they are unlikely to repeat previous mistakes.
Conclusion: With Brent now in the high USD 60s, buying oil looks fundamentally justified. The geopolitical premium has deflated, but tensions between Israel and Iran remain unresolved – and the risk of missteps and renewed escalation still lingers. In fact, even this morning, reports have emerged of renewed missile fire despite the declared “truce.” The path forward may be calmer – but it is far from stable.
Analys
A muted price reaction. Market looks relaxed, but it is still on edge waiting for what Iran will do
Brent crossed the 80-line this morning but quickly fell back assigning limited probability for Iran choosing to close the Strait of Hormuz. Brent traded in a range of USD 70.56 – 79.04/b last week as the market fluctuated between ”Iran wants a deal” and ”US is about to attack Iran”. At the end of the week though, Donald Trump managed to convince markets (and probably also Iran) that he would make a decision within two weeks. I.e. no imminent attack. Previously when when he has talked about ”making a decision within two weeks” he has often ended up doing nothing in the end. The oil market relaxed as a result and the week ended at USD 77.01/b which is just USD 6/b above the year to date average of USD 71/b.

Brent jumped to USD 81.4/b this morning, the highest since mid-January, but then quickly fell back to a current price of USD 78.2/b which is only up 1.5% versus the close on Friday. As such the market is pricing a fairly low probability that Iran will actually close the Strait of Hormuz. Probably because it will hurt Iranian oil exports as well as the global oil market.
It was however all smoke and mirrors. Deception. The US attacked Iran on Saturday. The attack involved 125 warplanes, submarines and surface warships and 14 bunker buster bombs were dropped on Iranian nuclear sites including Fordow, Natanz and Isfahan. In response the Iranian Parliament voted in support of closing the Strait of Hormuz where some 17 mb of crude and products is transported to the global market every day plus significant volumes of LNG. This is however merely an advise to the Supreme leader Ayatollah Ali Khamenei and the Supreme National Security Council which sits with the final and actual decision.
No supply of oil is lost yet. It is about the risk of Iran closing the Strait of Hormuz or not. So far not a single drop of oil supply has been lost to the global market. The price at the moment is all about the assessed risk of loss of supply. Will Iran choose to choke of the Strait of Hormuz or not? That is the big question. It would be painful for US consumers, for Donald Trump’s voter base, for the global economy but also for Iran and its population which relies on oil exports and income from selling oil out of that Strait as well. As such it is not a no-brainer choice for Iran to close the Strait for oil exports. And looking at the il price this morning it is clear that the oil market doesn’t assign a very high probability of it happening. It is however probably well within the capability of Iran to close the Strait off with rockets, mines, air-drones and possibly sea-drones. Just look at how Ukraine has been able to control and damage the Russian Black Sea fleet.
What to do about the highly enriched uranium which has gone missing? While the US and Israel can celebrate their destruction of Iranian nuclear facilities they are also scratching their heads over what to do with the lost Iranian nuclear material. Iran had 408 kg of highly enriched uranium (IAEA). Almost weapons grade. Enough for some 10 nuclear warheads. It seems to have been transported out of Fordow before the attack this weekend.
The market is still on edge. USD 80-something/b seems sensible while we wait. The oil market reaction to this weekend’s events is very muted so far. The market is still on edge awaiting what Iran will do. Because Iran will do something. But what and when? An oil price of 80-something seems like a sensible level until something do happen.


Tightening fundamentals – bullish inventories from DOE

Jonas Lindvall är tillbaka med ett nytt oljebolag, Perthro, som ska börsnoteras

Oljan, guldet och marknadens oroande tystnad

Domstolen ger klartecken till Lappland Guldprospektering
Bombs to ”ceasefire” in hours – Brent below $70

Stor uppsida i Lappland Guldprospekterings aktie enligt analys

Brookfield ska bygga ett AI-datacenter på hela 750 MW i Strängnäs

Sommaren inleds med sol och varierande elpriser

OPEC+ ökar oljeproduktionen trots fallande priser

Silverpriset släpar efter guldets utveckling, har mer uppsida
-
 Nyheter3 veckor sedan
Stor uppsida i Lappland Guldprospekterings aktie enligt analys
-
 Nyheter4 veckor sedan
Brookfield ska bygga ett AI-datacenter på hela 750 MW i Strängnäs
-
 Nyheter4 veckor sedan
Sommaren inleds med sol och varierande elpriser
-
 Nyheter4 veckor sedan
OPEC+ ökar oljeproduktionen trots fallande priser
-
 Nyheter3 veckor sedan
Silverpriset släpar efter guldets utveckling, har mer uppsida
-
Analys4 veckor sedan
Brent needs to fall to USD 58/b to make cheating unprofitable for Kazakhstan
-

 Nyheter4 veckor sedan
Tradingfirman XTX Markets bygger datacenter i finska Kajana för 1 miljard euro
-

 Nyheter2 veckor sedan
Uppgången i oljepriset planade ut under helgen