

Analys
SEB Råvarubrev 12 maj 2015

 Greklandsdebacle riskerar bli riktigt spektakel
MARKNADEN I KORTHET
Turbulensen på de finansiella marknaderna fortsatte under förra veckan. Råvaror spretade något, med en generell uppgång där jordbruksprodukter gick upp liksom ädelmetaller, medan energi och industrimetaller backade i generella termer. I Europa har aktiemarknaderna i stort gått bra och OMX-index gick under förra veckan upp cirka 1,3 procent. Generellt är analytikerna positiva till Kinas aktiemarknad, vilket till stor del har att göra med att Kinas regering är fast beslutna att stimulera ekonomin. I söndags sänkte också Kinas centralbank räntan. Detta sammantaget borde ge generellt stöd åt råvaror, även om samtliga effekter säkert inte är helt uppenbara.
I förra numret skrev vi en del om att räntor kraftigt hade gått upp, och de fortsatte upp även under förra veckan även om läget blev litet lugnare framåt slutet av veckan. Vad som däremot inte har blivit lugnare är Greklands situation. Som SEB:s chefsekonom Robert Bergqvist konstaterar i sin fina analys som du kan läsa här, börjar det verkligen brännas för landet. Även om landet möter sina åtaganden gentemot IMF idag tisdag – vilket är troligt, då man betalade en av en skuld i tid förra veckan – så återstår många hinder. Det största är sannolikt halvårsskiftet, då Greklands bail out-program slutar. Från och med den första juli är den gällande planen att landet självständigt skall kunna möta sina åtaganden och bedriva en sund ekonomi. Rent krasst ser det ur flera perspektiv inte ut att vara rimligt.
Vad innebär detta för råvaror? Ur ett vidare perspektiv kommer varje deadline att möta och tröskel att ta sig över för Grekland att innebära press på euron. Volatiliteten kommer sannolikt att öka och valutan kommer att direkt påverkas av rubriker i medier. Det är heller inte otroligt att omvärlden kommer att börja prisa in en så kallad Grexit i eurokursen, vilket innebär att US-dollarn och sannolikt även kronan kommer att stärkas mot euron. Frågan är om investerare kommer att öka sin exponering i råvaror, och då sannolikt främst guld, trots att US-dollarn framöver kan stärkas baserat på olika fundamentala faktorer? Faktiskt tror vi att både US-dollarn och guldet kan komma att stärkas framöver. Detta gynnar helt klart en lång position i guld. I dessa tider då investerare faktiskt letar placeringar utan avkastning – då denna i många fall är negativ! – har guldet ånyo börjat hamna i fokus. Detta kommer vi skriva litet mer om framöver. Glöm heller inte bort att vi erbjuder certifikat på valutor – se kurslistan till höger!
TRENDER I SAMMANDRAG
- Råvaror generellt ned under förra veckan som resultat av turbulenta finansmarknader
- Grekland fortsätter att skapa osäkerhet i marknaderna. Euron påverkas och volatiliteten i valutan ökar
- Amerikanska oljelager föll för förra veckan för första gången på 25 veckor. Ger stöd för WTI-priset
- Tecken på att intresset av borrningar efter skifferolja ökar. Verkade avkylande på prisuppgången
- Global efterfrågan på olja ökar starkt och sannolikt god idé att efter avslutad korrektion åter ta lång position
- Prisuppgången på basmetaller i stort driven av investerare. Fundamentala faktorer måste snart stärkas – annars risk för rekyler
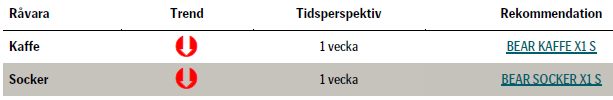
VECKANS REKOMMENDATIONER
En placering i certifikat och warranter är förknippat med risker. Du kan förlora hela ditt investerade kapital. Läs mer om riskerna i SEB:s offentliggjorda Grundprospekt för certifikat- och warrantprogram på seb.se/cert eller seb.se/mini.
OLJA
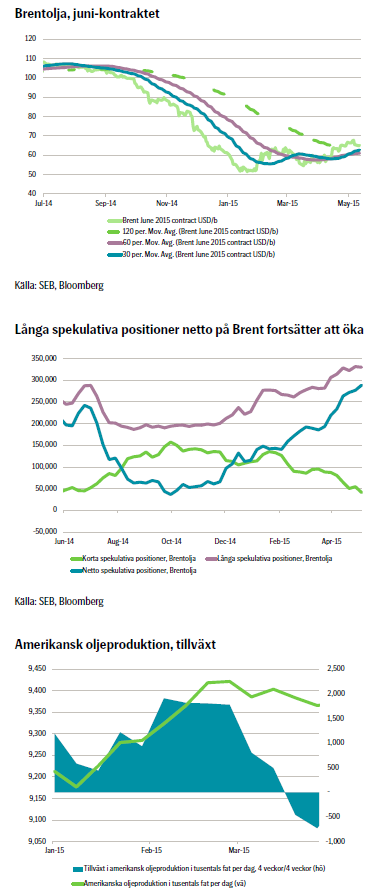 Förra veckan föll Brentoljepriset med 1,6 procent och stängde på 65,39 US-dollar per fat. Nedgången i priset började på torsdagen och sammanföll med att US-dollarn stärktes. US-dollarindex studsade ned mot sitt 120-dagars glidande medelvärde och fortsatte därefter uppåt. Priset har rört sig ned mot detta glidande medelvärde sedan det började sin svagare rörelse i mitten av april. Styrkan kanske åter börjar hitta till amerikansk ekonomi efter förra veckans starka payrolls-data (förändringen på arbetsmarknaden). En viktig faktor förra veckan var att amerikanska borrningar efter skifferolja visade tecken på ökad aktivitet då priset på WTI:n ökade 0,4 procent till 59,3 US-dollar per fat. Dock gav dessa signaler om ökad aktivitet genast en avkylande effekt på marknaden.
Förändringar under förra veckan i antalet amerikanska oljeriggar i drift visade tydligt att vi närmar oss slutet på perioden av korrektion då antalet i drift fortsatte falla med ytterligare 11 stycken under perioden. Minskningen var dock den minsta sedan december förra året och vi är nu nära botten på denna cykel. Det har visat sig att ett genomsnitt om 48 US-dollar för WTI:n under första kvartalet ledde till att marknaden gick från en massiv expansion av produktionen under 2014, till en marginell minskning i april. Å andra sidan kom under förra veckan signaler från amerikanska skifferoljeproducenter att de kommer att expandera sin verksamhet då WTI-priset är runt 60-65 US-dollar per fat.
Antalet spekulativa positioner i Brentolja har senaste tiden varit mycket stort. Detta var den huvudsakliga anledningen till att vi förra veckan rekommenderade att gå lång från en neutral position. Brentoljan har nu påbörjat en korrektion som tekniskt sannolikt kommer att trycka den ned till 62 US-dollar per fat; speciellt då en starkare US-dollar kyler oljemarknaden.
Amerikanska olje- och oljeproduktlager föll under förra veckan för första gången på 25 veckor. Detta innebar ett tydligt avbrott i den annars stadiga uppgången och ger klart stöd för WTI-priset. Ökat kapacitetsutnyttjande av amerikanska raffinaderier, fallande amerikansk råoljeproduktion, ökande säsongsbetonad efterfrågan på bensin och ökande export av enkelt raffinerade produkter (har att göra med viskositeten på oljan – USA har förbud på att exportera råolja) hjälper alla till att strama upp och förbättra balansen i den amerikanska oljemarknaden – de pekar alla åt samma håll.
TREND
- Det stora antalet långa positioner i Brentoljan utgör en grund för ytterligare korrektion nedåt i oljepriset på kort sikt
- Brentoljan kommer sannolikt tekniskt handla nedåt 62 US-dollar per fat
- Global efterfrågan på olja ökar starkt och det bör därför vara en god idé att inom inte alltför lång tid återigen ta lång position.
REKOMMENDATION
- Ligg neutral så länge som priset är i korrektion mot lägre nivåer. Ta återigen lång position vid 62 US-dollar per fat.
Bjarne Schieldrop
Chefsanalytiker råvaror
SEB
KAFFE
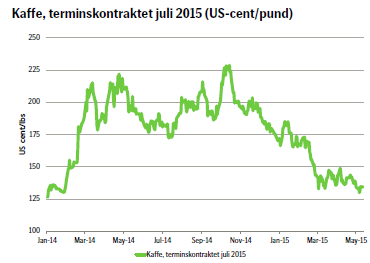
Sedan förra veckan har den brasilianska realen fortsatt sin resa mot lägre nivåer mot US-dollarn och kaffepriset har följt efter. Den fundamentala förklaringen är att då realen försvagas så säljer man mer kaffe från Brasilien, vilket sänker priset på kaffe på den globala marknaden.
 Lager som monitoreras av ICE (en av världens största börser för råvaror) fortsätter att falla, men i en takt som varit i princip konstant sedan 2013 och är således ingen överraskning. Som konstaterat närmar vi oss också skördesäsongen i Brasilien, vilket oundvikligen innebär att mer kaffe kommer att komma till marknaden, samtidigt som realen tros fortsätta sin försvagning, även om riktningen i det korta perspektivet är oklar.
Korrelationen mellan en svagare real, ökande kaffelager och ett lägre kaffepris är föga förvånande stark, vilket gör det lätt att enbart baserat på ovanstående dra slutsatsen att kaffepriset sannolikt bör fortsätta sin resa nedåt. Ser man till forward-kurvan så har den kontinuerligt skiftat inåt över det senaste året och i accelererande takt. Läs mer om förhållandet med realen i stycket om socker intill!
Det tekniska perspektivet säger att fredagens rörelse var ett återtest av nivån 136,70 US-cent per pund. Om priset ligger stilla några dagar så är det snarast ett bevis på att marknaden åter kommer testa att börja sälja. Den längre trenden är glasklar nedåt och marknaden är tydligt känsligare på nedsidan, då volymerna under dagar av säljtryck är mycket större än dagar med köptryck. Sannolikt kommer vi se en konsolidering under några dagar och sedan en fortsatt resa nedåt.
TREND
- Vi närmar oss skörden av kaffebönor. Rent kratt innebär det ökat utbud – oavsett vad priset kommer vara
- Tekniskt pekar trenden i priset fortfarande klart nedåt
- Sammantaget både fundamentalt och tekniskt stöd för vidare resa nedåt.
REKOMMENDATION
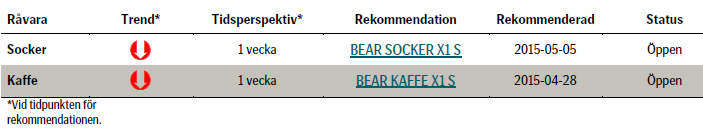
- BEAR KAFFE X1 S – med reservation för intradag-svängningar ligger vi kvar i vår rekommendation
SOCKER
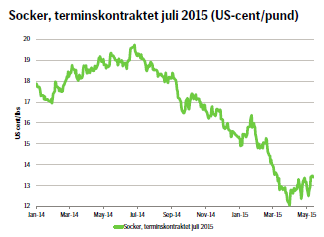 Liksom kaffet har sockret tydligt följt den brasilianska realens kursutveckling den senaste veckan, vilket har inneburit att sockerpriset i enlighet med vår prediktion förra veckan har trendat nedåt, om än med tämligen hög volatilitet.
I fredags kom rapporter om att den brasilianska skörden kommer att bli något litet större än förra säsongen, men samtidigt rapporterades att kraftiga regn i viktiga odlingsområden kommer att försena skörden. Sockerpriset reagerade genom att gå upp något. Den största oron är sannolikt att sockerplantorna skall dra åt sig så pass mycket vatten att det bättre lönar sig att göra etanol av dem, vilket förstås skulle ge bättre stöd åt sockerpriset. Brasilien producerar drygt 20% av världens socker, men samtidigt knappt 40% av världens sockerrör, vilket ger perspektiv på att Brasilien 2014 producerade ¼ av världens all etanol.
Förra veckan släpptes mötesnoteringarna från Brasiliens centralbanks möte i april. I detta står att läsa att medlemmarna i direktionen anser att vad man gjort hittills inte är tillräckligt för att stävja den höga inflationen. Analogt med detta tror också marknaden generellt – baserat på hur swapräntorna prisas – att räntan kommer att höjas en halv procentenhet i juni.
Detta borde innebära att valutan stärks, men när räntan höjdes i april försvagades istället realen. Logiken är oklar och vi skriver litet mer om tänkbara förklaringar i vårt 5/5-nummer av Råvarubrevet. En sak kan man nog hur som helst sluta sig till: Volatiliteten i realen kommer att öka och säkerligen spilla över till både socker- och kaffepriset.
Tekniskt ser vi ett fortsatt nedåttryck i sockerpriset; om än kanske inte riktigt lika starkt som tidigare. Nivån 13,51 US-cent per pund är en nivå att hålla ögonen på, då det är en punkt över den tidigare toppen i vad vi anser är ett tillfälligt brott i den nedåtgående trenden. Bryter priset igenom nivån 12,35 US-cent per pund ser vi en bekräftelse på att priset kommer att falla nedåt.
TREND
- Osäkerhet inför nederbörd i nyckelområden
- Tekniskt stöd för vidare resa nedåt i priset
- Vi tror att sockerpriset kommer fortsätta nedåt, om än med hög volatilitet
REKOMMENDATION
- BEAR SOCKER X1 S – med reservation för hög volatilitet
EL
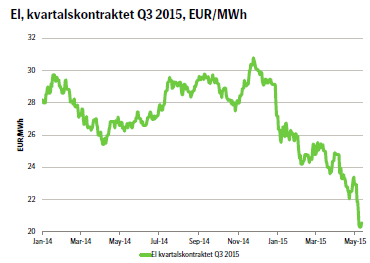 Elpriset fortsätter sin resa söderut i takt med att temperaturen på termometern ökar. Under lång tid har vi konstaterat att det finns ett nedåttryck i elpriset, men frågan har varit hur länge det kan bestå. Frågan kvarstår alltjämt.
Förra veckan konstaterade vi att priset bröt igenom den viktiga nivån 22 euro per MWh, men priset har fortsatt att accelerera nedåt och har nu på tisdagen nått den ännu lägre nivån om 20,05 euro per MWh och marknaden verkar hela tiden testa lägre, som det heter. Onekligen är det en viktig nivå; om inte annat psykologiskt.
Ser man på de faktorer som i stort driver priset så är det inga omvälvande förändringar. Den hydrologiska balansen är inom normala nivåer med ett beskedligt överskott. Man förväntar sig en vårflod inom snar framtid, men ingenting ovanligt stort. Kolpriset har varit tämligen konstant den senaste veckan och normalt sett påverkar det främst kontrakt som ligger längre fram i tiden (”längre ut på kurvan”). Utsläppsrätter har under veckan blivit något litet billigare.
Den senaste tidens generella prisfall beror på den nya ordningen där gröna alternativ för energiproduktion helt enkelt på marginalen konkurrerar ut vad som får anses vara klassiska produktionskomponenter av el. Vad som just nu trycker ned priset är ändå fundamentala faktorer, såsom en annalkande vårflod och en därigenom ökande hydrologisk balans.
Sammantaget konstaterar vi rent krasst att priset fortsätter nedåt, men är försiktiga med att ge en rekommendation då det är oklart hur mycket nedsida som egentligen finns kvar. Å andra sidan har detta repeterats under en tid nu. Den aktive investeraren kan fortfarande hitta möjligheter i marknadens svängningar!
TREND
- Priset på Nordisk el fortsätter vara pressat på nedsidan
- Inget överraskande i fundamentala faktorer
- Gröna alternativ som äter på marginalen för traditionell tillverkning av energi
- Med risk för att låta tråkiga repeterar vi vårt budskap från förra veckan: En aktiv investerare kan fortfarande köpa bear-certifikat på lokala toppar och bull-certifikat i lokala dalar.
BASMETALLER
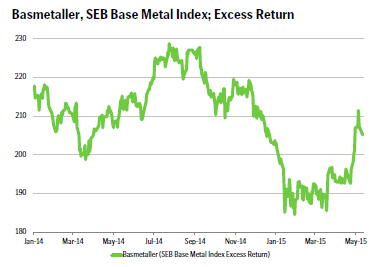 Senaste tidens utveckling för basmetaller får oss att fråga om vi kanske har kommit till ett vägskäl: Uppgången är mellan 17-20 procent sedan lägstanoteringen under första kvartalet. Aluminium är undantaget, som ”bara” har gått upp med 8 procent.
Under andra kvartalet trodde vi på starkare priser av säsongsmässiga skäl, men trots alls gör rapporter från industrin gällande att efterfrågan inte riktigt infinner sig och det är huvudsakligen investerare som driver marknaden uppåt just nu. Fundamentala faktorer måste snart också bli positiva – annars finns ur det perspektivet ingen uppsida kvar och vi ser risk för tillbakafall i priserna. De senaste siffrorna från Kina indikerar dock en stabilisering av balanserna. I söndags sänkte också kinesiska centralbanken räntan med 0,25 procentenheter. Syftet är att motverka stigande realräntor då inflationen är lägre och man önskar snarast bromsa fallet i tillväxten än att försöka elda på ekonomin. Hur som helst bordet det i det bredare perspektivet ge stöd åt basmetallerna.
Vidare stiger Kinas kopparimport, vilket den också brukar göra vid denna tid på året. Kopparlagren på SHFE sjunker, vilket är en liten ljusning. LME-lagret av nickel ser ut att nå sin topp, vilket kan vara ett tecken på stabilisering. Dock är det sämre utsikter för den rostfria stålindustrin under det andra, kommande halvåret.
Sammantaget är det viktigt att studera fundamentala faktorer framöver, vilket innebär att hålla koll på makro, men även börslager samt fysiska premier.
TREND
- Kraftiga prisuppgångar på basmetaller kräver att fundamentala faktorer snart också stärks
- Priserna på marknaden drivs i stort av investerare, snarare än industrin
- Vi förhåller oss neutrala tills marknaden ger oss mer information och letar efter signaler om starkare fundamenta
AKTUELLA REKOMMENDATIONER
[box]SEB Veckobrev Veckans råvarukommentar är producerat av SEB:s Commodities Sales desk och publiceras i samarbete och med tillstånd på Råvarumarknaden.se[/box]
KÄLLOR
Bloomberg, Reuters, SEB
VILLKOR
För varje enskilt certifikat/mini future finns Slutliga Villkor som anger de fullständiga villkoren. Slutliga Villkor finns tillgängligt på kurssidan för respektive certifikat/mini future på www.seb.se, Börs & finans, fliken Strukturerade placeringar.
RISKER
En sammanfattning av de risker som är förknippade med Börshandlade certifikat generellt finns i Produktbroschyren för respektive certifikat eller mini future som är tillgängligt på seb.se/cert respektive seb.se/mini. För en fullständig bild av riskerna behöver du ta del av SEB:s offentliggjorda Grundprospekt för Certifikat- och Warrantprogram som är publicerat på www.seb.se/cert respektive seb.se/mini.
DISCLAIMER
Detta marknadsföringsmaterial, framtaget av SEB:s Commodities Sales desk, har upprättats enbart i informationssyfte.
Även om innehållet är baserat på källor som SEB bedömt som tillförlitliga ansvarar SEB inte för fel eller brister i informationen. Den utgör inte oberoende, objektiv investeringsanalys och skyddas därför inte av de bestämmelser som SEB har infört för att förebygga potentiella intressekonflikter. Yttranden från SEB:s Commodities Sales desk kan vara oförenliga med tidigare publicerat material från SEB, då den senare hänvisas uppmanas du att läsa den fullständiga rapporten innan någon åtgärd vidtas.
Dokumentationen utgör inte någon investeringsrådgivning och tillhandahålls till dig utan hänsyn till dina investeringsmål. Du uppmanas att självständigt bedöma och komplettera uppgifterna i denna dokumentation och att basera dina investeringsbeslut på material som bedöms erforderligt. Alla framåtblickande uttalanden, åsikter och förväntningar är föremål för risker, osäkerheter och andra faktorer och kan orsaka att det faktiska resultatet avviker väsentligt från det förväntade. Historisk avkastning är ingen garanti för framtida resultat. Detta dokument utgör inte ett erbjudande att teckna några värdepapper eller andra finansiella instrument. SEB svarar inte för förlust eller skada – direkt eller indirekt, eller av vad slag det vara må – som kan uppkomma till följd av användandet av detta material eller dess innehåll.
Observera att det kan förekomma att SEB, dess ledamöter, dess anställda eller dess moder- och/eller dotterbolag vid olika tillfällen innehar, har innehaft eller kommer att inneha aktier, positioner, rådgivningsuppdrag i samband med corporate finance-transaktioner, investment- eller merchantbanking-uppdrag och/eller lån i de bolag/finansiella instrument som nämns i materialet.
Materialet är avsett för mottagaren, all spridning, distribuering mångfaldigande eller annan användning av detta meddelande får inte ske utan SEB:s medgivande. Materialet riktar sig inte till personer vars medverkan kräver ytterligare prospekt, registrerings- eller andra åtgärder än vad som följer av svensk rätt. Det åligger var och en att iaktta sådana restriktioner. Materialet får inte distribueras i eller till land där distribution kräver ovan nämnda åtgärder eller strider mot reglering i sådant land. Materialet riktar sig således inte till fysiska eller juridiska personer hemmahörande i USA eller i något annat land där publicering eller tillhandahållande av materialet är förbjudet eller strider mot tillämpliga bestämmelser i landet.
Oaktat detta får SEB tillåta omfördelning av materialet till utvald tredje part i enlighet med gällande avtal. Materialet får inte spridas till fysiska eller juridiska personer som är medborgare eller har hemvist i ett land där sådan spridning är otillåten enligt tillämplig lag eller annan bestämmelse.
Skandinaviska Enskilda Banken AB (publ) är ett publikt aktiebolag och står under tillsyn av Finansinspektionen samt de lokala finansiella tillsynsmyndigheter i varje jurisdiktionen där SEB har filial eller dotterbolag.


The latest weekly report from the US DOE showed a substantial drawdown across key petroleum categories, adding more upside potential to the fundamental picture.

Commercial crude inventories (excl. SPR) fell by 5.8 million barrels, bringing total inventories down to 415.1 million barrels. Now sitting 11% below the five-year seasonal norm and placed in the lowest 2015-2022 range (see picture below).
Product inventories also tightened further last week. Gasoline inventories declined by 2.1 million barrels, with reductions seen in both finished gasoline and blending components. Current gasoline levels are about 3% below the five-year average for this time of year.
Among products, the most notable move came in diesel, where inventories dropped by almost 4.1 million barrels, deepening the deficit to around 20% below seasonal norms – continuing to underscore the persistent supply tightness in diesel markets.
The only area of inventory growth was in propane/propylene, which posted a significant 5.1-million-barrel build and now stands 9% above the five-year average.
Total commercial petroleum inventories (crude plus refined products) declined by 4.2 million barrels on the week, reinforcing the overall tightening of US crude and products.


A classic case of “buy the rumor, sell the news” played out in oil markets, as Brent crude has dropped sharply – down nearly USD 10 per barrel since yesterday evening – following Iran’s retaliatory strike on a U.S. air base in Qatar. The immediate reaction was: “That was it?” The strike followed a carefully calibrated, non-escalatory playbook, avoiding direct threats to energy infrastructure or disruption of shipping through the Strait of Hormuz – thus calming worst-case fears.
After Monday morning’s sharp spike to USD 81.4 per barrel, triggered by the U.S. bombing of Iranian nuclear facilities, oil prices drifted sideways in anticipation of a potential Iranian response. That response came with advance warning and caused limited physical damage. Early this morning, both the U.S. President and Iranian state media announced a ceasefire, effectively placing a lid on the immediate conflict risk – at least for now.
As a result, Brent crude has now fallen by a total of USD 12 from Monday’s peak, currently trading around USD 69 per barrel.
Looking beyond geopolitics, the market will now shift its focus to the upcoming OPEC+ meeting in early July. Saudi Arabia’s decision to increase output earlier this year – despite falling prices – has drawn renewed attention considering recent developments. Some suggest this was a response to U.S. pressure to offset potential Iranian supply losses.
However, consensus is that the move was driven more by internal OPEC+ dynamics. After years of curbing production to support prices, Riyadh had grown frustrated with quota-busting by several members (notably Kazakhstan). With Saudi Arabia cutting up to 2 million barrels per day – roughly 2% of global supply – returns were diminishing, and the risk of losing market share was rising. The production increase is widely seen as an effort to reassert leadership and restore discipline within the group.
That said, the FT recently stated that, the Saudis remain wary of past missteps. In 2018, Riyadh ramped up output at Trump’s request ahead of Iran sanctions, only to see prices collapse when the U.S. granted broad waivers – triggering oversupply. Officials have reportedly made it clear they don’t intend to repeat that mistake.
The recent visit by President Trump to Saudi Arabia, which included agreements on AI, defense, and nuclear cooperation, suggests a broader strategic alignment. This has fueled speculation about a quiet “pump-for-politics” deal behind recent production moves.
Looking ahead, oil prices have now retraced the entire rally sparked by the June 13 Israel–Iran escalation. This retreat provides more political and policy space for both the U.S. and Saudi Arabia. Specifically, it makes it easier for Riyadh to scale back its three recent production hikes of 411,000 barrels each, potentially returning to more moderate increases of 137,000 barrels for August and September.
In short: with no major loss of Iranian supply to the market, OPEC+ – led by Saudi Arabia – no longer needs to compensate for a disruption that hasn’t materialized, especially not to please the U.S. at the cost of its own market strategy. As the Saudis themselves have signaled, they are unlikely to repeat previous mistakes.
Conclusion: With Brent now in the high USD 60s, buying oil looks fundamentally justified. The geopolitical premium has deflated, but tensions between Israel and Iran remain unresolved – and the risk of missteps and renewed escalation still lingers. In fact, even this morning, reports have emerged of renewed missile fire despite the declared “truce.” The path forward may be calmer – but it is far from stable.
Analys
A muted price reaction. Market looks relaxed, but it is still on edge waiting for what Iran will do
Brent crossed the 80-line this morning but quickly fell back assigning limited probability for Iran choosing to close the Strait of Hormuz. Brent traded in a range of USD 70.56 – 79.04/b last week as the market fluctuated between ”Iran wants a deal” and ”US is about to attack Iran”. At the end of the week though, Donald Trump managed to convince markets (and probably also Iran) that he would make a decision within two weeks. I.e. no imminent attack. Previously when when he has talked about ”making a decision within two weeks” he has often ended up doing nothing in the end. The oil market relaxed as a result and the week ended at USD 77.01/b which is just USD 6/b above the year to date average of USD 71/b.

Brent jumped to USD 81.4/b this morning, the highest since mid-January, but then quickly fell back to a current price of USD 78.2/b which is only up 1.5% versus the close on Friday. As such the market is pricing a fairly low probability that Iran will actually close the Strait of Hormuz. Probably because it will hurt Iranian oil exports as well as the global oil market.
It was however all smoke and mirrors. Deception. The US attacked Iran on Saturday. The attack involved 125 warplanes, submarines and surface warships and 14 bunker buster bombs were dropped on Iranian nuclear sites including Fordow, Natanz and Isfahan. In response the Iranian Parliament voted in support of closing the Strait of Hormuz where some 17 mb of crude and products is transported to the global market every day plus significant volumes of LNG. This is however merely an advise to the Supreme leader Ayatollah Ali Khamenei and the Supreme National Security Council which sits with the final and actual decision.
No supply of oil is lost yet. It is about the risk of Iran closing the Strait of Hormuz or not. So far not a single drop of oil supply has been lost to the global market. The price at the moment is all about the assessed risk of loss of supply. Will Iran choose to choke of the Strait of Hormuz or not? That is the big question. It would be painful for US consumers, for Donald Trump’s voter base, for the global economy but also for Iran and its population which relies on oil exports and income from selling oil out of that Strait as well. As such it is not a no-brainer choice for Iran to close the Strait for oil exports. And looking at the il price this morning it is clear that the oil market doesn’t assign a very high probability of it happening. It is however probably well within the capability of Iran to close the Strait off with rockets, mines, air-drones and possibly sea-drones. Just look at how Ukraine has been able to control and damage the Russian Black Sea fleet.
What to do about the highly enriched uranium which has gone missing? While the US and Israel can celebrate their destruction of Iranian nuclear facilities they are also scratching their heads over what to do with the lost Iranian nuclear material. Iran had 408 kg of highly enriched uranium (IAEA). Almost weapons grade. Enough for some 10 nuclear warheads. It seems to have been transported out of Fordow before the attack this weekend.
The market is still on edge. USD 80-something/b seems sensible while we wait. The oil market reaction to this weekend’s events is very muted so far. The market is still on edge awaiting what Iran will do. Because Iran will do something. But what and when? An oil price of 80-something seems like a sensible level until something do happen.


Tightening fundamentals – bullish inventories from DOE

Jonas Lindvall är tillbaka med ett nytt oljebolag, Perthro, som ska börsnoteras

Oljan, guldet och marknadens oroande tystnad

Domstolen ger klartecken till Lappland Guldprospektering
Bombs to ”ceasefire” in hours – Brent below $70

Stor uppsida i Lappland Guldprospekterings aktie enligt analys

Brookfield ska bygga ett AI-datacenter på hela 750 MW i Strängnäs

Sommaren inleds med sol och varierande elpriser

OPEC+ ökar oljeproduktionen trots fallande priser

Silverpriset släpar efter guldets utveckling, har mer uppsida
-
 Nyheter3 veckor sedan
Stor uppsida i Lappland Guldprospekterings aktie enligt analys
-
 Nyheter4 veckor sedan
Brookfield ska bygga ett AI-datacenter på hela 750 MW i Strängnäs
-
 Nyheter4 veckor sedan
Sommaren inleds med sol och varierande elpriser
-
 Nyheter4 veckor sedan
OPEC+ ökar oljeproduktionen trots fallande priser
-
 Nyheter3 veckor sedan
Silverpriset släpar efter guldets utveckling, har mer uppsida
-
Analys4 veckor sedan
Brent needs to fall to USD 58/b to make cheating unprofitable for Kazakhstan
-

 Nyheter4 veckor sedan
Tradingfirman XTX Markets bygger datacenter i finska Kajana för 1 miljard euro
-

 Nyheter2 veckor sedan
Uppgången i oljepriset planade ut under helgen