Analys
SEB Jordbruksprodukter – Vecka 46
 Marknaderna för jordbruksprodukter har hållit sig väldigt lugna den senaste veckan. Det är endast priset på potatis som rört sig, minus 9%. Däremot sker det saker i bakgrunden, framförallt på etanolmarknaden, men även på exportmarknaden för vete och inte minst, i ekonomin i stort.
Att byta namn på premiärministrarna i Grekland och Italien skulle lösa några problem gick marknaden på i några minuter. Angela Merkels tyska CDU träffades i förrgår och det kom starka uttalanden därifrån om att hålla fast vid EU-projektet som det viktigaste för den här generationen.
Det är helt uppenbart att läxan från 1992 års uppgörelse med fasta växelkurser inte har fastnat. Läxan var att en för hög växelkurs som försvaras med allt högre räntor, leder till att räntorna slår ihjäl ekonomin i landet, vilket gör landet ännu mindre värt – dvs växelkursen borde vara ÄNNU lägre, och trycket på växelkursen blir ännu hårdare. Det är en spiral som endast kan ha flera lösningar, varav bankrutt är en av dem.
 För några dagar sedan var räntan på italienska obligationer under 6%. Det var OK. Sedan gick räntan över och ligger nu på 7%. Förändringen av läge är som natt och dag. Länder som har så höga skulder byter spår i växeln från destination ”helt ok”, till destination ”bankrutt”.
EU-politikernas lätthet att snacka om skuldavskrivning för Grekland, har gjort att allt fler inser att ”skuldavskrivning” är slutdestinationen för länder med för höga skulder, att klara sig. Skuldavskrivning gör att banker i Frankrike, Tyskland, med flera länder, får det svårt. Krisen flyttas norrut, eftersom bankernas skulder blir Frankrikes och Tysklands statsskulder. Därför steg räntorna på franska statsobligationer och belgiska, t ex, i tisdags.
Varför är det här av intresse i ett brev om jordbruksprodukter? Jo, därför att lagren av spannmål i Frankrike, som dessutom inte sjunker som de ska, blir allt dyrare att finansiera. Det contango som finns på Matif måste bort. Lagren måste likvideras.
Detta om inte ECB tillåts genomföra en europeiska version av det amerikanska QE2 – dvs att trycka pengar och pumpa in dem i ekonomin. I vilket, fall borde euron falla mot dollarn. Men väljer man inflationsvägen för att bli av med de ohanterligt stora statsskulderna får man en boom i råvarupriser och markpriser. Till den punkten är det nog ändå en tid kvar. Till dess blir det nog en orolig färd.
Vete
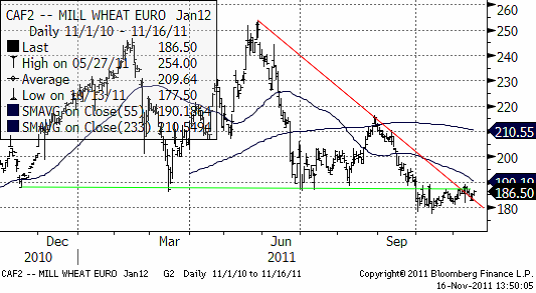
Terminspriset på Matif-vete håller sig alltjämt över den psykologiskt viktiga 180-euro-nivån, men orosmolnen hopar sig. Ryssland och Ukrainas återinträde på världsmarknaden spelar en stor roll nu. Dessa exportländers volymer påverkar i synnerhet europeiska länders exportmarknad, som är Mellanöstern och Nordafrika. Särskilt märks detta för Frankrike, som är ett av världens största exportländer när det gäller vete. Frankrike har hittills på säsongen förlorat mer än ett dussin av Egyptens tenders; Egypten är världens viktigaste importland med ca 9 mt som årlig importvolym. Vete från Ryssland, Ukraina och Kazakstan väller ut över marknaden. Egypten har de senaste 17 gångerna valt vete från Svartahavsregionen. Exporten från Rouen, som är Europas största export-hub, noterade den 2 november fyra månaders lägsta nivå. Franska myndigheter räknar med 23% lägre export i perioden juli 2011 – juni 2012, jämfört med förra året. Det blir då den lägsta nivån på 10 år. Egypten har endast stått för 4% av Frankrikes export utanför EU sedan juli, mot 18% förra året.
Algeriet är ett land som gärna har köpt franskt vete. Algeriet vann självständighet från Frankrike år 1962. Brödet man äter är baguetter och det franska vetet passar utmärkt för detta. Enligt FAO äter den genomsnittlige algeriern 212 kg vete om året, en klar andraplats i världsligan efter grannlandet Tunisien. Förra året gick 24% av Frankrikes export till Algeriet, som är världens näst största importland efter Egypten. Algeriet har hårda krav på insektsskador och svartahavsregionen drabbas ofta av sköldskinnbaggar (eurygaster integricepts), som suger ur sädeskornen. Därför kan Frankrike känna sig ganska säker än så länge där.
Rysslands skörd blir enligt USDA:s WASDE den tredje största på 10 år och erbjuder vete ca 10 dollar per ton under franska priser. Rysslands export påverkar främst, men inte bara Europa. Enligt USDA kommer USA:s export att minska med 24% till 26.5 mt den här säsongen. -24% är det största fallet på ett kvartssekel.
Nedan ser vi januarikontraktet på Matif. Den tekniska, dvs psykologiskt viktiga stödnivån på 180 euro utgår allt jämt ett starkt stöd. Vi bedömer ändå, med tanke på den minskning av konsumtion som lär komma i spåren av alla sparprogram i EU, och överväldigande bevis på att priset är för högt för att vinna exportordrar, att 180 euro lär brytas.
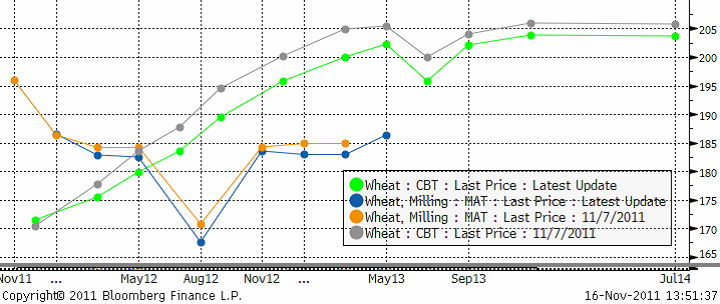
Nedan ser vi terminskurvan för Chicagovete och Matif nu och för en vecka sedan.
Allt talar för att Matif-vete faller ner i första hand till 150 – 160 – euro-nivån.
Maltkorn
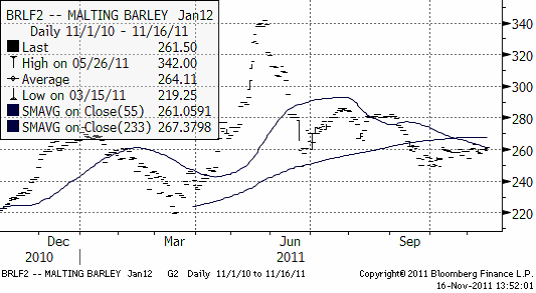
Maltkornsmarknaden följer vetet och det finns inga speciella nyheter att rapportera. Tekniskt ligger priset under glidande medelvärden. Den tekniska trenden är alltså nedåtriktad.
Potatis
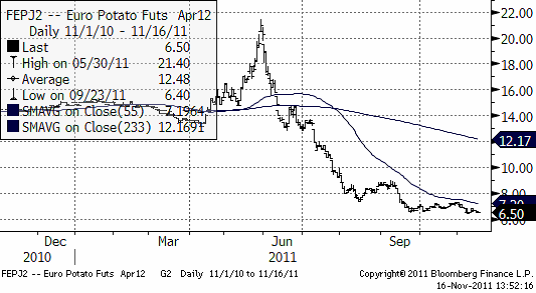
Priset på potatis av årets skörd har fallit med 9% den senaste veckan. Det är den enda råvara som rört sig mer än någon procentenhet.
Nedan ser vi kursdiagrammet på europeisk potatis, som handlas på Eurex; terminen avser leverans april nästa år.
Majs
Liksom på vetemarknaden, vinner Ryssland och Ukraina exportordrar. Igår köpte Japan 800,000 ton majs från Ukraina istället för att köpa den dyrare amerikanska produkten. Japan är världens största importör av majs, som används i djurhållningen.
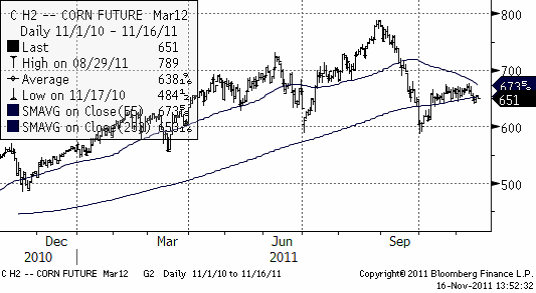
Nedan ser vi marskontraktet på CBOT, där priset backat under 233-dagars glidande medelvärde, något av en negativ teknsisk signal.
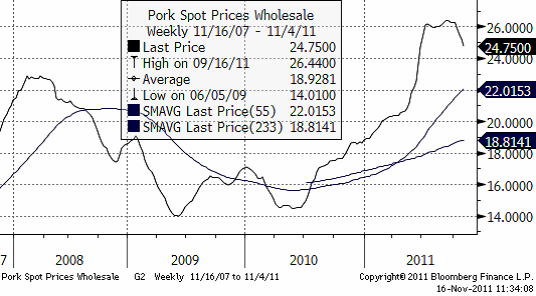
Det händer intressanta saker i bakgrunden till majsmarknaden. För det första handlar det om amerikansk etanolproduktion och för det andra om kinesisk fläskkonsumtion. Vi ser priserna i yuan per kilo (senast 24.75 yuan) i diagrammet nedan – notera det stora prisfallet som just pågår (två glidande medelvärden är också inritade):
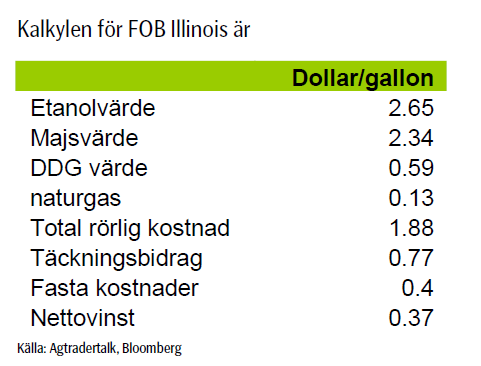
När det gäller etanol är det boom i USA. Firman Agtradertalk som sammanställer statistik visar följande nettovinst per gallon på att producera etanol, baserat på spotpriser FOB Illinois.
Nu är det så att det finns en skatterabatt på 45 cent per gallon i USA, som ges till den som blandar etanol i bensin. Den heter Volumetric Ethanol Excise Tax Credit och introducerades av George W Bush år 2004 och trädde i kraft 2005. Skatten syftade till att minska importberoendet av råolja, men kostar i dagsläget 5.7 miljarder dollar för skattebetalarna.
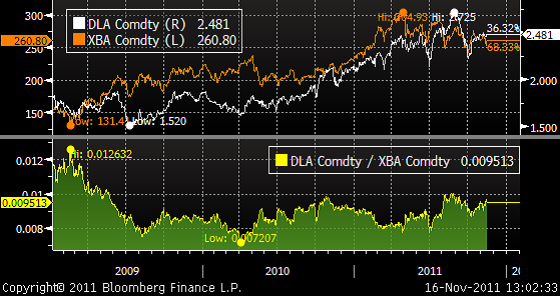
Etanol borde kosta 70% av bensin, eftersom etanol har ett energivärde som ligger på 70% av bensinens, men i diagrammet nedan ser vi att etanol nu kostar 95% av bensinen. DLA är kortnamnet för etanolterminer i dollar per gallon och bensin som handlas i cent per gallon, heter XBA.
Särskilt märkligt blir det höga priset när USA:s 209 destillerier producerar mer än vad som förbrukas i USA. USA exporterar etanol till Kanada, Europa och till och med till Brasilien! Brasiliens skörd av sockerrör blir i år 459.6 mt mot 501.2 förra året och den brasilianska regeringen har minskat inblandningen av etanol från 25 till 20%. Industrin producerar också mer socker och mindre etanol.
EU:s krav på etanolinblandning har också lett till brist. En gallon etanol kostar 3.21 dollar i Rotterdams hamn och 2.94 dollar i New Yorks hamn.
Situationen är intressant eftersom skatterabatten på 45 cent går ut vid årsskiftet. Det gjorde den även förra året, men då fick branschen en förlängning. En republikansk senator försökte i juni ta bort subventionen men förlaget gick nätt och jämt inte igenom. Samtidigt noterar jordbruksmark i USA rekordpriser, vilket väl är de enda fastighetspriserna i USA som inte kraschar. Markpriserna tog ett skutt uppåt 2004-2005 (gissa varför…).
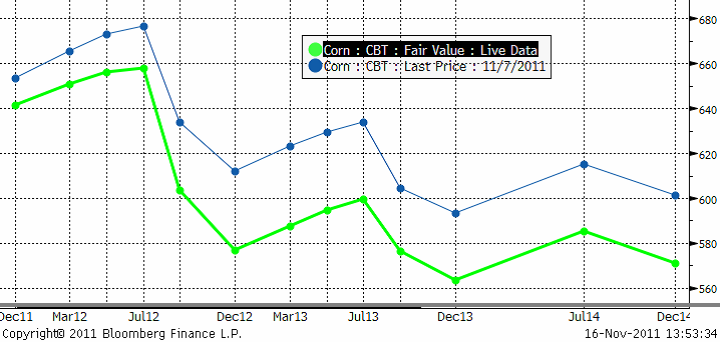
Nedan ser aktuell terminskurva (grön) och för en vecka sedan (blå). Vi ser att tendensen till mer backwardation.
Sojabönor
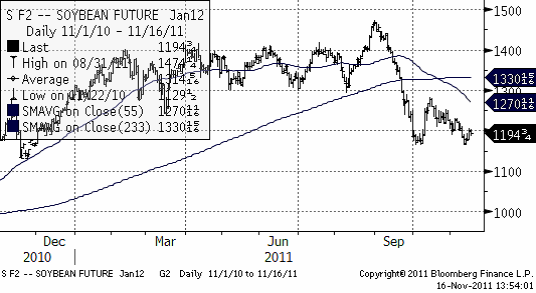
Priset på sojabönor befinner sig i sjunkande trend. Vi har redan sett de sjunkande priserna på fläskkött i Kina. Å andra sidan, China National Grain & Oils Information Center släppte en rapport i förrgår där de menar att Kinas import av sojabönor för marknadsföringsåret 2011-12 kan öka med 7% till 56 mt.
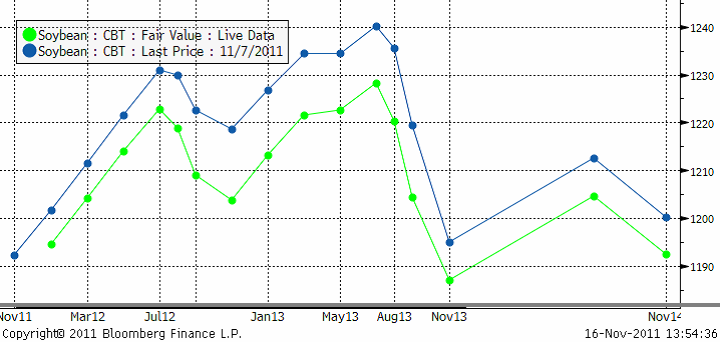
Nedan ser vi terminskurvorna (nu, grön) och för en vecka sedan.
Det mest sannolika är nog ett test nedåt på sojabönorna, men fundamenta ger stöd just nu. Vi väntar oss nog ändå att säljarna kommer in – från Brasilien om inte annat – och säljer ner sojabönorna under stödet på 1167. På tre månaders sikt är vi negativa.
Raps
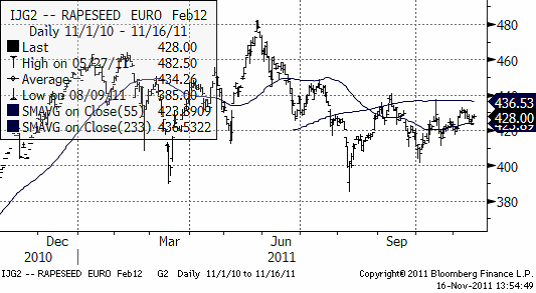
Rapspriset håller sig högt pga den svaga euron, inget annat. Raps är dyrt i förhållande till sojabönor och ”borde” falla ner mot 400 euro i första hand.
Gris
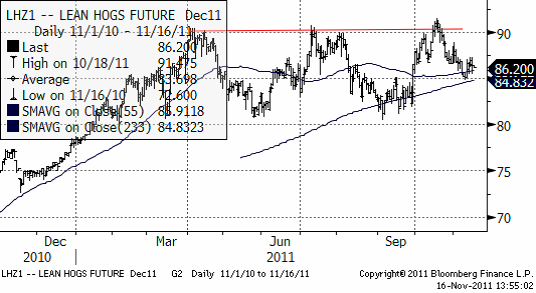
Tekniskt vilar priset på lean hogs på de glidande medelvärdena, vilket kan ge visst stöd. Test av dessa ger viktig information om rörelsen på kort sikt. Det falska brottet uppåt i oktober, ger en stark varning om att ”bulls” håller på att förlora kriget. Det är ganska vanligt att marknaden faller av kraftigt efter att den visat en falsk köpsignal. Ytterligare säljasignal ges när de glidande medelvärdena bryts. Just nu ger de glidande medelvärdena stöd. Nedan ser vi decemberkontraktet på CME, där priset fortsatt har varit i rekyl från den falska köpsignalen för två veckor sedan.
På en veckas sikt är vi negativa till lean hogs, men priset står och väger, ännu.
Valutor
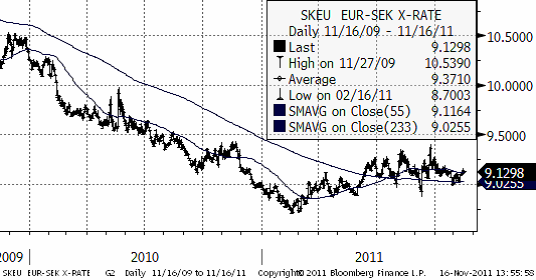
EURSEK handlas i ett volatilt brett intervall. Det finns inga signaler att utläsa alls.
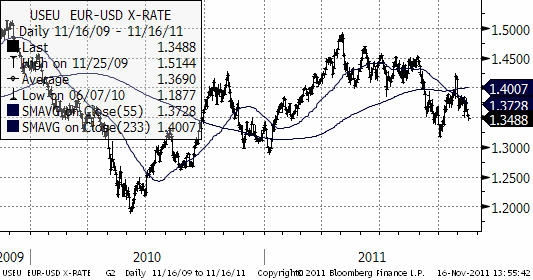
EURUSD tycks slutligen bryta nedåt. Det korta besöket över de glidande medelvärdena (som båda säjer ”sälj”), stärker den negativa vyn. All fundamenta talar för att euron ska falla och det ordentligt.
Tekniskt är läget en klar säljsignal. I första hand är nästa stöd 1.3145 dollar. I andra hand är det botten nere vid 1.2 dollar.
Gödsel
Kalium
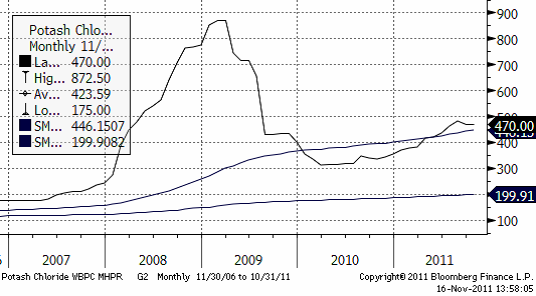
Priset på kalium ligger kvar på samma nivå som för ett par veckor sedan.
Kväve
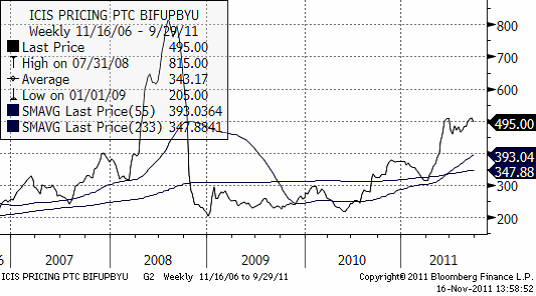
Nedan ser vi prisutvecklingen på Urea FOB Yuzhny i dollar per ton.
Fosfor
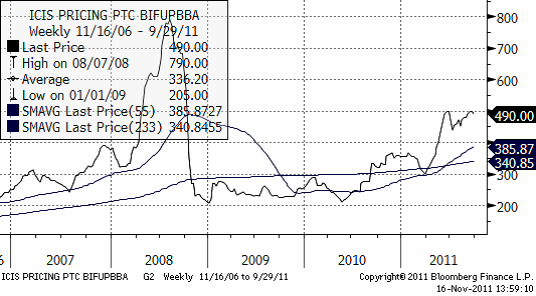
Nedan ser vi prisutvecklingen på Diammoniumfosfat FOB Baltic i dollar per ton.
[box]SEB Veckobrev Jordbruksprodukter är producerat av SEB Merchant Banking och publiceras i samarbete och med tillstånd på Råvarumarknaden.se[/box]
Disclaimer
The information in this document has been compiled by SEB Merchant Banking, a division within Skandinaviska Enskilda Banken AB (publ) (“SEB”).
Opinions contained in this report represent the bank’s present opinion only and are subject to change without notice. All information contained in this report has been compiled in good faith from sources believed to be reliable. However, no representation or warranty, expressed or implied, is made with respect to the completeness or accuracy of its contents and the information is not to be relied upon as authoritative. Anyone considering taking actions based upon the content of this document is urged to base his or her investment decisions upon such investigations as he or she deems necessary. This document is being provided as information only, and no specific actions are being solicited as a result of it; to the extent permitted by law, no liability whatsoever is accepted for any direct or consequential loss arising from use of this document or its contents.
About SEB
SEB is a public company incorporated in Stockholm, Sweden, with limited liability. It is a participant at major Nordic and other European Regulated Markets and Multilateral Trading Facilities (as well as some non-European equivalent markets) for trading in financial instruments, such as markets operated by NASDAQ OMX, NYSE Euronext, London Stock Exchange, Deutsche Börse, Swiss Exchanges, Turquoise and Chi-X. SEB is authorized and regulated by Finansinspektionen in Sweden; it is authorized and subject to limited regulation by the Financial Services Authority for the conduct of designated investment business in the UK, and is subject to the provisions of relevant regulators in all other jurisdictions where SEB conducts operations. SEB Merchant Banking. All rights reserved.
Analys
More weakness and lower price levels ahead, but the world won’t drown in oil in 2026

Some rebound but not much. Brent crude rebounded 1.5% yesterday to $65.47/b. This morning it is inching 0.2% up to $65.6/b. The lowest close last week was on Thursday at $64.11/b.

The curve structure is almost as week as it was before the weekend. The rebound we now have gotten post the message from OPEC+ over the weekend is to a large degree a rebound along the curve rather than much strengthening at the front-end of the curve. That part of the curve structure is almost as weak as it was last Thursday.
We are still on a weakening path. The message from OPEC+ over the weekend was we are still on a weakening path with rising supply from the group. It is just not as rapidly weakening as was feared ahead of the weekend when a quota hike of 500 kb/d/mth for November was discussed.
The Brent curve is on its way to full contango with Brent dipping into the $50ies/b. Thus the ongoing weakening we have had in the crude curve since the start of the year, and especially since early June, will continue until the Brent crude oil forward curve is in full contango along with visibly rising US and OECD oil inventories. The front-month Brent contract will then flip down towards the $60/b-line and below into the $50ies/b.
At what point will OPEC+ turn to cuts? The big question then becomes: When will OPEC+ turn around to make some cuts? At what (price) point will they choose to stabilize the market? Because for sure they will. Higher oil inventories, some more shedding of drilling rigs in US shale and Brent into the 50ies somewhere is probably where the group will step in.
There is nothing we have seen from the group so far which indicates that they will close their eyes, let the world drown in oil and the oil price crash to $40/b or below.
The message from OPEC+ is also about balance and stability. The world won’t drown in oil in 2026. The message from the group as far as we manage to interpret it is twofold: 1) Taking back market share which requires a lower price for non-OPEC+ to back off a bit, and 2) Oil market stability and balance. It is not just about 1. Thus fretting about how we are all going to drown in oil in 2026 is totally off the mark by just focusing on point 1.
When to buy cal 2026? Before Christmas when Brent hits $55/b and before OPEC+ holds its last meeting of the year which is likely to be in early December.
Brent crude oil prices have rebounded a bit along the forward curve. Not much strengthening in the structure of the curve. The front-end backwardation is not much stronger today than on its weakest level so far this year which was on Thursday last week.

The front-end backwardation fell to its weakest level so far this year on Thursday last week. A slight pickup yesterday and today, but still very close to the weakest year to date. More oil from OPEC+ in the coming months and softer demand and rising inventories. We are heading for yet softer levels.

Analys
A sharp weakening at the core of the oil market: The Dubai curve

Down to the lowest since early May. Brent crude has fallen sharply the latest four days. It closed at USD 64.11/b yesterday which is the lowest since early May. It is staging a 1.3% rebound this morning along with gains in both equities and industrial metals with an added touch of support from a softer USD on top.

What stands out the most to us this week is the collapse in the Dubai one to three months time-spread.
Dubai is medium sour crude. OPEC+ is in general medium sour crude production. Asian refineries are predominantly designed to process medium sour crude. So Dubai is the real measure of the balance between OPEC+ holding back or not versus Asian oil demand for consumption and stock building.
A sharp weakening of the front-end of the Dubai curve. The front-end of the Dubai crude curve has been holding out very solidly throughout this summer while the front-end of the Brent and WTI curves have been steadily softening. But the strength in the Dubai curve in our view was carrying the crude oil market in general. A source of strength in the crude oil market. The core of the strength.
The now finally sharp decline of the front-end of the Dubai crude curve is thus a strong shift. Weakness in the Dubai crude marker is weakness in the core of the oil market. The core which has helped to hold the oil market elevated.
Facts supports the weakening. Add in facts of Iraq lifting production from Kurdistan through Turkey. Saudi Arabia lifting production to 10 mb/d in September (normal production level) and lifting exports as well as domestic demand for oil for power for air con is fading along with summer heat. Add also in counter seasonal rise in US crude and product stocks last week. US oil stocks usually decline by 1.3 mb/week this time of year. Last week they instead rose 6.4 mb/week (+7.2 mb if including SPR). Total US commercial oil stocks are now only 2.1 mb below the 2015-19 seasonal average. US oil stocks normally decline from now to Christmas. If they instead continue to rise, then it will be strongly counter seasonal rise and will create a very strong bearish pressure on oil prices.
Will OPEC+ lift its voluntary quotas by zero, 137 kb/d, 500 kb/d or 1.5 mb/d? On Sunday of course OPEC+ will decide on how much to unwind of the remaining 1.5 mb/d of voluntary quotas for November. Will it be 137 kb/d yet again as for October? Will it be 500 kb/d as was talked about earlier this week? Or will it be a full unwind in one go of 1.5 mb/d? We think most likely now it will be at least 500 kb/d and possibly a full unwind. We discussed this in a not earlier this week: ”500 kb/d of voluntary quotas in October. But a full unwind of 1.5 mb/d”
The strength in the front-end of the Dubai curve held out through summer while Brent and WTI curve structures weakened steadily. That core strength helped to keep flat crude oil prices elevated close to the 70-line. Now also the Dubai curve has given in.

Brent crude oil forward curves

Total US commercial stocks now close to normal. Counter seasonal rise last week. Rest of year?

Total US crude and product stocks on a steady trend higher.

Analys
OPEC+ will likely unwind 500 kb/d of voluntary quotas in October. But a full unwind of 1.5 mb/d in one go could be in the cards

Down to mid-60ies as Iraq lifts production while Saudi may be tired of voluntary cut frugality. The Brent December contract dropped 1.6% yesterday to USD 66.03/b. This morning it is down another 0.3% to USD 65.8/b. The drop in the price came on the back of the combined news that Iraq has resumed 190 kb/d of production in Kurdistan with exports through Turkey while OPEC+ delegates send signals that the group will unwind the remaining 1.65 mb/d (less the 137 kb/d in October) of voluntary cuts at a pace of 500 kb/d per month pace.

Signals of accelerated unwind and Iraqi increase may be connected. Russia, Kazakhstan and Iraq were main offenders versus the voluntary quotas they had agreed to follow. Russia had a production ’debt’ (cumulative overproduction versus quota) of close to 90 mb in March this year while Kazakhstan had a ’debt’ of about 60 mb and the same for Iraq. This apparently made Saudi Arabia angry this spring. Why should Saudi Arabia hold back if the other voluntary cutters were just freeriding? Thus the sudden rapid unwinding of voluntary cuts. That is at least one angle of explanations for the accelerated unwinding.
If the offenders with production debts then refrained from lifting production as the voluntary cuts were rapidly unwinded, then they could ’pay back’ their ’debts’ as they would under-produce versus the new and steadily higher quotas.
Forget about Kazakhstan. Its production was just too far above the quotas with no hope that the country would hold back production due to cross-ownership of oil assets by international oil companies. But Russia and Iraq should be able to do it.
Iraqi cumulative overproduction versus quotas could reach 85-90 mb in October. Iraq has however steadily continued to overproduce by 3-5 mb per month. In July its new and gradually higher quota came close to equal with a cumulative overproduction of only 0.6 mb that month. In August again however its production had an overshoot of 100 kb/d or 3.1 mb for the month. Its cumulative production debt had then risen to close to 80 mb. We don’t know for September yet. But looking at October we now know that its production will likely average close to 4.5 mb/d due to the revival of 190 kb/d of production in Kurdistan. Its quota however will only be 4.24 mb/d. Its overproduction in October will thus likely be around 250 kb/d above its quota with its production debt rising another 7-8 mb to a total of close to 90 mb.
Again, why should Saudi Arabia be frugal while Iraq is freeriding. Better to get rid of the voluntary quotas as quickly as possible and then start all over with clean sheets.
Unwinding the remaining 1.513 mb/d in one go in October? If OPEC+ unwinds the remaining 1.513 mb/d of voluntary cuts in one big go in October, then Iraq’s quota will be around 4.4 mb/d for October versus its likely production of close to 4.5 mb/d for the coming month..
OPEC+ should thus unwind the remaining 1.513 mb/d (1.65 – 0.137 mb/d) in one go for October in order for the quota of Iraq to be able to keep track with Iraq’s actual production increase.
October 5 will show how it plays out. But a quota unwind of at least 500 kb/d for Oct seems likely. An overall increase of at least 500 kb/d in the voluntary quota for October looks likely. But it could be the whole 1.513 mb/d in one go. If the increase in the quota is ’only’ 500 kb/d then Iraqi cumulative production will still rise by 5.7 mb to a total of 85 mb in October.
Iraqi production debt versus quotas will likely rise by 5.7 mb in October if OPEC+ only lifts the overall quota by 500 kb/d in October. Here assuming historical production debt did not rise in September. That Iraq lifts its production by 190 kb/d in October to 4.47 mb/d (August level + 190 kb/d) and that OPEC+ unwinds 500 kb/d of the remining quotas in October when they decide on this on 5 October.

-

 Nyheter4 veckor sedan
Mahvie Minerals i en guldtrend
-

 Analys4 veckor sedan
Volatile but going nowhere. Brent crude circles USD 66 as market weighs surplus vs risk
-
 Nyheter4 veckor sedan
Aktier i guldbolag laggar priset på guld
-

 Nyheter3 veckor sedan
Kinas elproduktion slog nytt rekord i augusti, vilket även kolkraft gjorde
-

 Nyheter3 veckor sedan
Tyskland har så höga elpriser att företag inte har råd att använda elektricitet
-
 Nyheter4 veckor sedan
Guld når sin högsta nivå någonsin, nu även justerat för inflation
-
 Nyheter4 veckor sedan
Det stigande guldpriset en utmaning för smyckesköpare
-

 Analys4 veckor sedan
Waiting for the surplus while we worry about Israel and Qatar


