

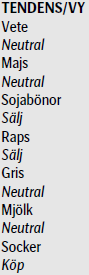
Analys
SEB Jordbruksprodukter, 9 september 2013


 Vetemarknaden ligger och driver i nyhetsmässig stiltje. Majs- och i synnerhet sojamarknaden håller på att lämna ett år med låga lager och gå över till ett år med väsentligt högre produktion. Ännu finns dock inga riktigt tillförlitliga estimat på skördens storlek i USA och hur torkan i augusti har påverkat den.
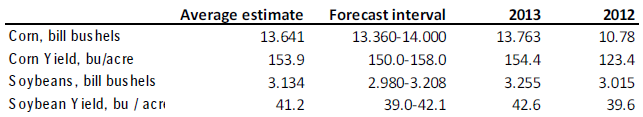
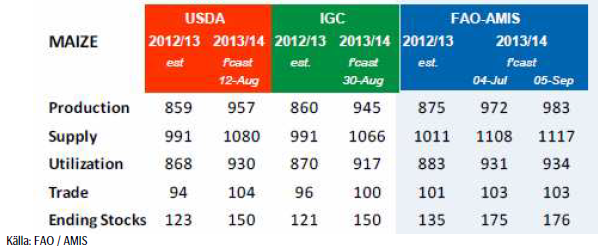
På torsdag kommer dock september månads WASDE-rapport och den kan ge viss vägledning. Redan den 17 september publicerar FAS en rapport på arealen och den kan också ge viktig vägledning för marknaden. Vi har sammanställt analytikerkårens estimat på WASDE-rapporten och du ser den nedan:
Vete
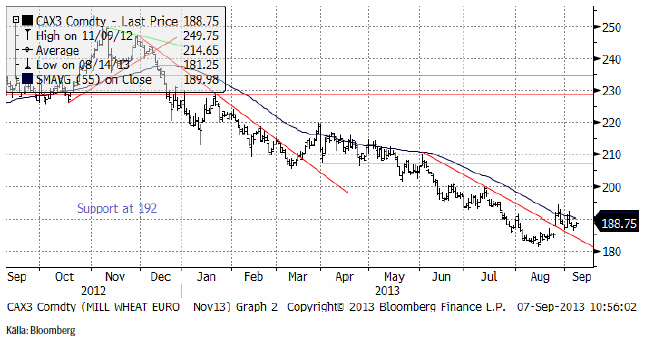
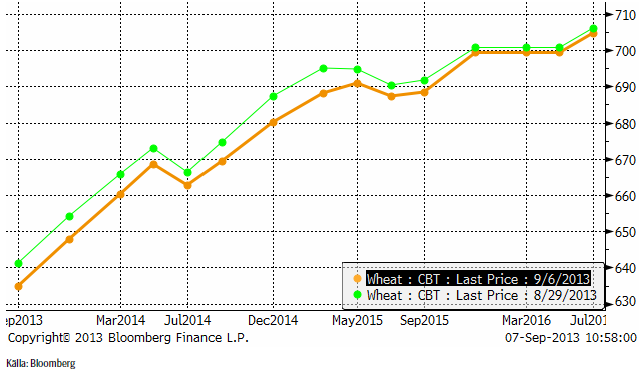
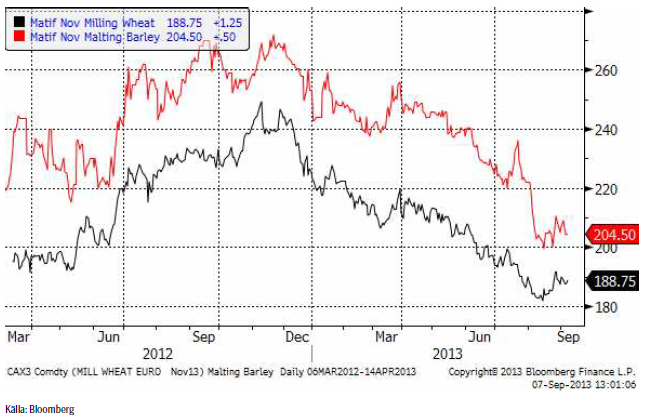
November vetet på Matif höll sig över stödlinjen, men backade större delen av veckan. I EU trycker fortfarande lantbrukarna på sin fysiska spannmål.
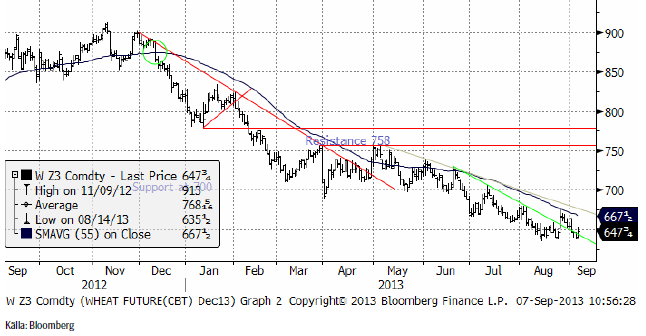
Decemberkontraktet på CBOT tycks ha ett stöd strax under dagens pris. Stödet ligger vid 640 cent ungefär. Priset studsade upp från den nivån mot slutet av veckan.
Nedan ser vi terminskurvorna för Chicagovete. Det är den enda marknad som det är intressant att sälja långa terminer på, eftersom det är contango och nästan alltid är det.
Dessutom ser utvecklingen i EU:s nya lagförslag om värdepappersmarknaden, Mifid 2 och Mifir ut att slå hårt mot Matif som marknadsplats. Lagförslaget kommer att göra det så dyrt att handla terminer inom EU att Matif omöjligen kommer att kunna stå sig i konkurrensen med de amerikanska börserna.
Tisdagens Crop Progress från USDA visar att skörden av amerikanskt vårvete fortsätter att avancera i raskt takt. För de 6 stater som rapporterar så är nu 64% av skörden avklarad, en ökning från förra veckans 42% men något under det 5-åriga genomsnittet på 69% och väl under förra årets 93% vid den här tiden.
70% klassas som ”good/excellent”, en ökning från förra veckans 67%.
Egypten har köpt ytterligare 355 000 ton vete för leverans i början av oktober, vilket gör att totalen för den veckan uppgår till 650 000 t. Ungefär samma fördelning som förra gången med 180 000 t ryskt vete, 120 000 t rumänskt vete och resten från Ukraina. Det franska vete som offererades ligger fortfarande över i pris, dock något lägre än förra tendern. Inga offerter lämnades för amerikanskt vete.
Den ryska regeringen uppger att det kan vara svårt att hålla fast vid en exportsiffra på 18-20 mt för 2013/14 på grund av hög produktion i länderna kring Svarta Havet och deras konkurrens på den internationella marknaden.
Buenos Aires Grain Exchange rapporterade i veckan att den 45% av vete är i mycket bra kondition, men att veteområdena var torra. De sade också att 90% av kornarealen var i gott eller väldigt gott skick.
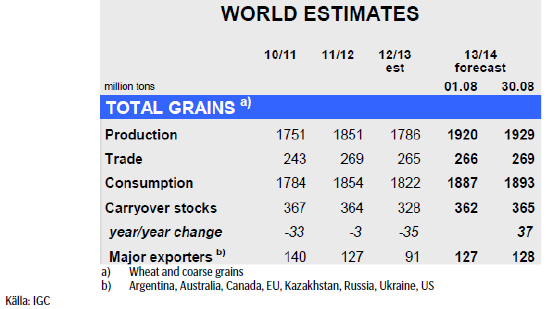
IGC (International Grains Council) kom med sin rapport i förra veckan och har ökat sitt estimat för den globala spannmålsproduktionen 2013/14 med 9 mt till 1929 mt. Stora skördar av bl.a vete och majs bidrar till en förväntad ökning med 8% på årsbasis från 2012 års produktion då torka drabbade stor del av grödorna. Utgående lager förväntas öka med 37 mt på årsbasis till 365 mt, vilket framförallt återspeglar högre utgående lager för majs (+29 mt y/y).
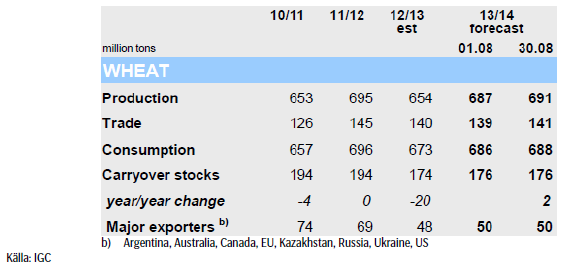
För vete indikeras en global produktion på 691 mt, vilket börjar närma sig rekordnivån under 2011/12, som en följd av uppjusteringar för EU, Kazakstan, Ukraina och Kanada. Den stabila efterfrågan på vete, delvis på grund av kvalitetsproblem i Kina, har gett fortsatt stöd åt priserna. Dock förväntas en marginell ökning av utgående lager 2013/14, som nu estimeras till 176 mt – inklusive en viss återhämtning hos de stora exportörerna. Utgående lager i USA förväntas däremot sjunka till den lägsta nivån på 6 år (15 mt).
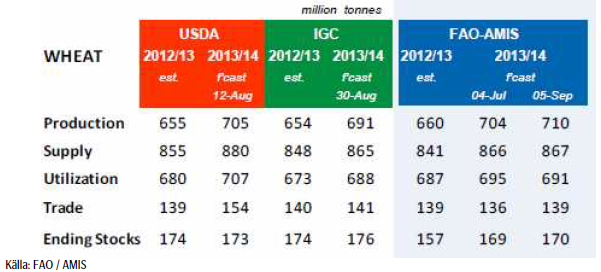
Även FAO / AMIS kom med sin rapport nu i veckan och de har justerat upp sin prognos för den globala veteproduktionen 2013/14 med 6 mt till 710 mt, som en följd av förbättrade utsikter i EU och OSS samt mer gynnsamma utsikter i Australien, Argentina och Kanada. Utgående lager beräknas öka med ca 8%, där merparten är koncentrerad till EU, Kina och OSS-länderna. Utsikterna är gynnsamma på det norra halvklotet där skörden av höstvete nu är avklarad och där skörden av vårvete påbörjats. USA, Kanada, Ryssland och Kazakstan visar på goda prognoser för vårvete, men den slutliga avkastningen kommer att vara beroende av gynnsamt väder under den kommande månaden. Samma sak gäller för södra halvklotet där t.ex Australiens grödor är i stort behov av regn den närmsta tiden då det finns en viss oro över torkan i delar av landet. Även Argentina är i behov av mer nederbörd. I Brasilien har frost orsakat betydande skador på sina ställen.
Maltkorn
Maltkornet rekylerade uppåt samtidigt med vetet och oljeväxterna. För maltkornet fanns (och finns) ett starkt stöd vid 200 euro. Jämna siffror tenderar att attrahera köp-ordrar när priset kommer farande uppifrån. Den senaste veckan har maltkornet utvecklats svagare än vetet på Matif.
Majs
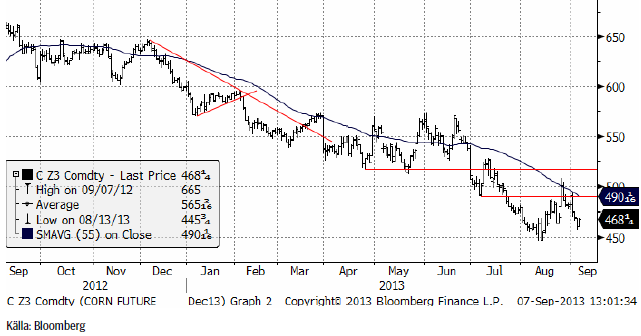
Majspriset (december 2013) föll tillbaka i veckan som gick och befinner sig alltjämt i negativ trend. Tidiga skörderapporter från södra USA visar på högre avkastning än väntat. Etanolefterfrågan har planat ut. Kinas CNGOIC nämnde dock i veckan en importpotential om 20 – 30 mt.
Tisdagens Crop Progress från USDA gav fortsatta nedjusteringar gällande tillståndet för den amerikanska majsen. För de 18 stater som rapporterar så klassas nu 56% som ”good/excellent”, ner 3% från veckan innan men fortfarande över förra årets torka-drabbade 22% samt över det 5-åriga genomsnittet på 55%. I Iowa tillhör endast 39% av grödorna kategorin ”good/excellent”, medan omkring 57% respektive 66% tillhör denna kategori i Illinois och Indiana. Siffran för ”good/excellent” i Indiana och Iowa har justeras ned med 6% respektive 5% från veckan innan.
Andelen majs som har uppnått mjölmognad uppgår till 42%, en ökning från förra veckans 23%. Förra året under torkan så låg siffran på 84% vid den här tiden, men det 5-åriga genomsnittet för samma datum ligger på 61%. Runt 46% av grödorna i Illinois har nått detta utvecklingsstadium, en ökning från 29%, medan siffran för Indiana ligger på 47%, upp från 22% veckan innan.
Informa Economics Inc, en analysfirma baserad i Tennessee, skrev i en rapport i fredags att de väntar sig att global majsproduktion kommer att uppgå till 955 mt under 2013/14. De sänkte därmed sitt estimat från 957.7 mt, som de publicerade förra månaden.
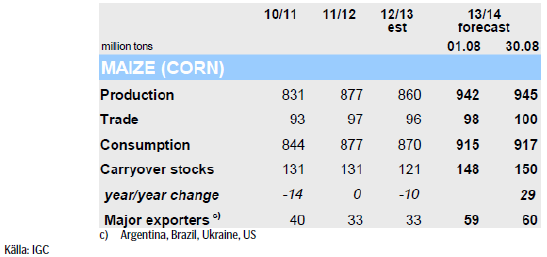
IGC rapporterade i veckan som gick. Den globala produktionen av majs beräknas uppgå till 945 mt, en ökning med 3 mt sedan IGC’s förra rapport och en ökning med 10% på årsbasis. Revideringen sker trots en förväntad lägre produktion i Sydamerika, vilket istället gynnar sojabönor, men baseras på högre produktion i USA.
FAO justerar upp estimatet för den globala produktionen av majs till 983 mt från den tidigare prognosen på 972 mt, främst på grund av större skördar i Argentina och förbättrade utsikter för EU och Ukraina. Utgående lager beräknas öka med 30% från ingående lager, och USA står för merparten av denna ökning där lagren kan komma att stiga med 27 mt eller 146%. Överlag är utsikterna för grödorna goda. I USA klassas cirka hälften som ”good/excellent, och trots torrt och varmt väder under augusti så förväntas en jätteskörd – till stor del på grund av utökad areal. Även i Kanada och EU är prognoserna gynnsamma, med undantag av bl.a norra Italien, Slovenien och Kroatien där sen sådd och varma temperaturer påverkat grödorna negativt. Även i övriga delar världen, såsom Ryssland, Kina, Ukraina och Brasilien är utsikterna goda.
Som nämnt ovan behåller vi alltså förra veckans neutral-rekommendation.
Sojabönor
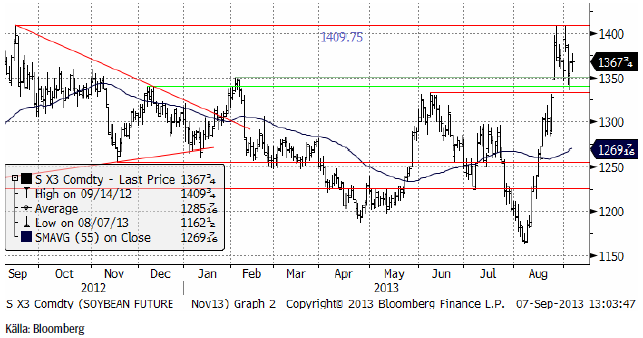
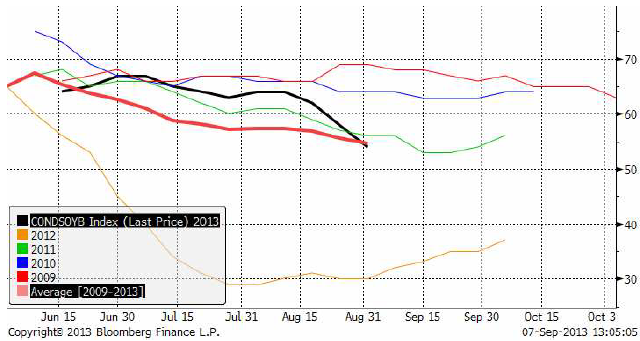
Novemberkontraktet på sojabönor pendlade i veckan som gick mellan den tekniska stödnivån 1350 och det tekniska motståndet 1409 cent / bushel. Vi tror att uppgången är klar och att de som tror på nedgång har de starkare korten. Brasiliens skörd är nu bara 4 månader bort.
Informa Economics i Tennessee skickade ut sin senaste månatliga prognos på sojaskörden 2013/14 i fredags. Sedan förra månaden har de sänkt estimatet för global produktion från 288 mt till 285 mt. Det är en mycket marginell minskning.
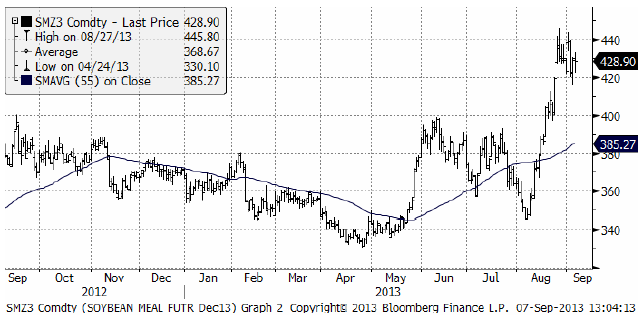
Sojamarknaden är naturligt uppdelad på sojamjöl och sojaolja och det är två helt olika världar. Efterfrågan på sojamjöl är stark, medan världen har mer än nog av vegetabiliska oljor. Nedan ser vi prisutvecklingen på sojamjöl i dollar per short ton.
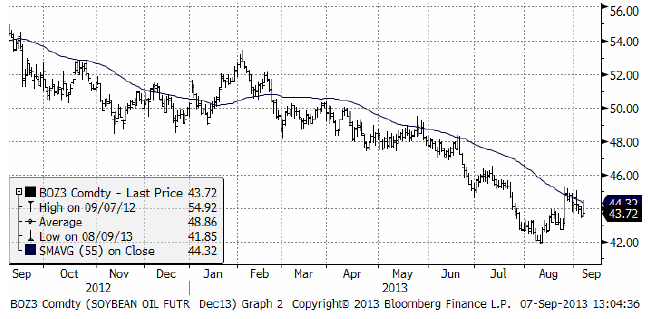
Och nedan ser vi den mycket baissigare utvecklingen på sojaoljan.
Tisdagens Crop Progress från USDA visade även på fortsatta nedjusteringar för sojabönor. 54% klassas nu som ”good/excellent”, ner från förra veckans 58% men fortfarande över förra årets 30% och genomsnittet på 55%. De senaste veckornas varma och torra väder har framförallt drabbat de stora producenterna i ”Istaterna” där andelen ”good/excellent” faller tillbaka med 5-8%, och det enbart under förra veckan. I Illinois och Indiana klassas 52% resp. 62% som ”good/excellent”, medan endast 39% av Iowas grödor tillhör denna kategori.
92% av sojabönorna har uppnått stadiet baljsättning, en ökning från förra veckans 84%. Förra året vid den här tiden låg siffran på 98% och det 5-åriga genomsnittet ligger på 96%.
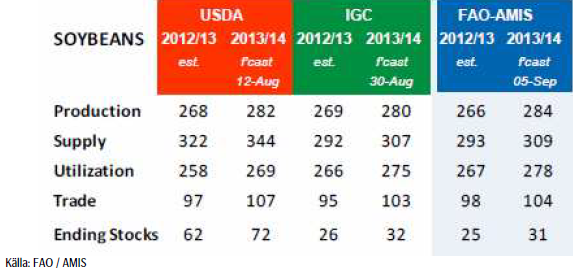
IGC rapporterade i veckan som gick. För sojabönor förväntas en global produktion på rekordhöga 280 mt för 2013/14, en ökning med 4% på årsbasis, framförallt tack vare estimerade jätteskördar i Sydamerika. Produktionen i USA justeras ner från tidigare prognos på 93.1 mt till 88.6 mt, vilket fortfarande är en ökning med 8% på årsbasis och den högsta nivån sedan 2010/11. Globala lager kommer sannolikt att öka för andra året i rad. Den globala produktionen av raps / canola beräknas öka med 4% på årsbasis under 2013/14, samtidigt som utgående lager beräknas öka modest för första gången på 4 år.
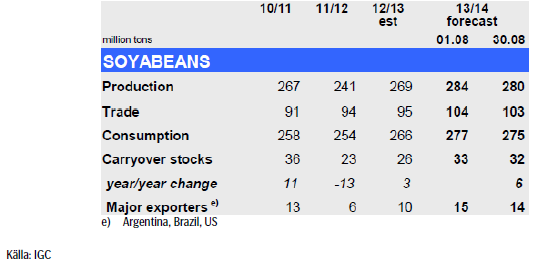
Enligt FAO:s rapport visar tidiga indikationer på en rekordproduktion av sojabönor 2013/2014. Högre produktion i länder som Argentina, USA, Brasilien och Indien förväntas bidra till en global produktion på 284 mt. Även lagren förväntas öka ordentligt – framförallt i USA, Argentina och Brasilien. Utsikterna för grödorna är gynnsamma, även om den långvariga torkan i den amerikanska Mellanvästern skapar oro så klassas fortfarande ungefär hälften som ”good/excellent”. I Kina är förutsättningarna goda i de norra och nordöstra delarna av landet och även i Indien finns det goda förutsättningar, trots en viss oro över alltför mycket blöta.
Raps
Rapspriset rekylerade ner mot 380 euro under veckan, efter att motståndet vid 392 euro höll.
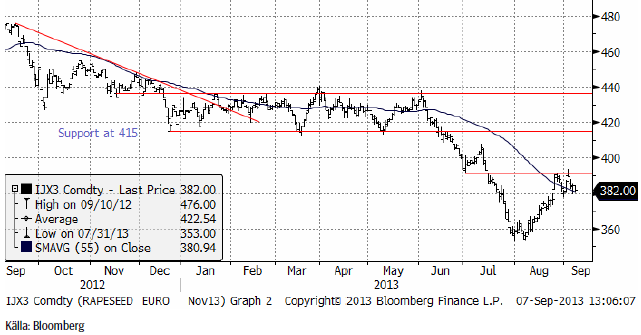
Vi tror att det kan komma en sväng nedåt, under 380 euro per ton och behåller säljrekommendation på raps.
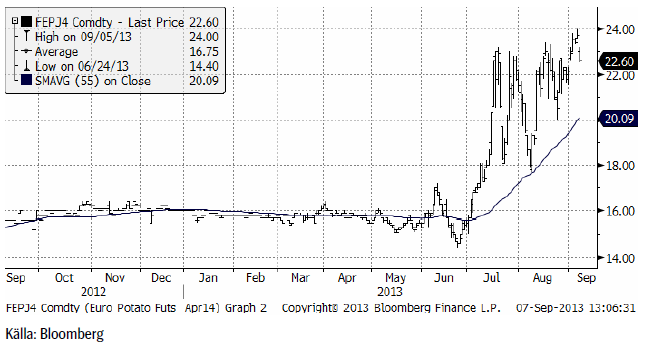
Potatis
Potatispriset har fortsätt att ligga vid 22 euro per 100 Kg på Eurexbörsen.
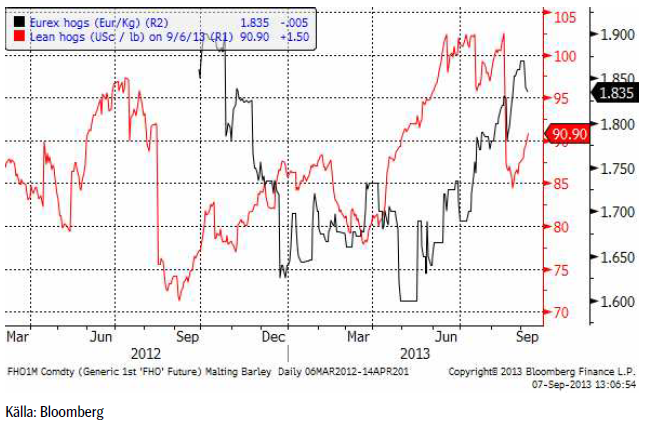
Gris
Eurexpriset rekylerade ner i veckan som gick, medan amerikanska Lean Hogs fortsatte upp. Dyrt nötkött i USA, väntas medföra att fler väljer fläsk.
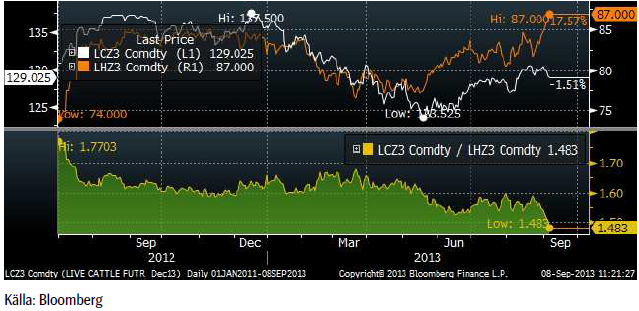
Lean Hogs har gått upp i pris mycket mer än Live Cattle. Nedan ser i kvoten mellan priset på decemberkontrakten. Lean Hogs har utklassat Live Cattle i nästan två år. Lean Hogs är nu rekorddyrt i förhållande till Live Cattle (som dock ligger på en högre nivå, i absoluta pengar).
Mjölk
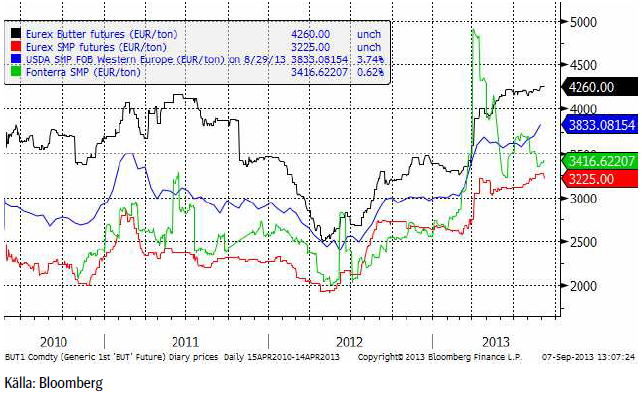
Terminerna på smör och skummjölkspulver vid Eurex-börsen har fortsatt att stiga i veckan som gick. Fonterras pris noterar också en liten uppgång. USDAs europeiska SMP-notering visar också på en uppgång och bekräftar den positiva utvecklingen på Eurex terminsmarknad.
Socker
Oktoberkontraktet på råsocker steg kraftigt mot slutet av veckan och testar nu motståndet för den fallande trenden från oktober förra året – se diagrammet nedan!
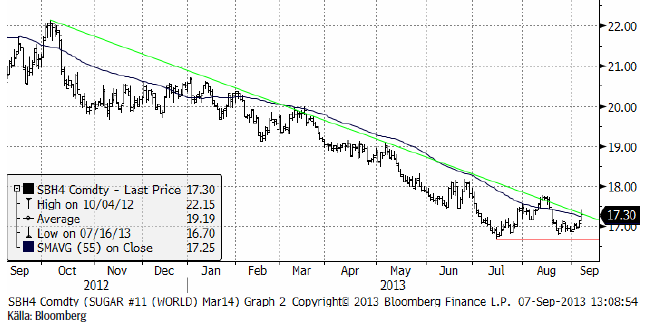
Bakom detta ligger en rapport från handelsföretaget Czarnikow i London. De sade i torsdags att överskottet i marknaden kan vara mycket mindre än vad folk tror. De menade att marknaden underskattar den stimulans till ökad konsumtion som de lägre priserna ger. De sänkte estimatet på överskottet till 2 mt nästa år (som börjar i oktober), från 3.9 mt.
The International Sugar Organization publicerade ett estimat för två veckor sedan på ett överskott på 4.5 mt, medan andra analytiker ligger på 4 mt i genomsnitt.
Czernikow nämner också att odlingen av betor dels kommer att bli mindre och att vädret i Europa inte gynnat betodlingen i år. De sänker också estimatet för produktionen i Brasilien med 10 mt till 585 mt, för Sudeste regionen, där man odlar sockerrör (delstaterna São Paulo, Paraná, Rio, Minas Gerais). Den regionen står för 90% av Brasiliens produktion.
Czarnikow höjer konsumtionstillväxten till 2.3% under 2013 och 2% nästa år. De menade att dessa estimat är konservativa. Det låga priset kan stimulera till högre konsumtionstillväxt än så.
De nämner också att sockerbruken i Brasilien som alltid betalar en cent under terminspriset på socker för inlevererade sockerrör vid skörd (nu), inte gör det. Det tyder på konkurrens om råvaran.
Dessutom handlas fysiskt socker nu till ett premium över terminsnoteringen i New York – även det ett tecken på att marknaden är starkare än vad man kan tro.
Vi förstår ekonomin bakom detta resonemang och eftersom dessa tecken absolut kan tolkas som att ekonomin håller på att vända, gör vi en försiktig justering av vår rekommendation från att ha varit neutral under lång tid, till köp. Den som vill investera i socker, kan göra det genom ett börshandlat certifikat. Vi rekommenderar SOCKER S, men den som vill ta mer risk, kan välja BULL SOCKER X4 S.
Gödsel
Priset på kväve / urea hittills i september har legat still strax under 280 dollar per ton. Köpare börjar komma tillbaka till marknaden, berättar en fysisk handlare. Fabriker i Ukraina har stängts, då priset börjar komma ner till produktionskostnaden. Kväve på dessa priser är antagligen ett mycket bra köp för lantbrukare. Vi erbjuder terminshandel i urea, vilket kan vara en ”proxy” för kväveinnehållet även i andra blandningar.
Nedan ser vi priset på urea FOB Yuzhnyy, 1 månads termin, i dollar / ton. Det är en liten prisuppgång i veckan.
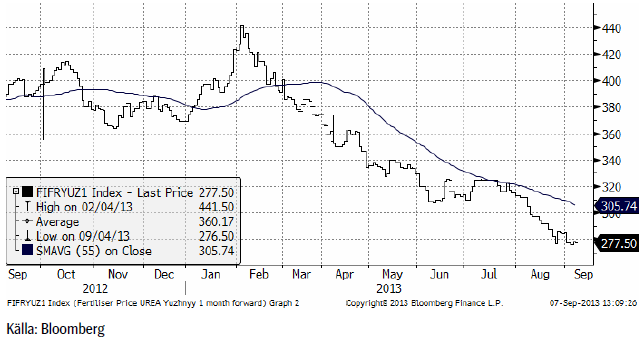
Som en av väldigt få banker i världen erbjuder vi nu också terminshandel i noteringen för CAN Germany.
Fosfat och kali är oförändrade prismässigt. Det visar, som vi skrivit tidigare, att brytningen mellan Uralkali och Vitrysslands kaliumföretag, Belaruskali, ännu inte påverkat priserna negativt. Marknaden som förstår att ekonomiska drivkrafter obönhörligen verkar, håller dock aktiekursen på Potash Corporation väsentligt lägre än innan kartellen bröts upp.
I Vitryssland har Uralkalis fängslade VD hörts av domaren Natalia Pykina vid en tingsrätt i Minsk. Hon och Lukaschenko tillhör en liten grupp människor i Vitryssland som är förbjudna att besöka EU, efter att hon för två år sedan dömt en politisk motståndare till Lukaschenko till tre och ett halvt års isolerad fängelsevistelse.
[box]SEB Veckobrev Jordbruksprodukter är producerat av SEB Merchant Banking och publiceras i samarbete och med tillstånd på Råvarumarknaden.se[/box]
Disclaimer
The information in this document has been compiled by SEB Merchant Banking, a division within Skandinaviska Enskilda Banken AB (publ) (“SEB”).
Opinions contained in this report represent the bank’s present opinion only and are subject to change without notice. All information contained in this report has been compiled in good faith from sources believed to be reliable. However, no representation or warranty, expressed or implied, is made with respect to the completeness or accuracy of its contents and the information is not to be relied upon as authoritative. Anyone considering taking actions based upon the content of this document is urged to base his or her investment decisions upon such investigations as he or she deems necessary. This document is being provided as information only, and no specific actions are being solicited as a result of it; to the extent permitted by law, no liability whatsoever is accepted for any direct or consequential loss arising from use of this document or its contents.
About SEB
SEB is a public company incorporated in Stockholm, Sweden, with limited liability. It is a participant at major Nordic and other European Regulated Markets and Multilateral Trading Facilities (as well as some non-European equivalent markets) for trading in financial instruments, such as markets operated by NASDAQ OMX, NYSE Euronext, London Stock Exchange, Deutsche Börse, Swiss Exchanges, Turquoise and Chi-X. SEB is authorized and regulated by Finansinspektionen in Sweden; it is authorized and subject to limited regulation by the Financial Services Authority for the conduct of designated investment business in the UK, and is subject to the provisions of relevant regulators in all other jurisdictions where SEB conducts operations. SEB Merchant Banking. All rights reserved.

Market is starting to take US/Iran headlines with a pinch of salt. Brent crude rose $2.8/b yesterday to an official close of $112.1/b. But after that it traded as low as $108.05/b before ending late night at around $109.7/b. Through the day it traded in a range of $106.87 – 112.72/b amid a flurry of news or rumors from Iran and the US. ”US temporary sanctions during negotiations” (falls alarm). ”We will bomb Iran” (not anyhow),… etc. While the market is still fluctuating to this kind of news flow, it is starting to take such headlines with a pinch of salt.

We’ll see. Maybe, maybe not. The Brent M1 contract is trading at $110.2/b this morning which very close to the average ticks through yesterday of $110.4/b.
Trump with bearish, verbal intervention whenever Brent trades above $110/b it seems. What seems to be a pattern is that Trump states something like ”very good negotiations going on with Iran”, ”New leaders in Iran are great,..”, ”Great progress in negotiations,…”, ”Deal in sight,..” etc whenever the Brent M1 contract trades above $110/b. An effort to cool the market. These hot air verbal interventions from Trump used to have a heavy bearish impact on prices, but they now seems to have less and less effect unless they are backed by reality.
As far as we can see there has been no real progress in the negotiations between the US and Iran with both sides still standing by their previous demands.
Iran is getting stronger while the cease fire lasts making a return to war for Trump yet harder. Iran is naturally in constant preparation for a return to war given Trump’s steady threats of bombing Iran again. Iran is naturally doing what ever is possible to prepare for a return to war. And every day the cease fire lasts it is better prepared. This naturally makes it more and more difficult and dangerous for the US to return to warring activity versus Iran as the consequences for energy infrastructure in the Persian Gulf will be more and more severe the longer the cease fire lasts. Israel seems to see it this way as well. That the war is not won and that current frozen state of a cease fire gives Iran opportunity to rebuild military and politically.
Global inventories are drawing down day by day. How much? In the meantime the Strait of Hormuz stays closed. There is varying measures and estimates of how much global inventories are drawing down. Our rough estimate, back of the envelope, is that global inventories are drawing down by at least some 10 mb/d or about 300 mb/d in a balance between loss of supply versus demand destruction. Other estimates we see are a monthly draw of 250-270 mb/d. The IEA only ’measured’ a draw in global observable stocks of 117 mb in April with oil on water rising 53 mb while on shore stocks fell 170 mb. But global stocks are hard to measure with large invisible, unmeasured stocks. As such a back of the envelope approach may be better.
Oil products is what the world is consuming. Oil product prices likely to rise while product stocks fall. Strategic Petroleum Reserves (SPR) are predominantly crude oil. Discharging oil from OECD SPR stocks, a sharp reduction in Chinese crude imports and a reduction in global refinery throughput of 6-7 mb/d has helped to keep crude oil markets satisfactorily supplied. But global inventories are drawing down none the less. And oil products is really what the world is consuming. So if global refinery throughput stays subdued, then demand will eventually have to match the supply of oil products. The likely path forward this summer is a steady draw down in jet fuel, diesel and gasoline. Higher prices for these. Then, if possible, higher refinery throughput and higher usage of crude in response to very profitable refinery margins. And lastly sharper draw in crude stocks and higher prices for these. But some 6 mb/d of oil products used to be exported through the Strait of Hormuz. And it may not be so easy to ramp up refinery activity across the world to compensate. Especially as Ukraine continues to damage Russian refineries as well as Russian crude production and export facilities.
Watch oil product stocks and prices as well as Brent calendar 2027. What to watch for this summer is thus oil product inventories falling and oil product premiums to crude rising. Another measure to watch is the Brent crude 2027 contract as it rises steadily day by day as the Strait of Hormuz stays closed and global oil inventories decline. The latter is close to the highest level since the start of the war and keeps rising.
The Brent M1 contract and the Brent 2027 prices and current price of jet fuel in Europe (ARA). All in USD/b

Our back of the envelope calculation of the global shortage created by the closure of the Strait of Hormuz. Note that 3.5 mb/d of discharge from SPR is also a draw. Note also that ’Forced demand loss’ of 2.5 mb/d is probably temporary and will fall back towards zero as logistics are sorted out leaving ’Price demand loss’ to do the job of balancing the market. Thus a shortfall of at least 9 mb/d created by the closure. More if SPR discharge is included and more if Forced demand loss recedes.

Brent is climbing higher. Front-month is at USD 106.3/bl this morning, close to a weekly high and a USD 9/bl jump from Mondays open. This is the move we flagged as a risk earlier in the week: the market shifting from ”a deal is around the corner” to ”this is going to take longer than we thought”.

Analyst Commodities, SEB
During April, rest-of-year Brent remained remarkably stable around USD 90/bl. A stability which rested on one single assumption: the SoH reopens around 1 May. That assumption is now slowly falling apart.
As we highlighted yesterday: every week of delay beyond 1 May adds (theoretically) ish USD 5/bl to the rest-of-year average, as global inventories draw 100 million barrels per week. i.e., a mid-May reopening implies rest-of-year Brent closer to USD 100/bl, and anything pushing into June or July takes us meaningfully higher.
What’s changed in the last 48 hours:
#1: The US military has formally warned that clearing suspected sea mines from SoH could take up to six months. That is a completely different timescale from what the financial market is pricing. Even a political deal tomorrow does not immediately reopen the strait.
#2: Trump has shifted his tone from urgency to ”strategic patience”. In yesterday’s press conference: ”Don’t rush me… I want a great deal.” The market is reading this as a president no longer feeling pressured by timelines, with the naval blockade running in the background.
#3: So far, the military activity is escalating, not de-escalating. Axios reports Iran is laying more mines in SoH. The US 3rd carrier strike group (USS George H.W. Bush) is arriving with two countermine vessels. Trump yesterday ordered the US Navy to destroy any Iranian boats caught laying mines. While CNN reports that the Pentagon is actively drawing up plans to strike Iranian SoH capabilities and individual Iranian military leaders if the ceasefire collapses. i.e., NOT a attitude consistent with an imminent deal!
Spot crude and product prices eased off the early-April highs on a combination of system rerouting and deal optimism. Both now weakening. Goldman estimates April Gulf output is reduced by 14.5 mbl/d, or 57% of pre-war supply, a number that keeps getting worse the longer this drags on.
Demand-side adaptation is ongoing: S. Korea has cut its Middle East crude dependence from 69% to 56% by pulling more from the Americas and Africa, and Japan is kicking off a second round of SPR releases from 1 May. But SPRs are finite.
Ref. to the negotiations, we should not bet on speed. The current Iranian leadership is dominated by genuine hardliners willing to absorb economic pain and run the clock to extract concessions. That is not a setup for a rapid resolution. US/Israeli media briefings keep framing the delay as ”internal Iranian divisions”, the reality is more complicated and points toward weeks and months, not days.
Our point is that the complexity is large, and higher prices have only just started (given a scenario where the negotiations drag out in time). The market spent April leaning on the USD 90/bl rest-of-year assumption; that case is diminishing by the hour. If ”early May reopening” is replaced by ”June, July or later” over the next week or two, both crude and products have meaningful room to reprice higher from here. There is a high risk being short energy and betting on any immediate political resolution(!).
Down on Friday. Up on Monday. The Brent June crude oil contract traded down 5.1% last week to a close of $90.38/b. It reached a high of $103.87/b last Monday and a low of $86.09/b on Friday as Iran announced that the Strait of Hormuz was fully open for transit. That quickly changed over the weekend as the US upheld its blockade of Iranian oil exports while Iran naturally responded by closing the SoH again. The US blew a hole in the engine room of the Iranian ship TOUSKA and took custody of the ship on Sunday. Brent crude is up 5.6% this morning to $95.4/b.
The cease-fire is expiring tomorrow. The US has said it will send a delegation for a second round of negotiations in Islamabad in Pakistan. But Iran has for now rejected a second round of talks as it views US demands as unrealistic and excessive while the US is also blocking the Strait of Hormuz.
While Brent is up 5% this morning, the financial market is still very optimistic that progress will be made. That talks will continue and that the SoH will fully open by the start of May which is consistent with a rest-of-year average Brent crude oil price of around $90/b with the market now trading that balance at around $88/b.
Financial optimism vs. physical deterioration. We have a divergence where the financial market is trading negotiations, improvements and resolution while at the same time the physical market is deteriorating day by day. Physical oil flows remain constrained by disrupted flows, longer voyage times and elevated freight and insurance costs.
Financial markets are betting that a US/Iranian resolution will save us in time from violent shortages down the road. But every day that the SoH remains closed is bringing us closer to a potentially very painful point of shortages and much higher prices.
The US blockade is also a weapon of leverage against its European and Asian allies. When Iran closed the SoH it held the world economy as a hostage against the US. The US blockade of the SoH is of course blocking Iranian oil exports. But it is also an action of disruption directed towards Europe and Asia. The US has called for the rest of the world to engaged in the war with Iran: ”If you want oil from the Persian Gulf, then go and get it”. A risk is that the US plays brinkmanship with the global oil market directed towards its European and Asian allies and maybe even towards China to force them to engage and take part. Maybe unthinkable. But unthinkable has become the norm with Trump in the White House.


Sommarväder skapar prisrally på elbörsen
Oil product price pain is set to rise as the Strait of Hormuz stays closed into summer

Solkraften pressar elpriserna dagtid

Michel Gubel ger sin syn på oljemarknaden