

Analys
SEB Jordbruksprodukter, 6 maj 2013

 USA var kallt och vått förra veckan, med frost och snö på många håll, ända nere i Texas. I torsdags fick norra Mellanvästern 35 cm snö. Höstvetets kondition försämrades i måndagens rapport från 35% ”good” och ”excellent condition” till 33% (redan innan förra veckans snö och frost). Sådden av majs ökade med bara 1% till veckan innan förra veckan, till rekordlåga 5%. Antagligen har väldigt lite blivit sått i veckan som gick. Det får vi facit på i kväll. Sojabönor har ännu inte kommit igång med sådden. Allt annat lika bör en allt för stor försening av majssådden leda till att sojabönor vinner areal.
 WASDE-rapporten kommer på fredag och nästa veckas brev kommer därför att innehålla en genomgång av den.
Den som vill lyssna på en tvåtimmars genomgång av WASDE-rapporten, och hur man analyserar marknaden samt placerar framgångsrikt i marknaden genom certifikat, är välkommen till ett seminarium hos SEB i Malmö.
Odlingsväder
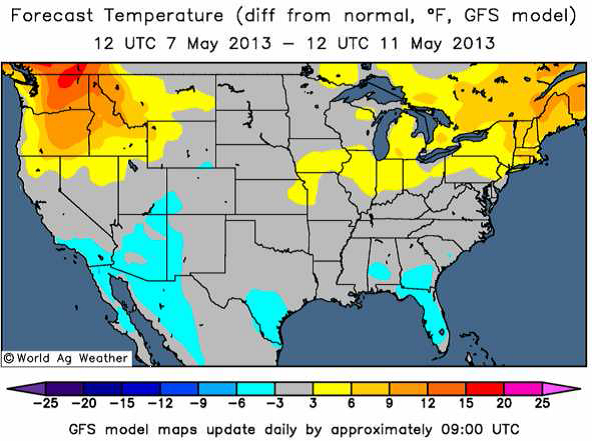
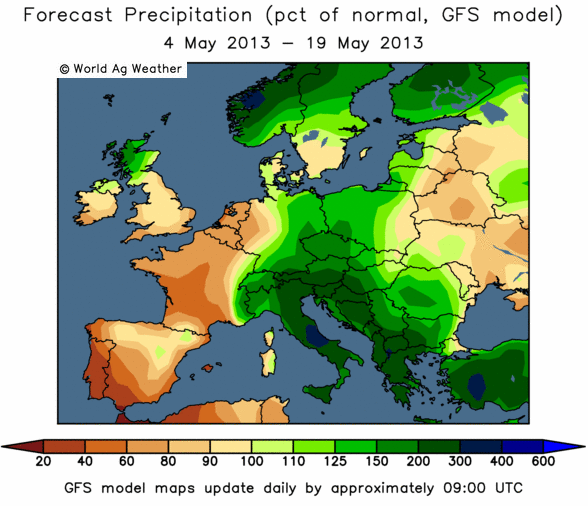
USA var kallt och vått med frost och snö ända nere i Texas. 35 cm snö föll i torsdags över norra Mellanvästern. Kanada var varmare och torrare. I Europa var det lite nederbörd i norr, men desto mer på den södra halvan av kontinenten. Australien var huvudsakligen fortsatt torrt.
Nedan ser vi prognostiserad avvikelse från normal temperatur i USA.
Nedan ser vi prognostiserad avvikelse från normal nederbörd i Europa.
World Ag Weather publicerar även avvikelser från det normala för regn och temperatur för viktiga jordbruksområden. De har till och med bemödat sig om att vikta avvikelsen efter jordbruksareal. Vi ser att större delen av jorden är kallare än normalt. Vissa delar av Argentina har fått väsentligt mycket mindre nederbörd än normalt och USA tvärtom mycket mer än normalt.
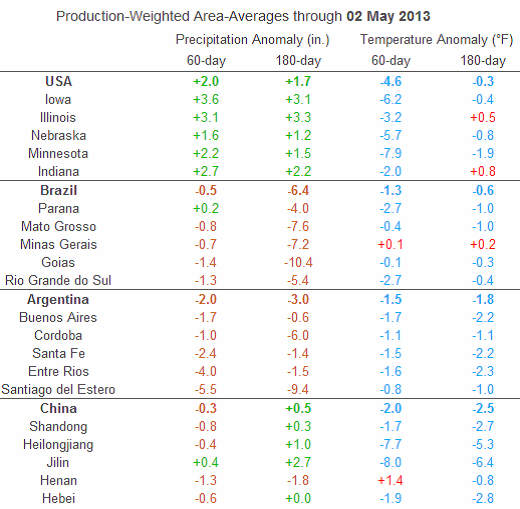
Vi noterar också att Kina är väsentligt mycket kallare än normalt. Eventuella negativa effekter av det på väntad skörd har än så länge inte blivit kända.
Vete
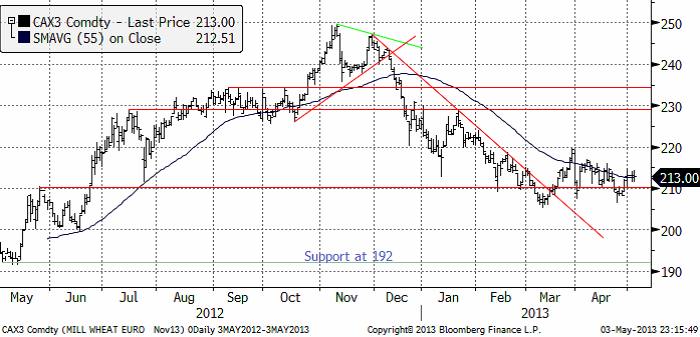
Priset på november (2013) har stabiliserat sig över 210 euro per ton. Trenden är alltjämt nedåtriktad, men den här sidledes rörelsen är ändå ett observandum. Det är möjligt att pristrenden nedåt håller på att förlora momentum och att en prisuppgång kan ta vid. Det beror helt på vädret. Möjligen kan WASDE-rapporten på fredag bli utslagsgivande.
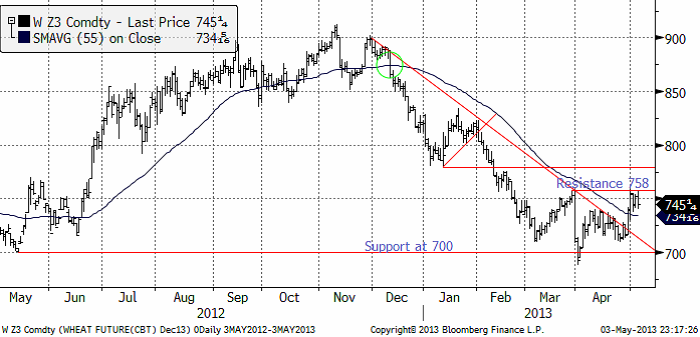
Decemberkontraktet på CBOT har stigit upp till motståndet på 758 cent per ton. Vi ser att det finns ytterligare ett motstånd på ca 780 cent, om 758 skulle brytas.
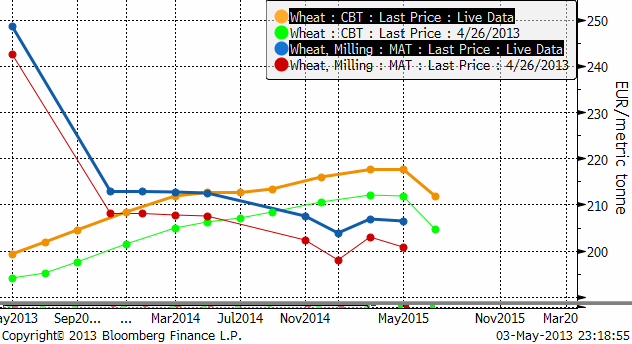
Ser vi på den senaste veckan förändring av terminskurvorna, ser vi att priserna gått upp både i Europa och i USA och ungefär lika mycket på alla löptider.
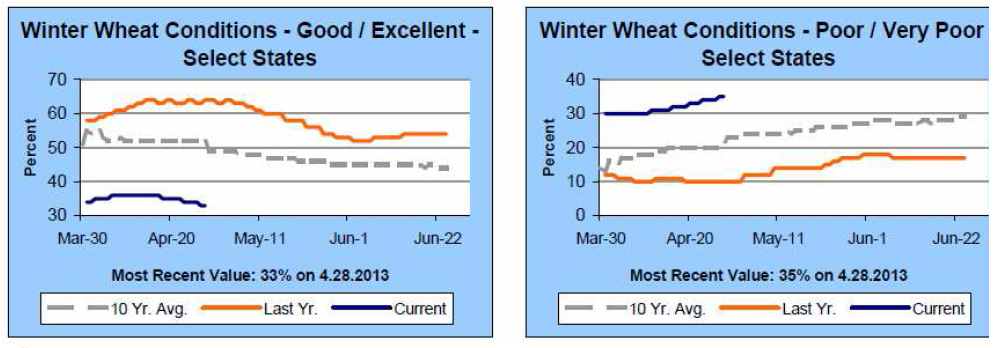
Nedan ser vi Crop condition från förra måndagens rapport.
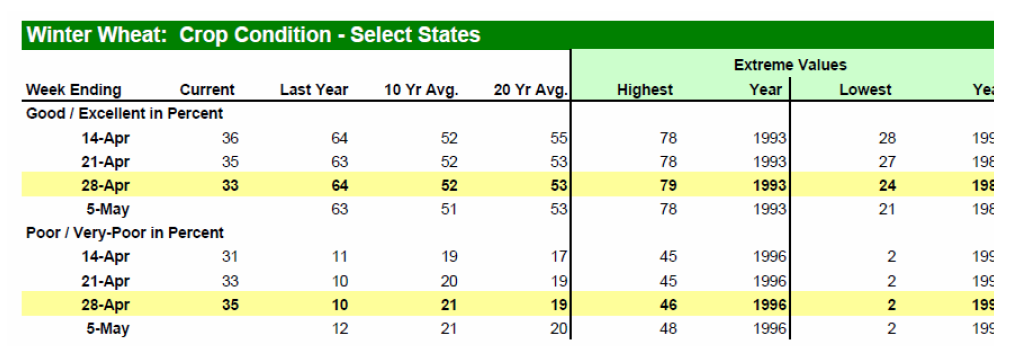
Måndagens Crop Progress rapport från USDA visar att tillståndet för det amerikanska höstvetet är fortsatt dystert. 35% klassas nu som ”poor/very poor”, en ökning med 2% från veckan innan och att jämföra med 10% vid samma tid förra året. Höstvete klassat som ”good/excellent” har minskat med samma mängd och uppgår nu till 33%, vilket är den lägsta nivån sedan 1996, medan förra årets siffra vid samma tid låg på 64%. Dessutom har endast 14% av höstvetet gått i ax, vilket är långt efter förra årets 55% vid samma tid. I Kansas, den största producenten av HRW vete, backade höstvete i kategorin ”good/excellent” med 3% till 27%.
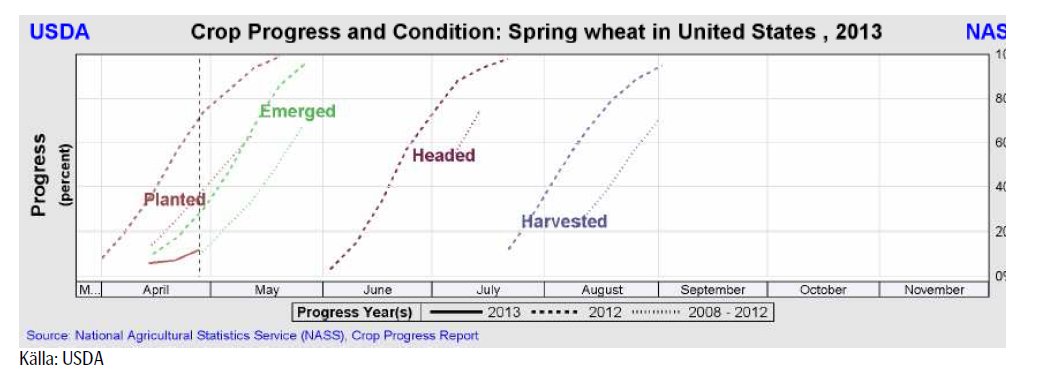
Det blöta och kalla vädret fortsätter också att försena de amerikanska lantbrukarnas sådd av vårvete. Endast 12% av sådden var avklarad per den 29 april, vilket är långt under det femåriga genomsnittet på 37%.
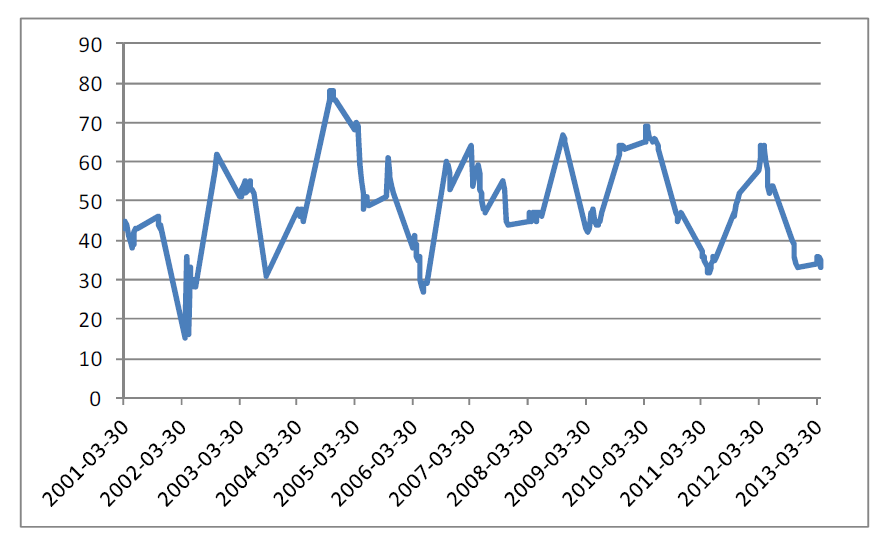
Crop condition för vintervetet i USA ligger kvar på den historiskt låga nivån, som vi ser i diagrammet nedan. Y-axeln visar hur många procent av arealen som har vete i ”good” eller ”excellent condition”.
The Kansas Crop Tour publicerade sin gissning på skörden; endast 313 mbu mot 383 mbu förra året.
Oklahoma Wheat Commission publicerade sitt estimat till 85 mbu mot 155 mbu förra året.
Vi fortsätter, med det observandum vi nämnt ovan, att tro på sidledes eller lägre priser. Uppgångar bör ses som tillfällen att sälja.
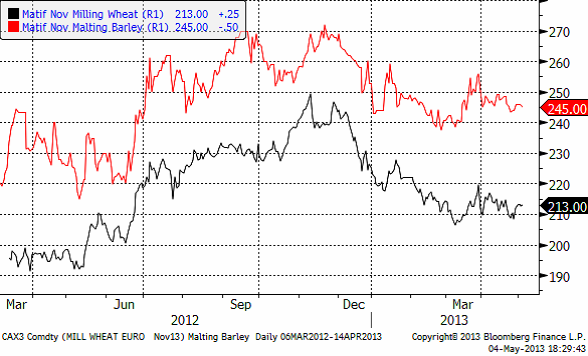
Maltkorn
Priset på maltkorn med leverans i november har ännu en vecka fortsatt att visa mer styrka än höstvetet / kvarnvetet på Matif.
Majs
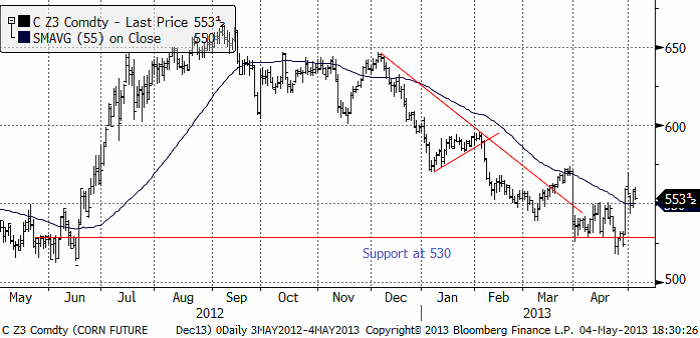
Majspriset (december 2013) steg kraftigt när vädret slog och om det visade sig att sådden blivit ytterligare försenad. Priset har åtminstone kortsiktigt etablerat sig över 550 cent. Det KAN bli en trendvändning uppåt. Det återstår att se.
Sådden ligger kraftigt efter i USA. Nedan ser vi såddens framåtskridande i USA. 6-årsintervallet sträcker sig från 2007 till 2012.
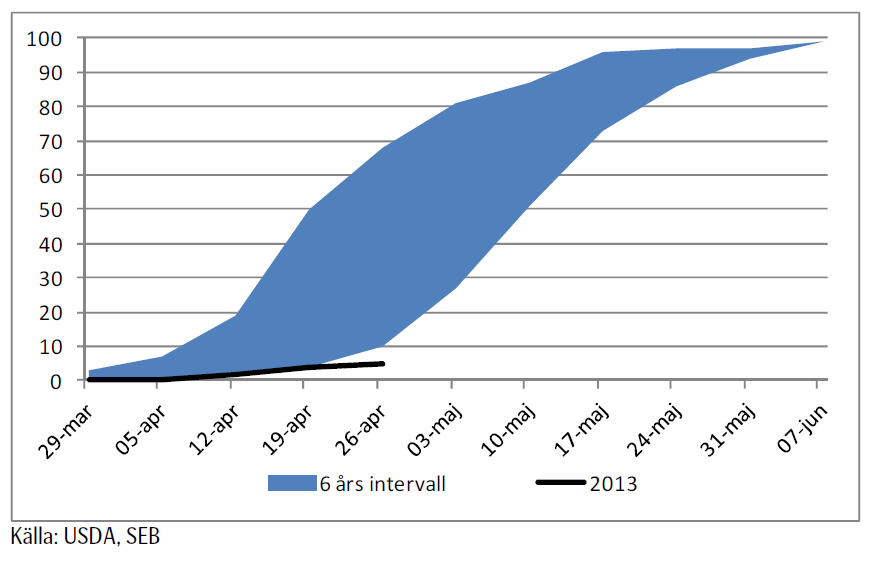
Medelvärdet för de sex åren 2006 – 2012 är 33% klart. Den långsammaste starten var 2008, när 10% var sått. Nu är det alltså bara 5%, en marginell ökning från 4% en vecka tidigare men fortfarande långt under förra årets 49% vid den här tiden och även under det genomsnittet. Iowa, den största producenten, har nu påbörjat sådden men endast 2% är avklarad så här långt – att jämföra med det femåriga genomsnittet på 36%. Sådden av majs i de två andra stora producentstaterna, Illinois och Indiana, står fortfarande och stampar på 1% då kraftiga regnskurar i kombination med kallare väder än normalt har gjort att många fält fortfarande är alltför blöta.
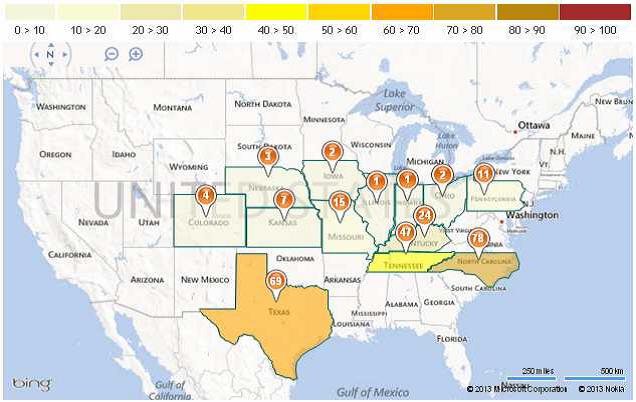
Nedan ser vi en karta över staterna i ”Corn belt”, färgkodade efter hur många procent som är sått och med procentsiffran på kartan.
Det sägs att den 10 maj är en slags deadline för sådden. Den majs som sås efter det datumet ger lägre avkastning. Farmdoc har emellertid skrivit att även om skörden blir 14% mindre än den skulle blivit enligt den hektarskörd som man räknat med, kommer majsen att räcka till efterfrågan. En av de efterfrågeposter som ökat de senaste åren är efterfrågan till etanol. Den kommer inte att öka i år, eftersom USA redan nått maximal inblandning i bensinen av etanol. Foderefterfrågan kommer också att vara tämligen konstant. Med 14% lägre skörd räcker majsen till efterfrågan och ger en viss ökning av utgående lager, enligt Farmdoc. Det finns alltså en hel del marginal i den väntade skördens storlek.
Sojabönor
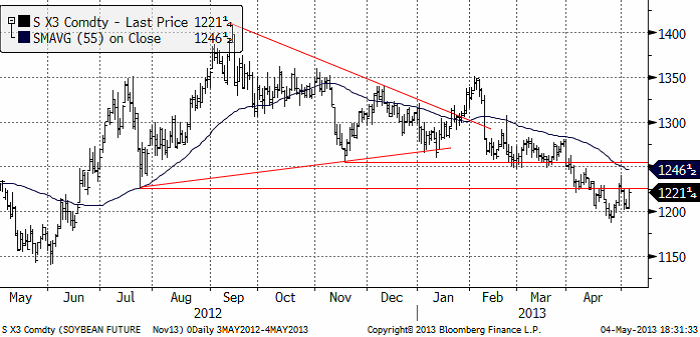
Sojabönorna (november 2013) anser jag befinner sig i negativ trend och vi ser en rekyl upp från 1200 cent. En rekyl är en naturlig och temporär fluktuation mot trenden.
Exporten från Brasilien börjar ta mer fart nu, efter de initiala problemen att få ut nästan 20 miljoner ton mer än förra året. Kinas tillväxt håller på att bromsa in. Nya svaga siffror kom i veckan. Den senaste köttskandalen där fårkött i egentligen kommit från flera andra djur. Det enda som stack ut med sin frånvaro av förklarliga skäl var hund. De här skandalerna och den allt jämt pågående nya fågelinfluensan gör att efterfrågan på soja borde vara dämpad framöver i Kina.
Man kan spekulera i att sojaarealen i USA borde bli större när den inte kan sås med majs. Arealen är antagligen inte utbytbar 1:1, inte minst pga behovet av utsäde. Marken är visserligen kvävegödslad sedan länge, men detta är en ”sunk cost” och även om det inte är till stor nytta för sojabönorna, så är det i vart fall inte till nackdel. Blir det fortsatt kallt drabbar vädret dock även sojaarealen.
Jag skulle passa på och sälja sojabönor på högre priser, eftersom trenden och fundamenta så väl pekar på lägre priser. Jag har svårt att se hur WASDE-rapporten kan bli positiv för marknaden
Raps
I flera veckor har vi noterat att rapspriset byggt upp fallhöjd i förhållande till det allt lägre sojabönspriset. I veckan som gick orkade inte rapsmarknaden hålla emot den kraften med fallande pris som följd. Den lilla nedgång som hittills ägt rum tror vi bara är början på en nedgång, som gör att priset på raps hamnar i paritet med sojapriset igen. Nedan ser vi november-terminens kursutveckling.
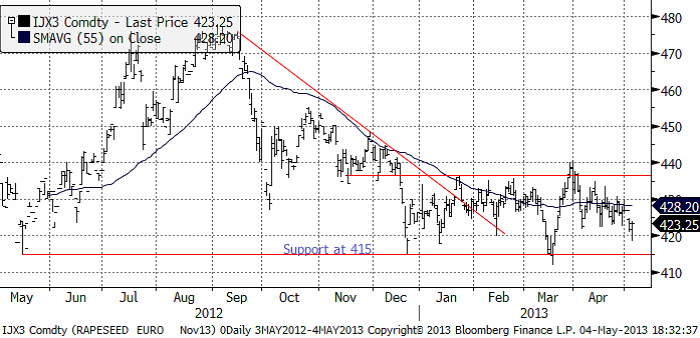
Skulle det tekniska stödet på 415 euro brytas, är detta en rejäl säljsignal. Om WASDE-rapporten är riktigt negativ för sojabönor skulle detta kunna inträffa. I mellantiden vill jag vara fortsatt såld raps.
[box]SEB Veckobrev Jordbruksprodukter är producerat av SEB Merchant Banking och publiceras i samarbete och med tillstånd på Råvarumarknaden.se[/box]
Disclaimer
The information in this document has been compiled by SEB Merchant Banking, a division within Skandinaviska Enskilda Banken AB (publ) (“SEB”).
Opinions contained in this report represent the bank’s present opinion only and are subject to change without notice. All information contained in this report has been compiled in good faith from sources believed to be reliable. However, no representation or warranty, expressed or implied, is made with respect to the completeness or accuracy of its contents and the information is not to be relied upon as authoritative. Anyone considering taking actions based upon the content of this document is urged to base his or her investment decisions upon such investigations as he or she deems necessary. This document is being provided as information only, and no specific actions are being solicited as a result of it; to the extent permitted by law, no liability whatsoever is accepted for any direct or consequential loss arising from use of this document or its contents.
About SEB
SEB is a public company incorporated in Stockholm, Sweden, with limited liability. It is a participant at major Nordic and other European Regulated Markets and Multilateral Trading Facilities (as well as some non-European equivalent markets) for trading in financial instruments, such as markets operated by NASDAQ OMX, NYSE Euronext, London Stock Exchange, Deutsche Börse, Swiss Exchanges, Turquoise and Chi-X. SEB is authorized and regulated by Finansinspektionen in Sweden; it is authorized and subject to limited regulation by the Financial Services Authority for the conduct of designated investment business in the UK, and is subject to the provisions of relevant regulators in all other jurisdictions where SEB conducts operations. SEB Merchant Banking. All rights reserved.

Market is starting to take US/Iran headlines with a pinch of salt. Brent crude rose $2.8/b yesterday to an official close of $112.1/b. But after that it traded as low as $108.05/b before ending late night at around $109.7/b. Through the day it traded in a range of $106.87 – 112.72/b amid a flurry of news or rumors from Iran and the US. ”US temporary sanctions during negotiations” (falls alarm). ”We will bomb Iran” (not anyhow),… etc. While the market is still fluctuating to this kind of news flow, it is starting to take such headlines with a pinch of salt.

We’ll see. Maybe, maybe not. The Brent M1 contract is trading at $110.2/b this morning which very close to the average ticks through yesterday of $110.4/b.
Trump with bearish, verbal intervention whenever Brent trades above $110/b it seems. What seems to be a pattern is that Trump states something like ”very good negotiations going on with Iran”, ”New leaders in Iran are great,..”, ”Great progress in negotiations,…”, ”Deal in sight,..” etc whenever the Brent M1 contract trades above $110/b. An effort to cool the market. These hot air verbal interventions from Trump used to have a heavy bearish impact on prices, but they now seems to have less and less effect unless they are backed by reality.
As far as we can see there has been no real progress in the negotiations between the US and Iran with both sides still standing by their previous demands.
Iran is getting stronger while the cease fire lasts making a return to war for Trump yet harder. Iran is naturally in constant preparation for a return to war given Trump’s steady threats of bombing Iran again. Iran is naturally doing what ever is possible to prepare for a return to war. And every day the cease fire lasts it is better prepared. This naturally makes it more and more difficult and dangerous for the US to return to warring activity versus Iran as the consequences for energy infrastructure in the Persian Gulf will be more and more severe the longer the cease fire lasts. Israel seems to see it this way as well. That the war is not won and that current frozen state of a cease fire gives Iran opportunity to rebuild military and politically.
Global inventories are drawing down day by day. How much? In the meantime the Strait of Hormuz stays closed. There is varying measures and estimates of how much global inventories are drawing down. Our rough estimate, back of the envelope, is that global inventories are drawing down by at least some 10 mb/d or about 300 mb/d in a balance between loss of supply versus demand destruction. Other estimates we see are a monthly draw of 250-270 mb/d. The IEA only ’measured’ a draw in global observable stocks of 117 mb in April with oil on water rising 53 mb while on shore stocks fell 170 mb. But global stocks are hard to measure with large invisible, unmeasured stocks. As such a back of the envelope approach may be better.
Oil products is what the world is consuming. Oil product prices likely to rise while product stocks fall. Strategic Petroleum Reserves (SPR) are predominantly crude oil. Discharging oil from OECD SPR stocks, a sharp reduction in Chinese crude imports and a reduction in global refinery throughput of 6-7 mb/d has helped to keep crude oil markets satisfactorily supplied. But global inventories are drawing down none the less. And oil products is really what the world is consuming. So if global refinery throughput stays subdued, then demand will eventually have to match the supply of oil products. The likely path forward this summer is a steady draw down in jet fuel, diesel and gasoline. Higher prices for these. Then, if possible, higher refinery throughput and higher usage of crude in response to very profitable refinery margins. And lastly sharper draw in crude stocks and higher prices for these. But some 6 mb/d of oil products used to be exported through the Strait of Hormuz. And it may not be so easy to ramp up refinery activity across the world to compensate. Especially as Ukraine continues to damage Russian refineries as well as Russian crude production and export facilities.
Watch oil product stocks and prices as well as Brent calendar 2027. What to watch for this summer is thus oil product inventories falling and oil product premiums to crude rising. Another measure to watch is the Brent crude 2027 contract as it rises steadily day by day as the Strait of Hormuz stays closed and global oil inventories decline. The latter is close to the highest level since the start of the war and keeps rising.
The Brent M1 contract and the Brent 2027 prices and current price of jet fuel in Europe (ARA). All in USD/b

Our back of the envelope calculation of the global shortage created by the closure of the Strait of Hormuz. Note that 3.5 mb/d of discharge from SPR is also a draw. Note also that ’Forced demand loss’ of 2.5 mb/d is probably temporary and will fall back towards zero as logistics are sorted out leaving ’Price demand loss’ to do the job of balancing the market. Thus a shortfall of at least 9 mb/d created by the closure. More if SPR discharge is included and more if Forced demand loss recedes.

Brent is climbing higher. Front-month is at USD 106.3/bl this morning, close to a weekly high and a USD 9/bl jump from Mondays open. This is the move we flagged as a risk earlier in the week: the market shifting from ”a deal is around the corner” to ”this is going to take longer than we thought”.

Analyst Commodities, SEB
During April, rest-of-year Brent remained remarkably stable around USD 90/bl. A stability which rested on one single assumption: the SoH reopens around 1 May. That assumption is now slowly falling apart.
As we highlighted yesterday: every week of delay beyond 1 May adds (theoretically) ish USD 5/bl to the rest-of-year average, as global inventories draw 100 million barrels per week. i.e., a mid-May reopening implies rest-of-year Brent closer to USD 100/bl, and anything pushing into June or July takes us meaningfully higher.
What’s changed in the last 48 hours:
#1: The US military has formally warned that clearing suspected sea mines from SoH could take up to six months. That is a completely different timescale from what the financial market is pricing. Even a political deal tomorrow does not immediately reopen the strait.
#2: Trump has shifted his tone from urgency to ”strategic patience”. In yesterday’s press conference: ”Don’t rush me… I want a great deal.” The market is reading this as a president no longer feeling pressured by timelines, with the naval blockade running in the background.
#3: So far, the military activity is escalating, not de-escalating. Axios reports Iran is laying more mines in SoH. The US 3rd carrier strike group (USS George H.W. Bush) is arriving with two countermine vessels. Trump yesterday ordered the US Navy to destroy any Iranian boats caught laying mines. While CNN reports that the Pentagon is actively drawing up plans to strike Iranian SoH capabilities and individual Iranian military leaders if the ceasefire collapses. i.e., NOT a attitude consistent with an imminent deal!
Spot crude and product prices eased off the early-April highs on a combination of system rerouting and deal optimism. Both now weakening. Goldman estimates April Gulf output is reduced by 14.5 mbl/d, or 57% of pre-war supply, a number that keeps getting worse the longer this drags on.
Demand-side adaptation is ongoing: S. Korea has cut its Middle East crude dependence from 69% to 56% by pulling more from the Americas and Africa, and Japan is kicking off a second round of SPR releases from 1 May. But SPRs are finite.
Ref. to the negotiations, we should not bet on speed. The current Iranian leadership is dominated by genuine hardliners willing to absorb economic pain and run the clock to extract concessions. That is not a setup for a rapid resolution. US/Israeli media briefings keep framing the delay as ”internal Iranian divisions”, the reality is more complicated and points toward weeks and months, not days.
Our point is that the complexity is large, and higher prices have only just started (given a scenario where the negotiations drag out in time). The market spent April leaning on the USD 90/bl rest-of-year assumption; that case is diminishing by the hour. If ”early May reopening” is replaced by ”June, July or later” over the next week or two, both crude and products have meaningful room to reprice higher from here. There is a high risk being short energy and betting on any immediate political resolution(!).
Down on Friday. Up on Monday. The Brent June crude oil contract traded down 5.1% last week to a close of $90.38/b. It reached a high of $103.87/b last Monday and a low of $86.09/b on Friday as Iran announced that the Strait of Hormuz was fully open for transit. That quickly changed over the weekend as the US upheld its blockade of Iranian oil exports while Iran naturally responded by closing the SoH again. The US blew a hole in the engine room of the Iranian ship TOUSKA and took custody of the ship on Sunday. Brent crude is up 5.6% this morning to $95.4/b.
The cease-fire is expiring tomorrow. The US has said it will send a delegation for a second round of negotiations in Islamabad in Pakistan. But Iran has for now rejected a second round of talks as it views US demands as unrealistic and excessive while the US is also blocking the Strait of Hormuz.
While Brent is up 5% this morning, the financial market is still very optimistic that progress will be made. That talks will continue and that the SoH will fully open by the start of May which is consistent with a rest-of-year average Brent crude oil price of around $90/b with the market now trading that balance at around $88/b.
Financial optimism vs. physical deterioration. We have a divergence where the financial market is trading negotiations, improvements and resolution while at the same time the physical market is deteriorating day by day. Physical oil flows remain constrained by disrupted flows, longer voyage times and elevated freight and insurance costs.
Financial markets are betting that a US/Iranian resolution will save us in time from violent shortages down the road. But every day that the SoH remains closed is bringing us closer to a potentially very painful point of shortages and much higher prices.
The US blockade is also a weapon of leverage against its European and Asian allies. When Iran closed the SoH it held the world economy as a hostage against the US. The US blockade of the SoH is of course blocking Iranian oil exports. But it is also an action of disruption directed towards Europe and Asia. The US has called for the rest of the world to engaged in the war with Iran: ”If you want oil from the Persian Gulf, then go and get it”. A risk is that the US plays brinkmanship with the global oil market directed towards its European and Asian allies and maybe even towards China to force them to engage and take part. Maybe unthinkable. But unthinkable has become the norm with Trump in the White House.


Sommarväder skapar prisrally på elbörsen
Oil product price pain is set to rise as the Strait of Hormuz stays closed into summer

Solkraften pressar elpriserna dagtid

Michel Gubel ger sin syn på oljemarknaden