

Analys
SEB Jordbruksprodukter, 6 maj 2013

 USA var kallt och vått förra veckan, med frost och snö på många håll, ända nere i Texas. I torsdags fick norra Mellanvästern 35 cm snö. Höstvetets kondition försämrades i måndagens rapport från 35% ”good” och ”excellent condition” till 33% (redan innan förra veckans snö och frost). Sådden av majs ökade med bara 1% till veckan innan förra veckan, till rekordlåga 5%. Antagligen har väldigt lite blivit sått i veckan som gick. Det får vi facit på i kväll. Sojabönor har ännu inte kommit igång med sådden. Allt annat lika bör en allt för stor försening av majssådden leda till att sojabönor vinner areal.
 WASDE-rapporten kommer på fredag och nästa veckas brev kommer därför att innehålla en genomgång av den.
Den som vill lyssna på en tvåtimmars genomgång av WASDE-rapporten, och hur man analyserar marknaden samt placerar framgångsrikt i marknaden genom certifikat, är välkommen till ett seminarium hos SEB i Malmö.
Odlingsväder
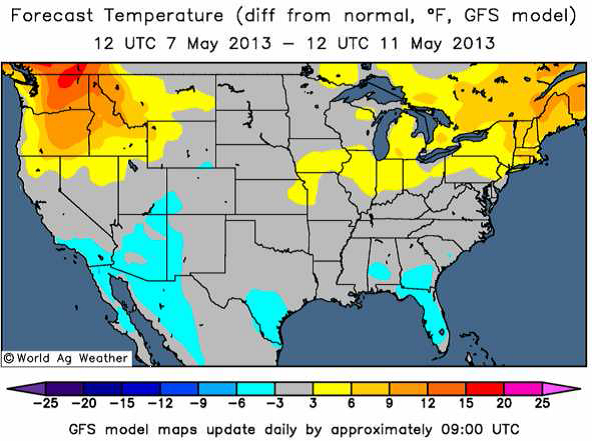
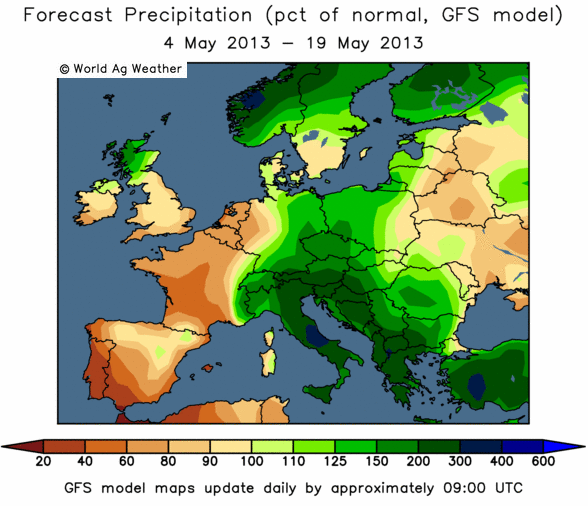
USA var kallt och vått med frost och snö ända nere i Texas. 35 cm snö föll i torsdags över norra Mellanvästern. Kanada var varmare och torrare. I Europa var det lite nederbörd i norr, men desto mer på den södra halvan av kontinenten. Australien var huvudsakligen fortsatt torrt.
Nedan ser vi prognostiserad avvikelse från normal temperatur i USA.
Nedan ser vi prognostiserad avvikelse från normal nederbörd i Europa.
World Ag Weather publicerar även avvikelser från det normala för regn och temperatur för viktiga jordbruksområden. De har till och med bemödat sig om att vikta avvikelsen efter jordbruksareal. Vi ser att större delen av jorden är kallare än normalt. Vissa delar av Argentina har fått väsentligt mycket mindre nederbörd än normalt och USA tvärtom mycket mer än normalt.
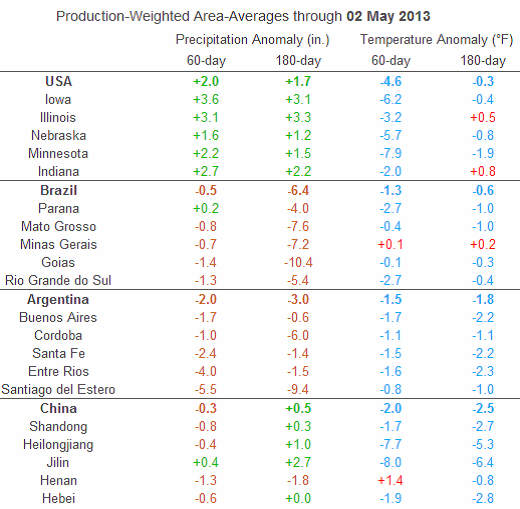
Vi noterar också att Kina är väsentligt mycket kallare än normalt. Eventuella negativa effekter av det på väntad skörd har än så länge inte blivit kända.
Vete
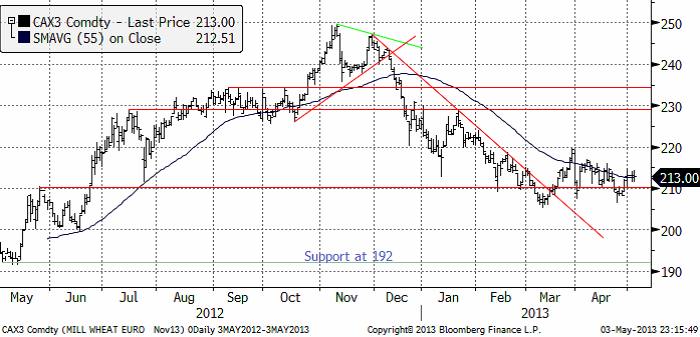
Priset på november (2013) har stabiliserat sig över 210 euro per ton. Trenden är alltjämt nedåtriktad, men den här sidledes rörelsen är ändå ett observandum. Det är möjligt att pristrenden nedåt håller på att förlora momentum och att en prisuppgång kan ta vid. Det beror helt på vädret. Möjligen kan WASDE-rapporten på fredag bli utslagsgivande.
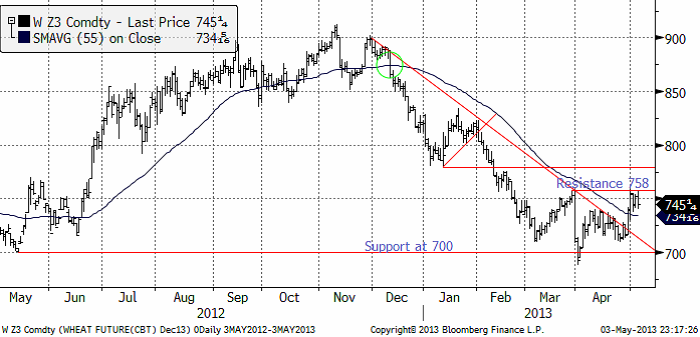
Decemberkontraktet på CBOT har stigit upp till motståndet på 758 cent per ton. Vi ser att det finns ytterligare ett motstånd på ca 780 cent, om 758 skulle brytas.
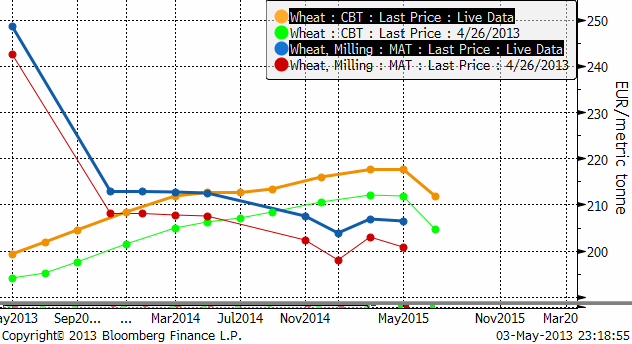
Ser vi på den senaste veckan förändring av terminskurvorna, ser vi att priserna gått upp både i Europa och i USA och ungefär lika mycket på alla löptider.
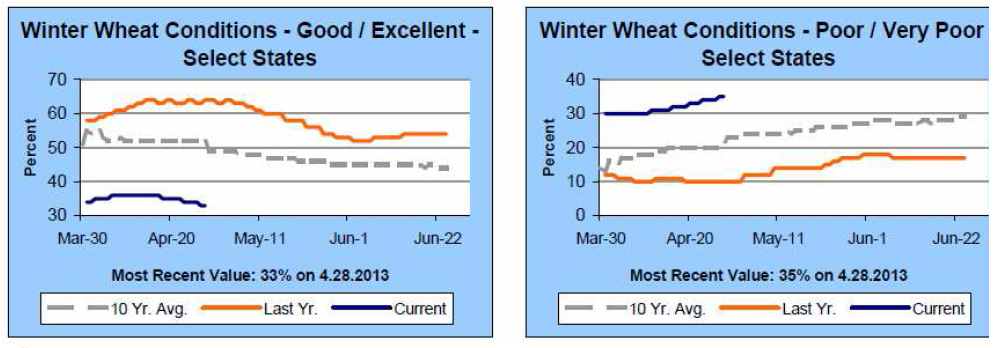
Nedan ser vi Crop condition från förra måndagens rapport.
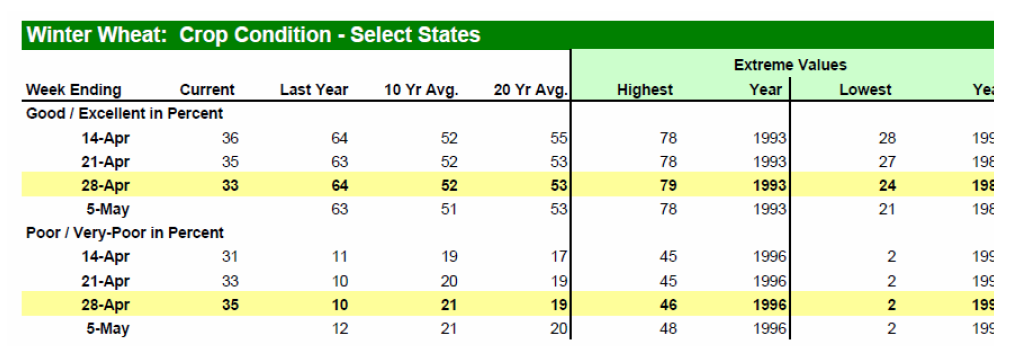
Måndagens Crop Progress rapport från USDA visar att tillståndet för det amerikanska höstvetet är fortsatt dystert. 35% klassas nu som ”poor/very poor”, en ökning med 2% från veckan innan och att jämföra med 10% vid samma tid förra året. Höstvete klassat som ”good/excellent” har minskat med samma mängd och uppgår nu till 33%, vilket är den lägsta nivån sedan 1996, medan förra årets siffra vid samma tid låg på 64%. Dessutom har endast 14% av höstvetet gått i ax, vilket är långt efter förra årets 55% vid samma tid. I Kansas, den största producenten av HRW vete, backade höstvete i kategorin ”good/excellent” med 3% till 27%.
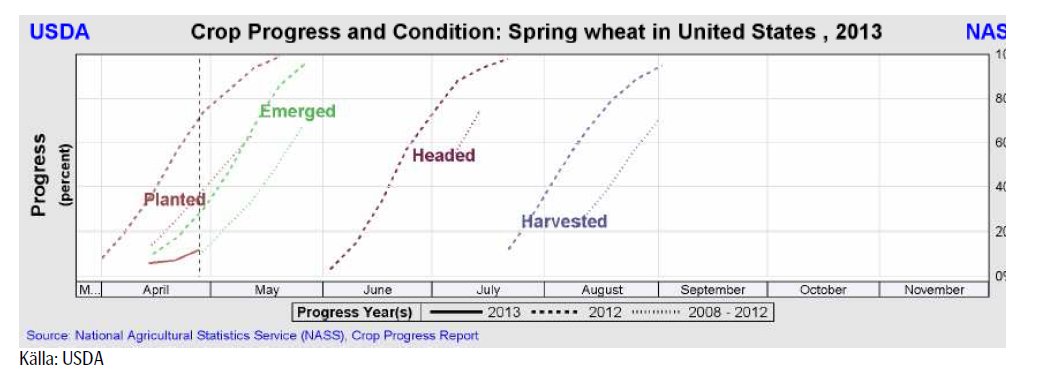
Det blöta och kalla vädret fortsätter också att försena de amerikanska lantbrukarnas sådd av vårvete. Endast 12% av sådden var avklarad per den 29 april, vilket är långt under det femåriga genomsnittet på 37%.
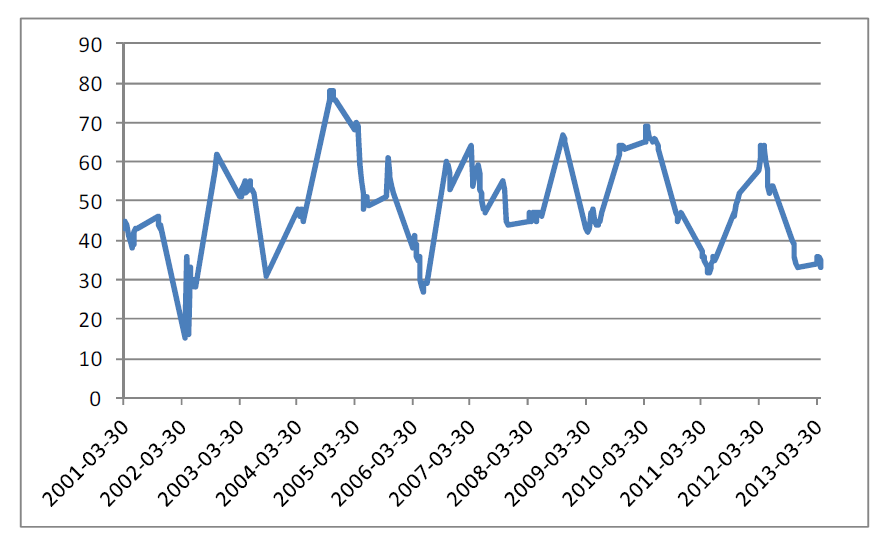
Crop condition för vintervetet i USA ligger kvar på den historiskt låga nivån, som vi ser i diagrammet nedan. Y-axeln visar hur många procent av arealen som har vete i ”good” eller ”excellent condition”.
The Kansas Crop Tour publicerade sin gissning på skörden; endast 313 mbu mot 383 mbu förra året.
Oklahoma Wheat Commission publicerade sitt estimat till 85 mbu mot 155 mbu förra året.
Vi fortsätter, med det observandum vi nämnt ovan, att tro på sidledes eller lägre priser. Uppgångar bör ses som tillfällen att sälja.
Maltkorn
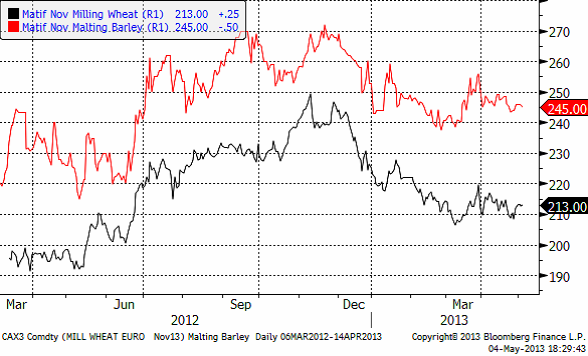
Priset på maltkorn med leverans i november har ännu en vecka fortsatt att visa mer styrka än höstvetet / kvarnvetet på Matif.
Majs
Majspriset (december 2013) steg kraftigt när vädret slog och om det visade sig att sådden blivit ytterligare försenad. Priset har åtminstone kortsiktigt etablerat sig över 550 cent. Det KAN bli en trendvändning uppåt. Det återstår att se.
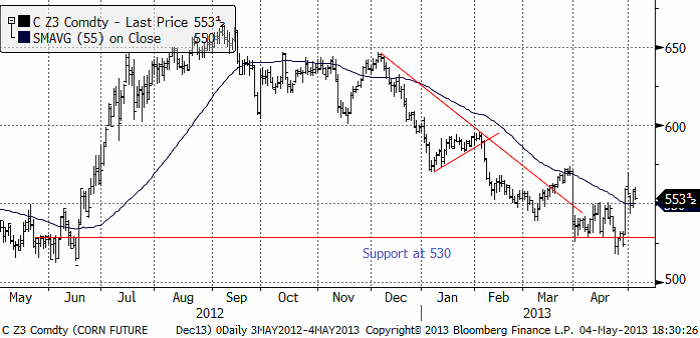
Sådden ligger kraftigt efter i USA. Nedan ser vi såddens framåtskridande i USA. 6-årsintervallet sträcker sig från 2007 till 2012.
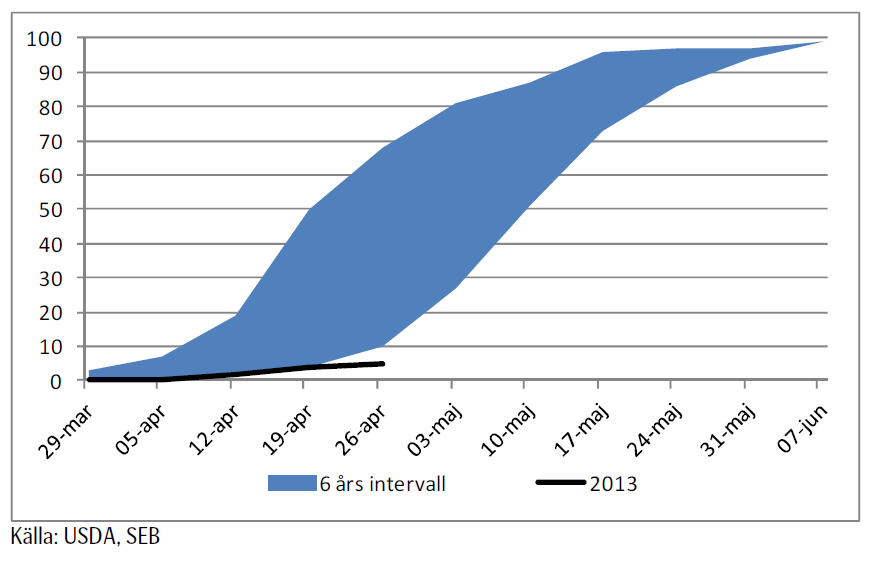
Medelvärdet för de sex åren 2006 – 2012 är 33% klart. Den långsammaste starten var 2008, när 10% var sått. Nu är det alltså bara 5%, en marginell ökning från 4% en vecka tidigare men fortfarande långt under förra årets 49% vid den här tiden och även under det genomsnittet. Iowa, den största producenten, har nu påbörjat sådden men endast 2% är avklarad så här långt – att jämföra med det femåriga genomsnittet på 36%. Sådden av majs i de två andra stora producentstaterna, Illinois och Indiana, står fortfarande och stampar på 1% då kraftiga regnskurar i kombination med kallare väder än normalt har gjort att många fält fortfarande är alltför blöta.
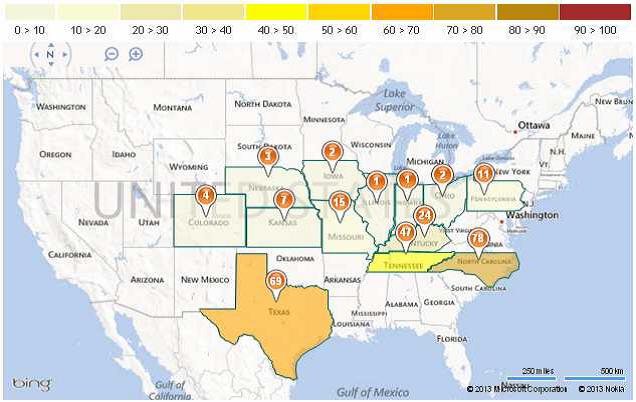
Nedan ser vi en karta över staterna i ”Corn belt”, färgkodade efter hur många procent som är sått och med procentsiffran på kartan.
Det sägs att den 10 maj är en slags deadline för sådden. Den majs som sås efter det datumet ger lägre avkastning. Farmdoc har emellertid skrivit att även om skörden blir 14% mindre än den skulle blivit enligt den hektarskörd som man räknat med, kommer majsen att räcka till efterfrågan. En av de efterfrågeposter som ökat de senaste åren är efterfrågan till etanol. Den kommer inte att öka i år, eftersom USA redan nått maximal inblandning i bensinen av etanol. Foderefterfrågan kommer också att vara tämligen konstant. Med 14% lägre skörd räcker majsen till efterfrågan och ger en viss ökning av utgående lager, enligt Farmdoc. Det finns alltså en hel del marginal i den väntade skördens storlek.
Sojabönor
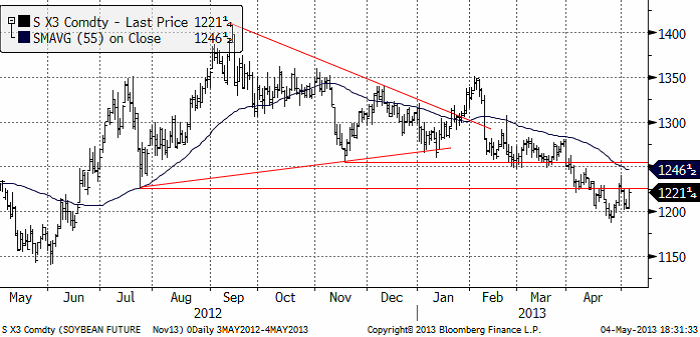
Sojabönorna (november 2013) anser jag befinner sig i negativ trend och vi ser en rekyl upp från 1200 cent. En rekyl är en naturlig och temporär fluktuation mot trenden.
Exporten från Brasilien börjar ta mer fart nu, efter de initiala problemen att få ut nästan 20 miljoner ton mer än förra året. Kinas tillväxt håller på att bromsa in. Nya svaga siffror kom i veckan. Den senaste köttskandalen där fårkött i egentligen kommit från flera andra djur. Det enda som stack ut med sin frånvaro av förklarliga skäl var hund. De här skandalerna och den allt jämt pågående nya fågelinfluensan gör att efterfrågan på soja borde vara dämpad framöver i Kina.
Man kan spekulera i att sojaarealen i USA borde bli större när den inte kan sås med majs. Arealen är antagligen inte utbytbar 1:1, inte minst pga behovet av utsäde. Marken är visserligen kvävegödslad sedan länge, men detta är en ”sunk cost” och även om det inte är till stor nytta för sojabönorna, så är det i vart fall inte till nackdel. Blir det fortsatt kallt drabbar vädret dock även sojaarealen.
Jag skulle passa på och sälja sojabönor på högre priser, eftersom trenden och fundamenta så väl pekar på lägre priser. Jag har svårt att se hur WASDE-rapporten kan bli positiv för marknaden
Raps
I flera veckor har vi noterat att rapspriset byggt upp fallhöjd i förhållande till det allt lägre sojabönspriset. I veckan som gick orkade inte rapsmarknaden hålla emot den kraften med fallande pris som följd. Den lilla nedgång som hittills ägt rum tror vi bara är början på en nedgång, som gör att priset på raps hamnar i paritet med sojapriset igen. Nedan ser vi november-terminens kursutveckling.
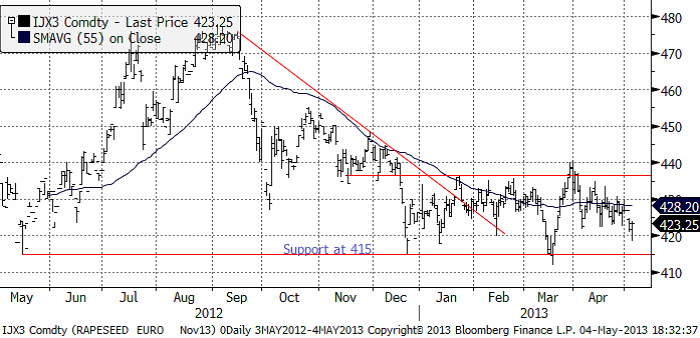
Skulle det tekniska stödet på 415 euro brytas, är detta en rejäl säljsignal. Om WASDE-rapporten är riktigt negativ för sojabönor skulle detta kunna inträffa. I mellantiden vill jag vara fortsatt såld raps.
[box]SEB Veckobrev Jordbruksprodukter är producerat av SEB Merchant Banking och publiceras i samarbete och med tillstånd på Råvarumarknaden.se[/box]
Disclaimer
The information in this document has been compiled by SEB Merchant Banking, a division within Skandinaviska Enskilda Banken AB (publ) (“SEB”).
Opinions contained in this report represent the bank’s present opinion only and are subject to change without notice. All information contained in this report has been compiled in good faith from sources believed to be reliable. However, no representation or warranty, expressed or implied, is made with respect to the completeness or accuracy of its contents and the information is not to be relied upon as authoritative. Anyone considering taking actions based upon the content of this document is urged to base his or her investment decisions upon such investigations as he or she deems necessary. This document is being provided as information only, and no specific actions are being solicited as a result of it; to the extent permitted by law, no liability whatsoever is accepted for any direct or consequential loss arising from use of this document or its contents.
About SEB
SEB is a public company incorporated in Stockholm, Sweden, with limited liability. It is a participant at major Nordic and other European Regulated Markets and Multilateral Trading Facilities (as well as some non-European equivalent markets) for trading in financial instruments, such as markets operated by NASDAQ OMX, NYSE Euronext, London Stock Exchange, Deutsche Börse, Swiss Exchanges, Turquoise and Chi-X. SEB is authorized and regulated by Finansinspektionen in Sweden; it is authorized and subject to limited regulation by the Financial Services Authority for the conduct of designated investment business in the UK, and is subject to the provisions of relevant regulators in all other jurisdictions where SEB conducts operations. SEB Merchant Banking. All rights reserved.

Some rebound but not much. Brent crude rebounded 1.5% yesterday to $65.47/b. This morning it is inching 0.2% up to $65.6/b. The lowest close last week was on Thursday at $64.11/b.

The curve structure is almost as week as it was before the weekend. The rebound we now have gotten post the message from OPEC+ over the weekend is to a large degree a rebound along the curve rather than much strengthening at the front-end of the curve. That part of the curve structure is almost as weak as it was last Thursday.
We are still on a weakening path. The message from OPEC+ over the weekend was we are still on a weakening path with rising supply from the group. It is just not as rapidly weakening as was feared ahead of the weekend when a quota hike of 500 kb/d/mth for November was discussed.
The Brent curve is on its way to full contango with Brent dipping into the $50ies/b. Thus the ongoing weakening we have had in the crude curve since the start of the year, and especially since early June, will continue until the Brent crude oil forward curve is in full contango along with visibly rising US and OECD oil inventories. The front-month Brent contract will then flip down towards the $60/b-line and below into the $50ies/b.
At what point will OPEC+ turn to cuts? The big question then becomes: When will OPEC+ turn around to make some cuts? At what (price) point will they choose to stabilize the market? Because for sure they will. Higher oil inventories, some more shedding of drilling rigs in US shale and Brent into the 50ies somewhere is probably where the group will step in.
There is nothing we have seen from the group so far which indicates that they will close their eyes, let the world drown in oil and the oil price crash to $40/b or below.
The message from OPEC+ is also about balance and stability. The world won’t drown in oil in 2026. The message from the group as far as we manage to interpret it is twofold: 1) Taking back market share which requires a lower price for non-OPEC+ to back off a bit, and 2) Oil market stability and balance. It is not just about 1. Thus fretting about how we are all going to drown in oil in 2026 is totally off the mark by just focusing on point 1.
When to buy cal 2026? Before Christmas when Brent hits $55/b and before OPEC+ holds its last meeting of the year which is likely to be in early December.
Brent crude oil prices have rebounded a bit along the forward curve. Not much strengthening in the structure of the curve. The front-end backwardation is not much stronger today than on its weakest level so far this year which was on Thursday last week.

The front-end backwardation fell to its weakest level so far this year on Thursday last week. A slight pickup yesterday and today, but still very close to the weakest year to date. More oil from OPEC+ in the coming months and softer demand and rising inventories. We are heading for yet softer levels.

Down to the lowest since early May. Brent crude has fallen sharply the latest four days. It closed at USD 64.11/b yesterday which is the lowest since early May. It is staging a 1.3% rebound this morning along with gains in both equities and industrial metals with an added touch of support from a softer USD on top.
What stands out the most to us this week is the collapse in the Dubai one to three months time-spread.
Dubai is medium sour crude. OPEC+ is in general medium sour crude production. Asian refineries are predominantly designed to process medium sour crude. So Dubai is the real measure of the balance between OPEC+ holding back or not versus Asian oil demand for consumption and stock building.
A sharp weakening of the front-end of the Dubai curve. The front-end of the Dubai crude curve has been holding out very solidly throughout this summer while the front-end of the Brent and WTI curves have been steadily softening. But the strength in the Dubai curve in our view was carrying the crude oil market in general. A source of strength in the crude oil market. The core of the strength.
The now finally sharp decline of the front-end of the Dubai crude curve is thus a strong shift. Weakness in the Dubai crude marker is weakness in the core of the oil market. The core which has helped to hold the oil market elevated.
Facts supports the weakening. Add in facts of Iraq lifting production from Kurdistan through Turkey. Saudi Arabia lifting production to 10 mb/d in September (normal production level) and lifting exports as well as domestic demand for oil for power for air con is fading along with summer heat. Add also in counter seasonal rise in US crude and product stocks last week. US oil stocks usually decline by 1.3 mb/week this time of year. Last week they instead rose 6.4 mb/week (+7.2 mb if including SPR). Total US commercial oil stocks are now only 2.1 mb below the 2015-19 seasonal average. US oil stocks normally decline from now to Christmas. If they instead continue to rise, then it will be strongly counter seasonal rise and will create a very strong bearish pressure on oil prices.
Will OPEC+ lift its voluntary quotas by zero, 137 kb/d, 500 kb/d or 1.5 mb/d? On Sunday of course OPEC+ will decide on how much to unwind of the remaining 1.5 mb/d of voluntary quotas for November. Will it be 137 kb/d yet again as for October? Will it be 500 kb/d as was talked about earlier this week? Or will it be a full unwind in one go of 1.5 mb/d? We think most likely now it will be at least 500 kb/d and possibly a full unwind. We discussed this in a not earlier this week: ”500 kb/d of voluntary quotas in October. But a full unwind of 1.5 mb/d”
The strength in the front-end of the Dubai curve held out through summer while Brent and WTI curve structures weakened steadily. That core strength helped to keep flat crude oil prices elevated close to the 70-line. Now also the Dubai curve has given in.

Brent crude oil forward curves

Total US commercial stocks now close to normal. Counter seasonal rise last week. Rest of year?

Total US crude and product stocks on a steady trend higher.

Analys
OPEC+ will likely unwind 500 kb/d of voluntary quotas in October. But a full unwind of 1.5 mb/d in one go could be in the cards
Down to mid-60ies as Iraq lifts production while Saudi may be tired of voluntary cut frugality. The Brent December contract dropped 1.6% yesterday to USD 66.03/b. This morning it is down another 0.3% to USD 65.8/b. The drop in the price came on the back of the combined news that Iraq has resumed 190 kb/d of production in Kurdistan with exports through Turkey while OPEC+ delegates send signals that the group will unwind the remaining 1.65 mb/d (less the 137 kb/d in October) of voluntary cuts at a pace of 500 kb/d per month pace.
Signals of accelerated unwind and Iraqi increase may be connected. Russia, Kazakhstan and Iraq were main offenders versus the voluntary quotas they had agreed to follow. Russia had a production ’debt’ (cumulative overproduction versus quota) of close to 90 mb in March this year while Kazakhstan had a ’debt’ of about 60 mb and the same for Iraq. This apparently made Saudi Arabia angry this spring. Why should Saudi Arabia hold back if the other voluntary cutters were just freeriding? Thus the sudden rapid unwinding of voluntary cuts. That is at least one angle of explanations for the accelerated unwinding.
If the offenders with production debts then refrained from lifting production as the voluntary cuts were rapidly unwinded, then they could ’pay back’ their ’debts’ as they would under-produce versus the new and steadily higher quotas.
Forget about Kazakhstan. Its production was just too far above the quotas with no hope that the country would hold back production due to cross-ownership of oil assets by international oil companies. But Russia and Iraq should be able to do it.
Iraqi cumulative overproduction versus quotas could reach 85-90 mb in October. Iraq has however steadily continued to overproduce by 3-5 mb per month. In July its new and gradually higher quota came close to equal with a cumulative overproduction of only 0.6 mb that month. In August again however its production had an overshoot of 100 kb/d or 3.1 mb for the month. Its cumulative production debt had then risen to close to 80 mb. We don’t know for September yet. But looking at October we now know that its production will likely average close to 4.5 mb/d due to the revival of 190 kb/d of production in Kurdistan. Its quota however will only be 4.24 mb/d. Its overproduction in October will thus likely be around 250 kb/d above its quota with its production debt rising another 7-8 mb to a total of close to 90 mb.
Again, why should Saudi Arabia be frugal while Iraq is freeriding. Better to get rid of the voluntary quotas as quickly as possible and then start all over with clean sheets.
Unwinding the remaining 1.513 mb/d in one go in October? If OPEC+ unwinds the remaining 1.513 mb/d of voluntary cuts in one big go in October, then Iraq’s quota will be around 4.4 mb/d for October versus its likely production of close to 4.5 mb/d for the coming month..
OPEC+ should thus unwind the remaining 1.513 mb/d (1.65 – 0.137 mb/d) in one go for October in order for the quota of Iraq to be able to keep track with Iraq’s actual production increase.
October 5 will show how it plays out. But a quota unwind of at least 500 kb/d for Oct seems likely. An overall increase of at least 500 kb/d in the voluntary quota for October looks likely. But it could be the whole 1.513 mb/d in one go. If the increase in the quota is ’only’ 500 kb/d then Iraqi cumulative production will still rise by 5.7 mb to a total of 85 mb in October.
Iraqi production debt versus quotas will likely rise by 5.7 mb in October if OPEC+ only lifts the overall quota by 500 kb/d in October. Here assuming historical production debt did not rise in September. That Iraq lifts its production by 190 kb/d in October to 4.47 mb/d (August level + 190 kb/d) and that OPEC+ unwinds 500 kb/d of the remining quotas in October when they decide on this on 5 October.


Silver spränger den magiska gränsen, kostar nu över 50 USD per uns

Blykalla, Evroc och Studsvik vill bygga kärnkraftsdrivna datacenter i Sverige

Toppmöte om framtidens kärnkraft runt Östersjön hölls idag

Nytt prisrekord, guld stiger över 4000 USD

Goldman Sachs höjer prognosen för guld, tror priset når 4900 USD

Mahvie Minerals i en guldtrend
Volatile but going nowhere. Brent crude circles USD 66 as market weighs surplus vs risk

Aktier i guldbolag laggar priset på guld

Kinas elproduktion slog nytt rekord i augusti, vilket även kolkraft gjorde

Tyskland har så höga elpriser att företag inte har råd att använda elektricitet
-
 Nyheter4 veckor sedan
Mahvie Minerals i en guldtrend
-
Analys4 veckor sedan
Volatile but going nowhere. Brent crude circles USD 66 as market weighs surplus vs risk
-
 Nyheter4 veckor sedan
Aktier i guldbolag laggar priset på guld
-
 Nyheter4 veckor sedan
Kinas elproduktion slog nytt rekord i augusti, vilket även kolkraft gjorde
-
Nyheter3 veckor sedan
Tyskland har så höga elpriser att företag inte har råd att använda elektricitet
-

 Nyheter4 veckor sedan
Guld når sin högsta nivå någonsin, nu även justerat för inflation
-

 Nyheter4 veckor sedan
Det stigande guldpriset en utmaning för smyckesköpare
-
Analys4 veckor sedan
Waiting for the surplus while we worry about Israel and Qatar