

Analys
SEB Jordbruksprodukter, 4 november 2013


 Det var en generellt lite svagare vecka för jordbruksprodukter förra veckan. De skiljde inte ut sig från resten av råvarumarknaden, som generellt sett utvecklades svagt. Bland jordbruksprodukterna märktes särskilt stora prisfall för sojamjöl och smör. Dollarn steg och euron föll och det ganska mycket, 3%. Naturligtvis förklarar detta till stor del prisnedgångarna på de amerikanska terminsmarknaderna. Chicagovetet gick ner (i dollar räknat), men Matifvetet steg. Den svenska kronan följde i princip eurons rörelser mot dollarn. Förklaringen till valutakursförändringen var dels starkare inköpschefsindex i USA, som signalerar en snabb konjunkturåterhämtning, och en rapport om närmast deflation i Eurozonen. Förväntningar om att ECB ska sänka styrräntan i Eurozonen tändes omedelbart, vilket fick euron att falla.
Vi tror att prisuppgången i euro / svenska kronor – termer fortsätter för vete. För raps går vi tillbaka till neutral rekommendation från en (försiktig) köprekommendation för två veckor sedan. I övrigt gör vi inte heller några förändringar av rekommendationerna.
På fredag klockan 18 publicerar USDA sin första WASDE-rapport på två månader. Förra månadens frös inne på grund av budgetbråket i USA.
Odlingsväder
Väderprognoser för USA indikerar gynnsamt väder för sådden och utvecklingen av det amerikanska höstvetet. Det finns en del analytiker som redan nu säger att höstvetet kommer att vara i det bästa tillståndet sedan 2010 när det går in i vintervila.
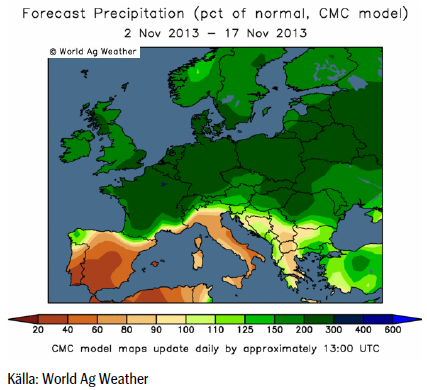
Europa har som bekant varit ovanligt regnigt. Prognosen fram till mitten av månaden visar att detta väntas fortsätta med väsentligt mycket mer regn än normalt över norra Kontinentaleuropa. Södra Europa väntas däremot vara torrare än normalt.
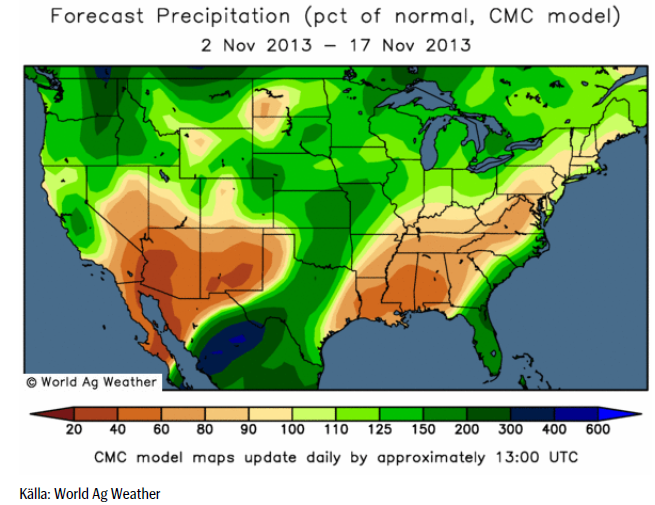
Även i USA väntas det vara mer nederbörd än normalt, utom i områden som normalt är torra, som t ex New Mexico och Arizona.
Vete
November 2014 fann stöd i veckan och ser ut att vara på väg mot ett nytt test av 200 euro. Prisutvecklingen på Matif stöds av den svagare valutan. ECB väntas sänka sin viktigaste styrränta den kommande veckan. Inflationen i Eurozonen lyser med sin frånvaro och ekonomin är i behov av monetär stimulans.
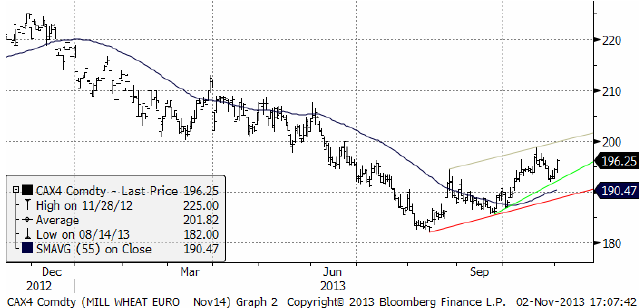
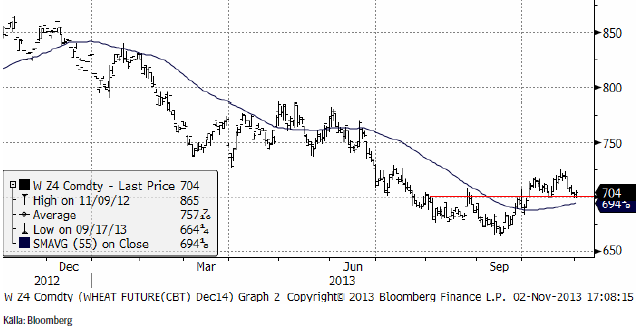
Decemberkontraktet 2014 på CBOT visar inte samma bild, därför att dollarn stärktes på eurons bekostnad. Priset i fredags stängde precis över det tekniska motståndet på 700 cent.
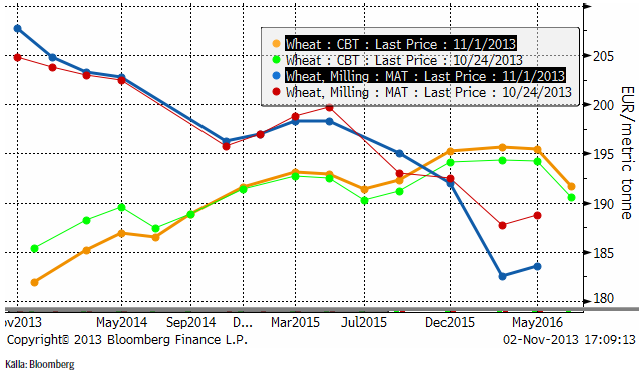
Nedan ser vi terminskurvorna för Chicagovete och Matif. Matif gick ännu mer in i backwardation för årets skörd, vilket visar på vilket akut behov det finns hos EU:s bönder att lära sig mer om terminer och affärsmässighet när det gäller marknadsföring av spannmål.
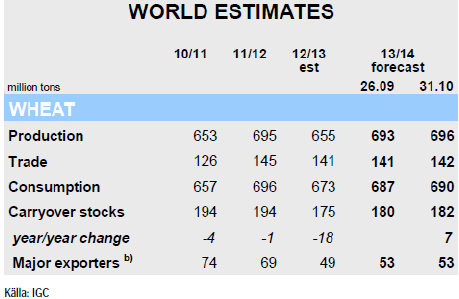
IGC (International Grains Council) kom med sin rapport i förra veckan och har ökat sitt estimat för den globala spannmålsproduktionen 2013/14 med 10 mt till 1940 mt. Tack vare gynnsamma väderförhållanden hos de stora producenterna, framförallt i USA och OSS, så bidrar detta till en förväntad ökning med 8% på årsbasis från 2012 års produktion då torka drabbade stor del av grödorna. Utgående lager justeras upp sedan förra månaden med 7 mt till ett fyra-års-högsta på 367 mt.
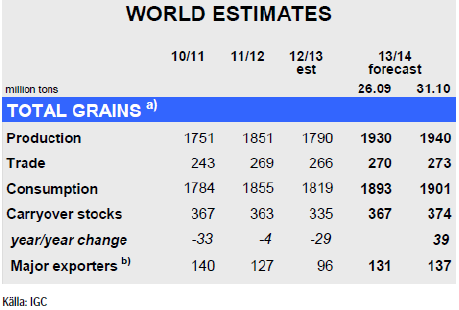
För vete indikeras en global produktion på 696 mt, vilket är en ökning med nästan 4 mt från förra månaden. Revideringen återspeglar framförallt en återhämtning av produktionen i OSS-länderna, vilket skulle ge en ökning med 6% på årsbasis.
Utgående lager förväntas öka med 7 mt på årsbasis till 182 mt som en följd av högre lager hos de stora exportländerna samt Kina.
Måndagens Crop Progress från USDA – den andra efter att USDA återupptagit publiceringen efter ”the U.S. government shutdown” – visar att sådden av amerikanskt höstvete nu börjar närma sig sitt slut då 86% var avklarad per den 27 oktober vilket är i linje med förra årets 87% vid den här tiden liksom det femåriga genomsnittet på 85%.
Uppkomsten av höstvete ligger på 65% – vilket är något högre än förra årets 61% men i linke med det femåriga genomsnittet på 64%.
Intressant är också andelen grödor klassade som ”good/excellent”. Visserligen justeras siffran ner med 4% från veckan innan till 61%, men det är betydligt högre än förra årets 40% vid den här tiden.
Vi fortsätter att tro på högre pris på vete basis Matif och rekommenderar köp.
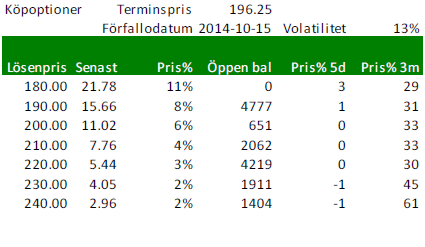
Optioner på vete
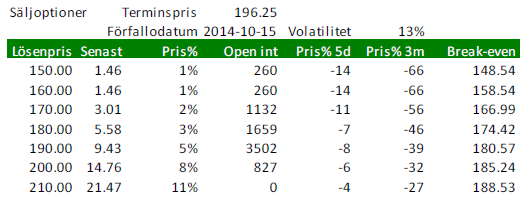
Nedan ser vi priserna på köpoptioner på Matif på November-2014 (Matif vete). Notera att volatiliteten 13% är ganska låg. Volatiliteten brukar vara låg när priserna är låga. Eftersom terminen gått upp lite har köpoptioner ökat lite i värde och säljoptioner fallit i värde.
Nedanstående optioner är köpoptioner, priser per stängning i fredags.
 Nedanstående är priser på säljoptioner.
Maltkorn
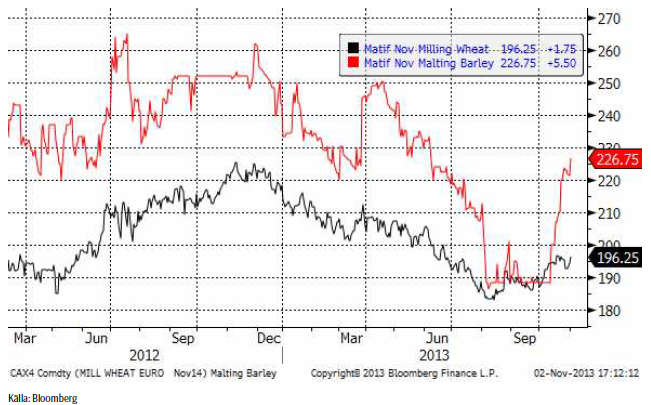
Vi har nu gått över till att studera 2014 års terminskontrakt för vete och maltkorn. Prisutvecklingen på dessa kontrakt ser vi nedan. Notera hur kraftigt terminskontraktet på maltkorn har återhämtat sig i oktober! Priset har gått upp från 190 euro per ton till 226.75 euro. Som vi sagt tidigare ser det ut att kunna bli lönsamt att odla maltkorn nästa år. Den som tycker att det är ett vågspel kan alltid prissäkra till 226.75 euro.
Majs
Majspriset – och nu tittar vi på nästa års skörd, december 2014-kontraktet har återtagit sin fallande trend. Förväntningarna inför WASDE-rapporten som kommer i veckan är att avkastningen per acre ska vara högre än tidigare beräknat.
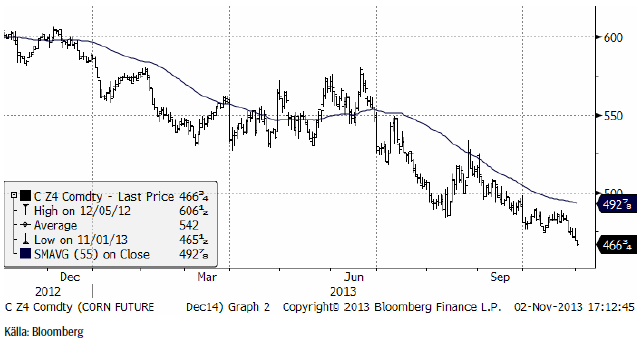
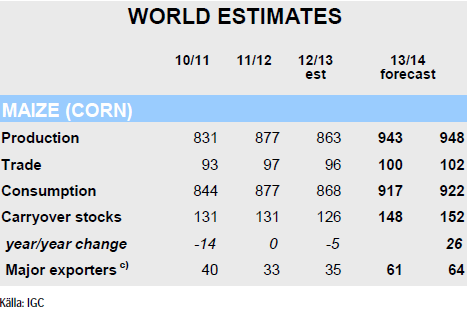
IGC rapporterade i veckan som gick. Den globala produktionen av majs beräknas uppgå till rekordhöga 948 mt, vilket är en ökning med 5 mt sedan IGC’s förra rapport vilket framförallt drivs av en återhämtning i USA. Detta göra också att utgående lager justeras upp med 4 mt jämfört med september och lagren hos de största exportörerna (Argentina, Brasilien, Ukraina och USA) estimeras till ett 26-års högsta.
Måndagens Crop Progress från USDA visade ett rejält uppsving i skörden av majs från 39% per den 20 oktober till 59% en vecka senare. Marknadens förväntningar låg runt 50-55%. Tar man en närmare titt på ”Istaterna” så är skörden avklarad till 74% respektive 59% i Illinois och Indiana. Iowa ligger nu på 55%, vilket är strax under genomsnittet på 60% men visar på att lantbrukarna varit aktiva då detta trots allt är en ökning med 20% från veckan innan. Den största veckovisa ökningen står dock lantbrukare i Minnesota för, från 19% till 48%.
Tillståndet för den amerikanska majsen har också förbättrats i de flesta stater under veckan och andelen grödor klassade som ”good/excellent” justeras upp med 2% till 62%. Tillståndet för grödorna i Illinois lämnades oförändrat och andelen ”good/excellent” ligger på 68%. Tillståndet för grödorna i Indiana förbättrades marginellt med 1% till 74% medan Iowa ’s grödor klassade som ”godd/excellent” justerades upp med 4% till 49%.
Vi väljer att hålla fast vid köprekommendationen.
Sojabönor
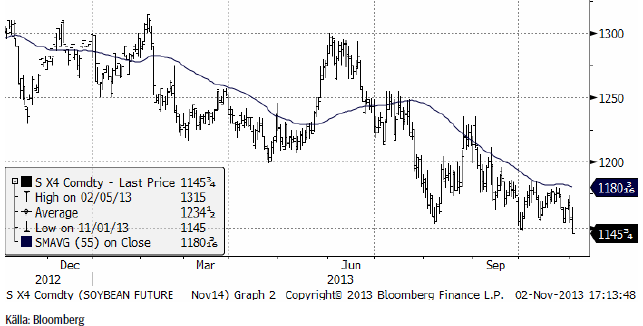
Marskontraktet 2014 föll i fredags under det tekniska stödet på 1250, vilket ger möjlighet till fritt fall ner till 1200.
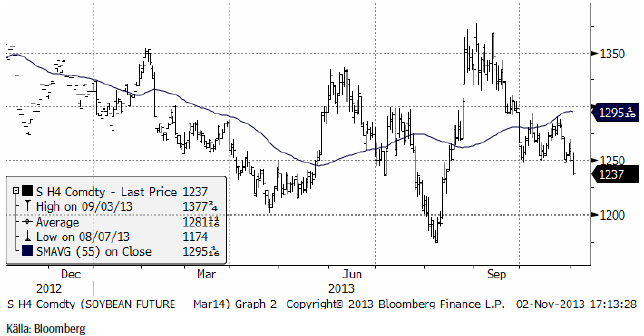
Vi ser också att November 2014 bröt under sitt tekniska stöd på 1150.
IGC rapporterade i veckan som gick. För sojabönor förväntas den globala produktionen att stiga för andra året i rad till rekordhöga 282 mt för 2013/14, en ökning med 4% på årsbasis, framförallt tack vare estimerade jätteskördar i Sydamerika. Globala utgående lager lämnas oförändrade från förra månaden på 29 mt men beräknas öka med 12% på årsbasis med de stora exportörerna Argentina och Brasilien i täten. Den globala handeln med sojabönor väntas öka med 10% på årsbasis drivet av en fortsatt stark efterfrågan från Kina med en ökad import.
Måndagens Crop Progress från USDA visar att skörden av sojabönor i USA avancerar och nu ligger i linje med det femåriga genomsnittet på 77%, en ökning från 63% veckan innan. Minnesota och South Dakota ligger strax över genomsnittet liksom Iowa och Illinois med 87% respektive 85% av skörden avklarad.
Förra veckans Crop Progress rapport var också den sista som visade tillståndet för sojabönorna där USDA avslutade säsongen med att konstatera att 57% klassades som ”good/excellent”, vilket var något lägre än snittet på 61% vid samma tid.
62% av grödorna i Illinois klassades som ”good/excellent” och för Indiana låg siffran på 68%. För Iowa stannade siffran på blygsamma 42%.
Vi behåller säljrekommendation.
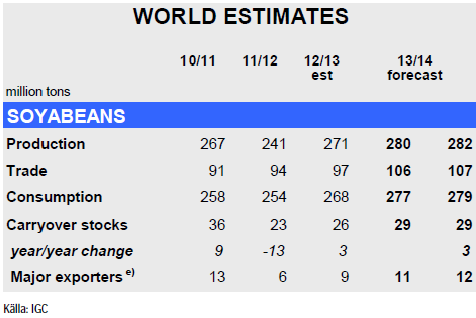
Raps
Rapspriset (februari 2014) gick inte under det tekniska stödet på 360 euro i början av oktober och har sedan dess stigit på ett sätt som inte riktigt kan förväntas av en marknad som ska vara i fallande trend. Priset ligger nu strax under 380 euro. Om priset går över 380 euro förändras bilden ytterligare. Det kan vara en trendvändning uppåt på gång. Det återstår att se.
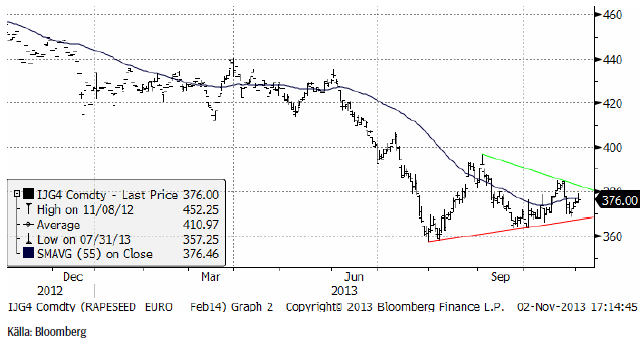
November 2014-kontraktet uppvisar liksom februarikontraktet en formation som inom den tekniska analysen kallas för en triangelformation. Sådana karaktäriseras av lägre toppar och högre bottnar. Utbrott ur ”triangeln” brukar följas av ytterligare rörelse i utbrottets riktning. I skrivande stund finns inget annat att göra än att avvakta och se åt vilket håll utbrottet sker.
För två veckor sedan gick vi över till en försiktig köprekommendation, men som läget är nu tycker vi det är bättre att avvakta med en neutral position.
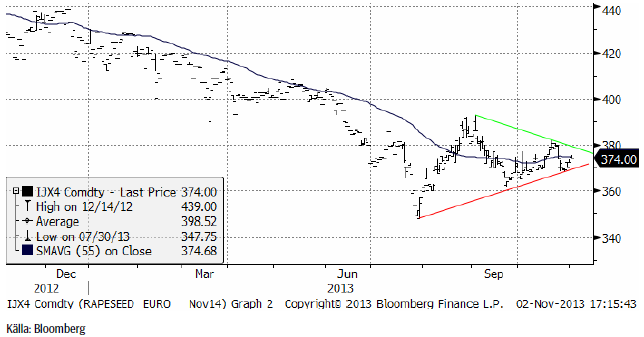
Potatis
Potatispriset av årets skörd, föll tillbaka från toppnoteringen 24 euro och stängde förra veckan på 21.20 euro per deciton.
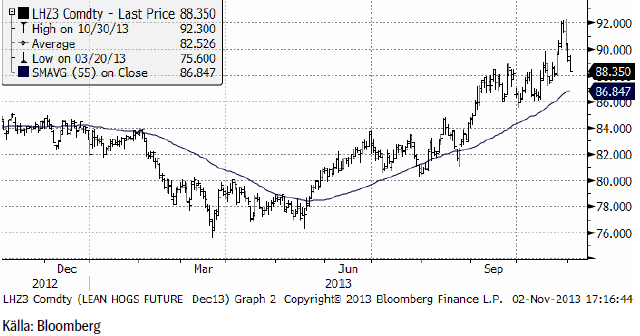
Gris
Lean hogs gick upp till ny toppnotering på 92.3 cent per pund innan priset föll tillbaka och stängde veckan på 88.35.
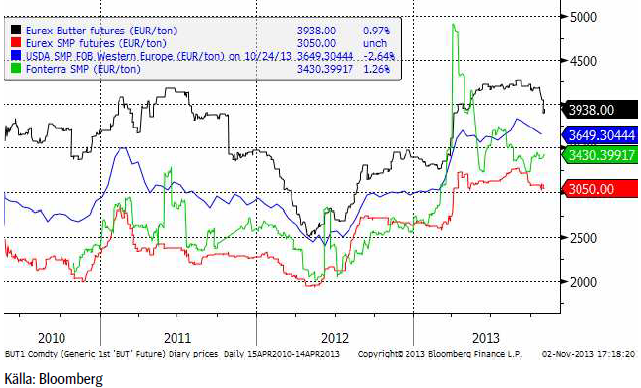
Mjölk
Terminerna på smör och skummjölkspulver vid Eurex-börsen var påtagligt svaga under veckan. Terminerna på smör föll med 3% för det kortaste kontraktet och med 2% för de lite längre. Priset på skummjölkspulver backade även det, men lite mindre.
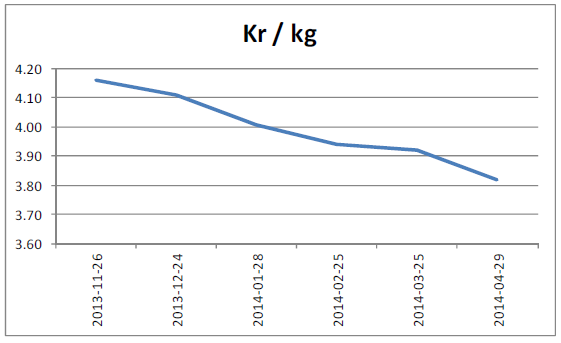
Om vi utgår från terminspriserna på smör och SMP och aktuell växelkurs eursek, får vi följande terminskurva i kronor per kilo svensk mjölkråvara. Notera dock att dessa priser alltid bör ligga över ett pris för råvaran i Sverige (och på andra ställen också) eftersom SMP och smör är produkter och inte råvaror.
Socker
Marskontraktet på råsocker har rekylerat tillbaka till en teknisk stödnivå. Det är en nivå där en vändning uppåt skulle kunna ske. Vi upprepar därför vår köprekommendation på socker.
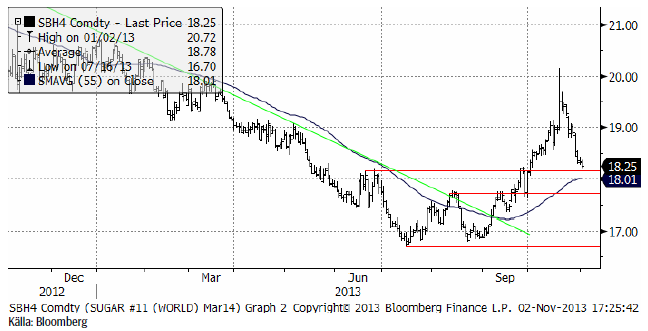
Det råder inget tvivel om att trenden för sockerpriset har vänts från att vara fallande de senaste åren, till att bli stigande.
Gödsel
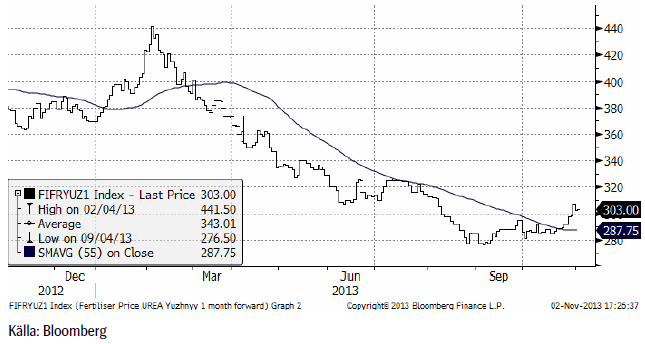
Priset på kväve / urea steg i veckan som gick och ligger nu på 303 dollar per ton. Botten noterades den 4 september på 276.50 dollar per ton. Priset ligger ändå en bra bid under förra årets toppnotering på 441.50.
[box]SEB Veckobrev Jordbruksprodukter är producerat av SEB Commodities Sales desk och publiceras i samarbete och med tillstånd på Råvarumarknaden.se[/box]
Detta marknadsföringsmaterial, framtaget av SEB’s Commodities Sales desk, har upprättats enbart i informationssyfte.
Även om innehållet är baserat på källor som SEB bedömt som tillförlitliga ansvarar SEB inte för fel eller brister i informationen. Den utgör inte oberoende, objektiv investeringsanalys och skyddas därför inte av de bestämmelser som SEB har infört för att förebygga potentiella intressekonflikter. Yttranden från SEB’s Commodities Sales desk kan vara oförenliga med tidigare publicerat material från SEB, då den senare hänvisas uppmanas du att läsa den fullständiga rapporten innan någon åtgärd vidtas.
Dokumentationen utgör inte någon investeringsrådgivning och tillhandahålls till dig utan hänsyn till dina investeringsmål. Du uppmanas att självständigt bedöma och komplettera uppgifterna i denna dokumentation och att basera dina investeringsbeslut på material som bedöms erforderligt. Alla framåtblickande uttalanden, åsikter och förväntningar är föremål för risker, osäkerheter och andra faktorer och kan orsaka att det faktiska resultatet avviker väsentligt från det förväntade. Historisk avkastning är ingen garanti för framtida resultat. Detta dokument utgör inte ett erbjudande att teckna några värdepapper eller andra finansiella instrument. SEB svarar inte för förlust eller skada – direkt eller indirekt, eller av vad slag det vara må – som kan uppkomma till följd av användandet av detta material eller dess innehåll.
Observera att det kan förekomma att SEB, dess ledamöter, dess anställda eller dess moder- och/eller dotterbolag vid olika tillfällen innehar, har innehaft eller kommer att inneha aktier, positioner, rådgivningsuppdrag i samband med corporate finance-transaktioner, investment- eller merchantbankinguppdrag och/eller lån i de bolag/finansiella instrument som nämns i materialet.
Materialet är avsett för mottagaren, all spridning, distribuering mångfaldigande eller annan användning av detta meddelande får inte ske utan SEB:s medgivande. Oaktat detta får SEB tillåta omfördelning av materialet till utvald tredje part i enlighet med gällande avtal. Materialet får inte spridas till fysiska eller juridiska personer som är medborgare eller har hemvist i ett land där sådan spridning är otillåten enligt tillämplig lag eller annan bestämmelse.
Skandinaviska Enskilda Banken AB (publ) är ett [publikt] aktiebolag och står under tillsyn av Finansinspektionen samt de lokala finansiella tillsynsmyndigheter i varje jurisdiktionen där SEB har filial eller dotterbolag.

Market is starting to take US/Iran headlines with a pinch of salt. Brent crude rose $2.8/b yesterday to an official close of $112.1/b. But after that it traded as low as $108.05/b before ending late night at around $109.7/b. Through the day it traded in a range of $106.87 – 112.72/b amid a flurry of news or rumors from Iran and the US. ”US temporary sanctions during negotiations” (falls alarm). ”We will bomb Iran” (not anyhow),… etc. While the market is still fluctuating to this kind of news flow, it is starting to take such headlines with a pinch of salt.

We’ll see. Maybe, maybe not. The Brent M1 contract is trading at $110.2/b this morning which very close to the average ticks through yesterday of $110.4/b.
Trump with bearish, verbal intervention whenever Brent trades above $110/b it seems. What seems to be a pattern is that Trump states something like ”very good negotiations going on with Iran”, ”New leaders in Iran are great,..”, ”Great progress in negotiations,…”, ”Deal in sight,..” etc whenever the Brent M1 contract trades above $110/b. An effort to cool the market. These hot air verbal interventions from Trump used to have a heavy bearish impact on prices, but they now seems to have less and less effect unless they are backed by reality.
As far as we can see there has been no real progress in the negotiations between the US and Iran with both sides still standing by their previous demands.
Iran is getting stronger while the cease fire lasts making a return to war for Trump yet harder. Iran is naturally in constant preparation for a return to war given Trump’s steady threats of bombing Iran again. Iran is naturally doing what ever is possible to prepare for a return to war. And every day the cease fire lasts it is better prepared. This naturally makes it more and more difficult and dangerous for the US to return to warring activity versus Iran as the consequences for energy infrastructure in the Persian Gulf will be more and more severe the longer the cease fire lasts. Israel seems to see it this way as well. That the war is not won and that current frozen state of a cease fire gives Iran opportunity to rebuild military and politically.
Global inventories are drawing down day by day. How much? In the meantime the Strait of Hormuz stays closed. There is varying measures and estimates of how much global inventories are drawing down. Our rough estimate, back of the envelope, is that global inventories are drawing down by at least some 10 mb/d or about 300 mb/d in a balance between loss of supply versus demand destruction. Other estimates we see are a monthly draw of 250-270 mb/d. The IEA only ’measured’ a draw in global observable stocks of 117 mb in April with oil on water rising 53 mb while on shore stocks fell 170 mb. But global stocks are hard to measure with large invisible, unmeasured stocks. As such a back of the envelope approach may be better.
Oil products is what the world is consuming. Oil product prices likely to rise while product stocks fall. Strategic Petroleum Reserves (SPR) are predominantly crude oil. Discharging oil from OECD SPR stocks, a sharp reduction in Chinese crude imports and a reduction in global refinery throughput of 6-7 mb/d has helped to keep crude oil markets satisfactorily supplied. But global inventories are drawing down none the less. And oil products is really what the world is consuming. So if global refinery throughput stays subdued, then demand will eventually have to match the supply of oil products. The likely path forward this summer is a steady draw down in jet fuel, diesel and gasoline. Higher prices for these. Then, if possible, higher refinery throughput and higher usage of crude in response to very profitable refinery margins. And lastly sharper draw in crude stocks and higher prices for these. But some 6 mb/d of oil products used to be exported through the Strait of Hormuz. And it may not be so easy to ramp up refinery activity across the world to compensate. Especially as Ukraine continues to damage Russian refineries as well as Russian crude production and export facilities.
Watch oil product stocks and prices as well as Brent calendar 2027. What to watch for this summer is thus oil product inventories falling and oil product premiums to crude rising. Another measure to watch is the Brent crude 2027 contract as it rises steadily day by day as the Strait of Hormuz stays closed and global oil inventories decline. The latter is close to the highest level since the start of the war and keeps rising.
The Brent M1 contract and the Brent 2027 prices and current price of jet fuel in Europe (ARA). All in USD/b

Our back of the envelope calculation of the global shortage created by the closure of the Strait of Hormuz. Note that 3.5 mb/d of discharge from SPR is also a draw. Note also that ’Forced demand loss’ of 2.5 mb/d is probably temporary and will fall back towards zero as logistics are sorted out leaving ’Price demand loss’ to do the job of balancing the market. Thus a shortfall of at least 9 mb/d created by the closure. More if SPR discharge is included and more if Forced demand loss recedes.

Brent is climbing higher. Front-month is at USD 106.3/bl this morning, close to a weekly high and a USD 9/bl jump from Mondays open. This is the move we flagged as a risk earlier in the week: the market shifting from ”a deal is around the corner” to ”this is going to take longer than we thought”.

Analyst Commodities, SEB
During April, rest-of-year Brent remained remarkably stable around USD 90/bl. A stability which rested on one single assumption: the SoH reopens around 1 May. That assumption is now slowly falling apart.
As we highlighted yesterday: every week of delay beyond 1 May adds (theoretically) ish USD 5/bl to the rest-of-year average, as global inventories draw 100 million barrels per week. i.e., a mid-May reopening implies rest-of-year Brent closer to USD 100/bl, and anything pushing into June or July takes us meaningfully higher.
What’s changed in the last 48 hours:
#1: The US military has formally warned that clearing suspected sea mines from SoH could take up to six months. That is a completely different timescale from what the financial market is pricing. Even a political deal tomorrow does not immediately reopen the strait.
#2: Trump has shifted his tone from urgency to ”strategic patience”. In yesterday’s press conference: ”Don’t rush me… I want a great deal.” The market is reading this as a president no longer feeling pressured by timelines, with the naval blockade running in the background.
#3: So far, the military activity is escalating, not de-escalating. Axios reports Iran is laying more mines in SoH. The US 3rd carrier strike group (USS George H.W. Bush) is arriving with two countermine vessels. Trump yesterday ordered the US Navy to destroy any Iranian boats caught laying mines. While CNN reports that the Pentagon is actively drawing up plans to strike Iranian SoH capabilities and individual Iranian military leaders if the ceasefire collapses. i.e., NOT a attitude consistent with an imminent deal!
Spot crude and product prices eased off the early-April highs on a combination of system rerouting and deal optimism. Both now weakening. Goldman estimates April Gulf output is reduced by 14.5 mbl/d, or 57% of pre-war supply, a number that keeps getting worse the longer this drags on.
Demand-side adaptation is ongoing: S. Korea has cut its Middle East crude dependence from 69% to 56% by pulling more from the Americas and Africa, and Japan is kicking off a second round of SPR releases from 1 May. But SPRs are finite.
Ref. to the negotiations, we should not bet on speed. The current Iranian leadership is dominated by genuine hardliners willing to absorb economic pain and run the clock to extract concessions. That is not a setup for a rapid resolution. US/Israeli media briefings keep framing the delay as ”internal Iranian divisions”, the reality is more complicated and points toward weeks and months, not days.
Our point is that the complexity is large, and higher prices have only just started (given a scenario where the negotiations drag out in time). The market spent April leaning on the USD 90/bl rest-of-year assumption; that case is diminishing by the hour. If ”early May reopening” is replaced by ”June, July or later” over the next week or two, both crude and products have meaningful room to reprice higher from here. There is a high risk being short energy and betting on any immediate political resolution(!).
Down on Friday. Up on Monday. The Brent June crude oil contract traded down 5.1% last week to a close of $90.38/b. It reached a high of $103.87/b last Monday and a low of $86.09/b on Friday as Iran announced that the Strait of Hormuz was fully open for transit. That quickly changed over the weekend as the US upheld its blockade of Iranian oil exports while Iran naturally responded by closing the SoH again. The US blew a hole in the engine room of the Iranian ship TOUSKA and took custody of the ship on Sunday. Brent crude is up 5.6% this morning to $95.4/b.
The cease-fire is expiring tomorrow. The US has said it will send a delegation for a second round of negotiations in Islamabad in Pakistan. But Iran has for now rejected a second round of talks as it views US demands as unrealistic and excessive while the US is also blocking the Strait of Hormuz.
While Brent is up 5% this morning, the financial market is still very optimistic that progress will be made. That talks will continue and that the SoH will fully open by the start of May which is consistent with a rest-of-year average Brent crude oil price of around $90/b with the market now trading that balance at around $88/b.
Financial optimism vs. physical deterioration. We have a divergence where the financial market is trading negotiations, improvements and resolution while at the same time the physical market is deteriorating day by day. Physical oil flows remain constrained by disrupted flows, longer voyage times and elevated freight and insurance costs.
Financial markets are betting that a US/Iranian resolution will save us in time from violent shortages down the road. But every day that the SoH remains closed is bringing us closer to a potentially very painful point of shortages and much higher prices.
The US blockade is also a weapon of leverage against its European and Asian allies. When Iran closed the SoH it held the world economy as a hostage against the US. The US blockade of the SoH is of course blocking Iranian oil exports. But it is also an action of disruption directed towards Europe and Asia. The US has called for the rest of the world to engaged in the war with Iran: ”If you want oil from the Persian Gulf, then go and get it”. A risk is that the US plays brinkmanship with the global oil market directed towards its European and Asian allies and maybe even towards China to force them to engage and take part. Maybe unthinkable. But unthinkable has become the norm with Trump in the White House.


Sommarväder skapar prisrally på elbörsen
Oil product price pain is set to rise as the Strait of Hormuz stays closed into summer

Solkraften pressar elpriserna dagtid

Michel Gubel ger sin syn på oljemarknaden