

Analys
SEB Jordbruksprodukter, 30 september 2013


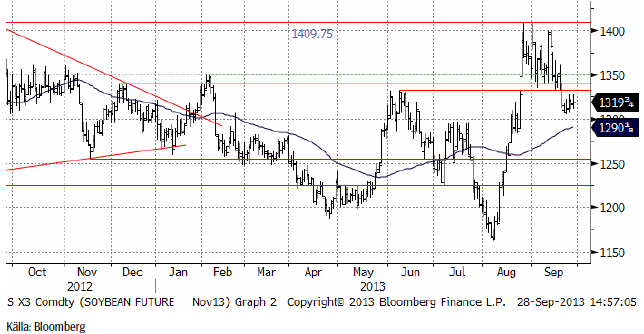
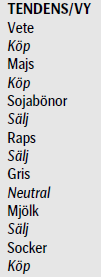 Vi anser att vi har tidiga tecken på en vändning uppåt i pristrenden för vete och majs. Därför byter vi rekommendation från neutral till köp på dessa. För oljeväxter har vi fortfarande säljrekommendation. Den tekniska analysen av sojamarknaden indikerar ett nytt stort prisfall från fredagens 1319 till 1250 cent per bushel.
Den sista september är det dags att ta emot lagerstatistiken från USDA: hur stora lagren av spannmål och oljeväxter som fanns i USA den 1 september.
Estimaten hos marknaden är som följer:
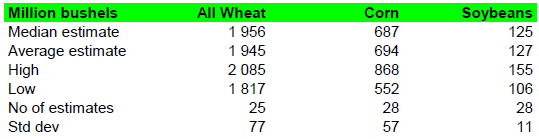
Statistiken publiceras klockan 18:00 svensk tid.
Det är den så kallade Golden Week i Kina den här veckan, vilket innebär att affärslivet går på sparlåga där hela veckan.
Odlingsväder
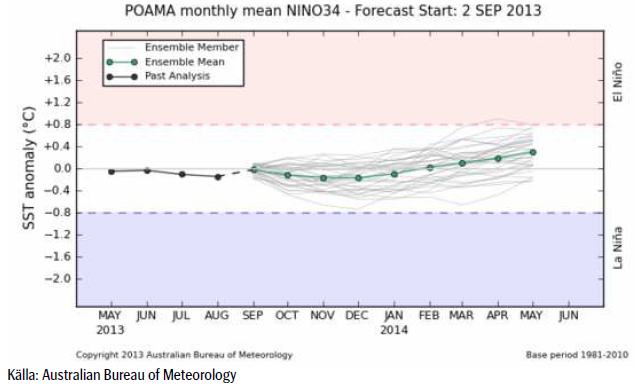
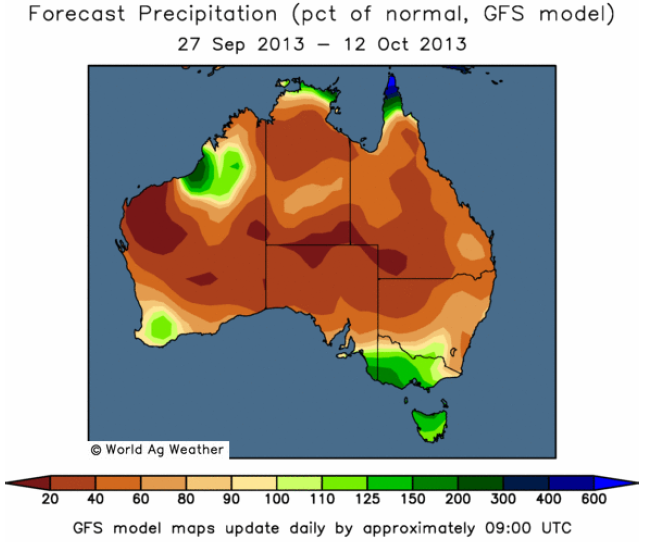
Det kalla och torra vädret i Argentina väcker frågan om det är någon La Niña i vardande, men det är det inte som vi ser av ensemble-prognosen från Australiens Meteorologiska byrå nedan.
Det har ändå varit torrt och kallt i norra Argentina, så pass att frost befaras ha skadat nysått vete.
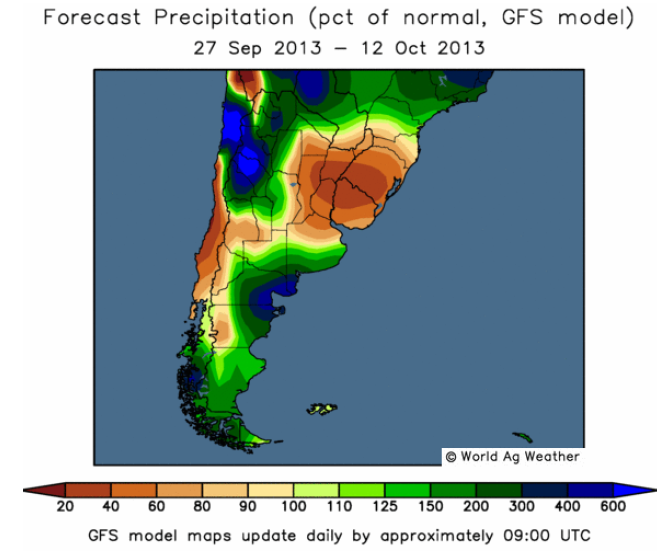
Australien har varit nästan helt torrt och väntas enligt den senaste prognosen med GFS-modellen vara fortsatt huvudsakligen torrt fram till mitten av oktober.
Vete
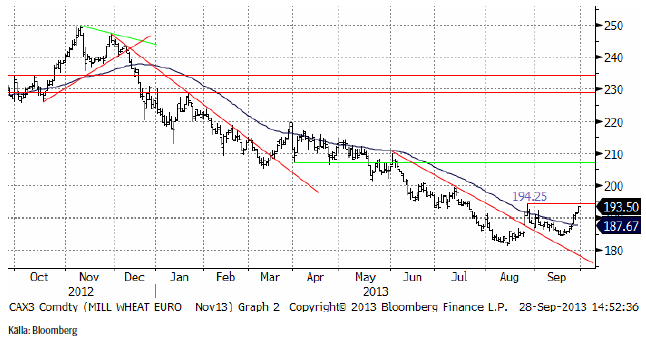
November månads terminskontrakt på Matif har arbetat sig upp mot motståndslinjen. Bryts den signaleras en stigande trend. Den fallande trenden är redan slut och vi har sedan mitten av augusti haft neutral rekommendation. Eftersom Chicagovetet har brutit motståndet redan (svagare dollar har inverkat), men är den viktigare börsen, går vi över till köprekommendation från och med det här veckobrevet. Vi skrev också förra veckan att förväntningarna på stigande pris helt saknas. Det finns alltså en god jordmån för stigande priser hos marknadens aktörer. De är av allt att döma tämligen oförberedda. Däremot tror vi inte just nu på att det finns stor potential på uppsidan, eftersom så många lantbrukare håller på sin spannmål och successivt kommer att sälja.
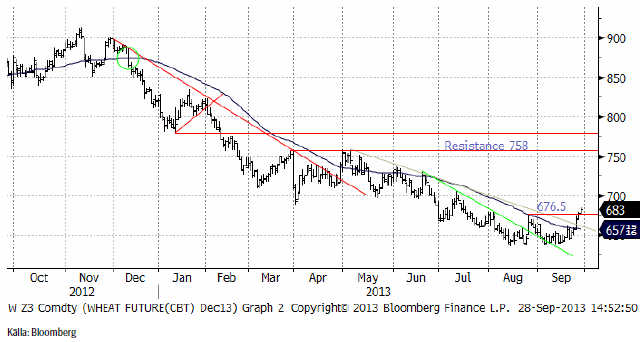
Decemberkontraktet på CBOT har brutit motståndet på 676.5 cent och därmed befinner sig marknaden enligt den tekniska analysen, i stigande trend.
Nedan ser vi terminskurvorna för Chicagovete och Matif.
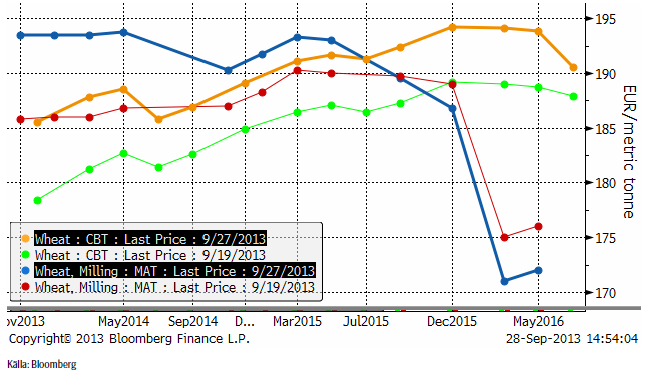
Som vi ser är det framförallt de korta löptiderna som har gått upp på Matif. På Chicagobörsen har alla löptider gått upp i pris. Det råder nu backwardation på Matif-börsen, vilket är ett tecken på ”brist på material för omgående leverans”. Det är en återspegling av den höga exporttakten i kombination med att bönderna håller på materialet i förhoppning om högre pris – vilket indikerar att de ännu inte lärt sig att de i dessa lägen ska sälja sin vara spot och köpa den på termin – istället för att sitta kvar med sin spannmål.
Måndagens Crop Progress från USDA visar att skörden av amerikanskt vårvete går mot sitt slut. För de 6 stater som rapporterar så är nu 93% av skörden avklarad, en ökning från förra veckans 90%. Vid den här tiden förra året var dock skörden avklarad.
Sådden av amerikanskt höstvete går också framåt och 22% av den förväntade arealen var avklarad per den 22 september, upp från förra veckans 12 och i linje med förra året men en hårsmån lägre än det 5-åriga genomsnittet på 24%.
IGC (International Grains Council) kom med sin rapport i förra veckan och har ökat sitt estimat för den globala spannmålsproduktionen 2013/14 med 1 mt till 1930 mt. Tack vare gynnsamma väderförhållanden hos de stora producenterna, framförallt i USA och OSS, så bidrar detta till en förväntad ökning med 8% på årsbasis från 2012 års produktion då torka drabbade stor del av grödorna. Utgående lager justeras upp med 2 mt till 367 mt.
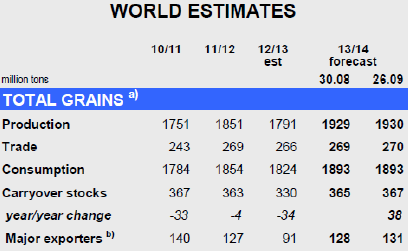
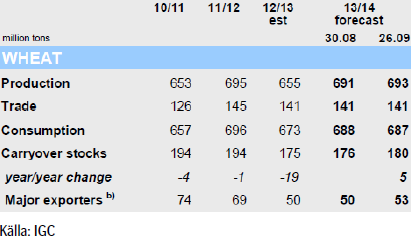
För vete indikeras en global produktion på 693 mt, vilket är en ökning med 2 mt från förra månaden och som nu kommer än närmare rekordnivån under 2011/12. Revideringen återspeglar högre produktion i Europa och OSS, vilket ger en ökning med 6% på årsbasis. USDA’s nuvarande estimat ligger på 708.9 mt.
Utgående lager förväntas öka med 5 mt på årsbasis till 180 mt som en följd av högre lager hos de stora exportländerna samt Kina.
Det är en typisk IGC-rapport. IGC börjar året lågt och höjer successivt estimaten. IGC:s ”sanning” måste alltid modifieras och man vet egentligen inte hur mycket som den behöver justeras.
Kinas CNGOIC höjde i veckan sitt importestimat med 1 mt till 7.5 mt. De har redan köpt 6.1 mt. Man kan tolka detta som att översvämningen i norra Kina faktiskt haft en negativ effekt, precis som vi skrivit att den skulle ha. Priset på vete i Kina är på rekordhög nivå.
Argentina har drabbats av frost i norra delen av landet, där vete odlas. Australien är torrt och priset på vete där har handlats upp.
Högproteinvete i norra Europa steg i pris förra veckan. Vete med 14% protein och över handlades 25 euro över Matif i norra Tyskland. 12% protein handlades 12 euro över.
Det blev mycket vårvete skördat i år, men skördarna blev så stora att kvaliteten på gluten har blivit sämre, erfar vi.
Förra veckan skrev vi om att de höga sojapriserna bidrar till en ökad odling av soja i USA nästa år på bekostnad av majs och vete. Vi kan se av de låga kvävegödselpriset att efterfrågan har varit svag, vilket tyder på att valet av soja redan är gjort. Detta leder till minskat utbud av spannmål och därmed ett högre pris. Tekniskt har vi köpsignal i Chicagovetet och vi tror att Matif kommer att följa efter. Därför går vi över till
köprekommendation.
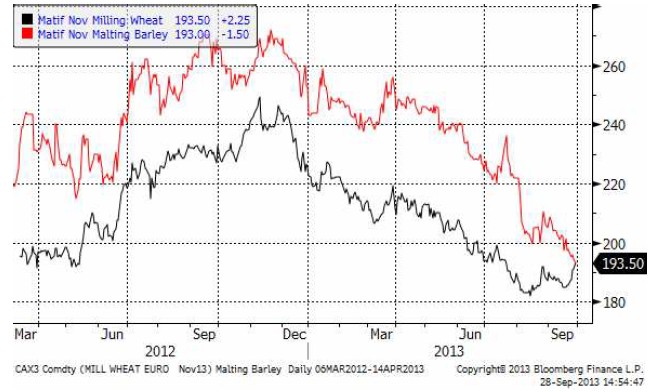
Maltkorn
Terminspriset (november) ligger nu under matifvetet (november). Det trodde vi inte skulle kunna ske, men det kunde det. Uppenbarligen finns det så väldigt mycket maltkorn i Europa, efter att så stor areal blev vårsådd. Vi vet också att höstsådden i år har skett med religiös nit, vilket tyder på att maltkornet kan få revansch nästa år.
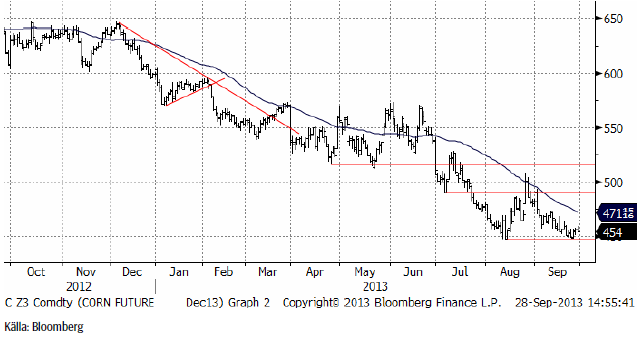
Majs
Majspriset (december 2013) är nere på det tekniska stödet och vi tror att det kommer att hålla. Bryts det, ska man naturligtvis ha en stop-loss strax under.
Tillståndet för den amerikanska majsen förbättrades under förra veckan enligt måndagens Crop Progress från USDA. För de 18 stater som rapporterar så klassas nu 55% som ”good/excellent”, en ökning med 2% från veckan innan och nu marginellt över det 5-åriga genomsnittet på 54%.
Omkring 58% respektive 64% av grödorna i Illinois och Indiana klassas som ”good/excellent”, vilket är en förbättring jämfört med veckan innan för Illinois. Iowa ligger fortfarande kvar på en låg nivå, endast 37%, men även här är det en ökning med 2% från veckan innan.
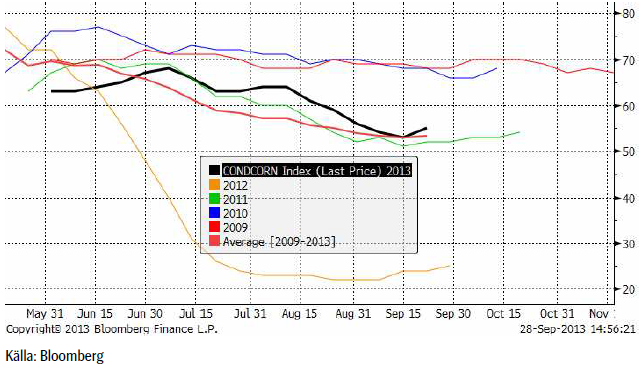
Grödornas sena utveckling i år börjar nu visa sig i skördestatistiken. Enligt USDA var endast 7% av skörden avklarad per den 22 september jämfört med det 5-åriga genomsnittet på 16%. Tar man en närmare titt på ”Istaterna” så var bara 3% av Iowas skörd klar jämfört med snittet på 9%, medan endast 5% av skörden i Illinois var klar jämfört med det 5-åriga genomsnittet på 24% vid den här tiden.
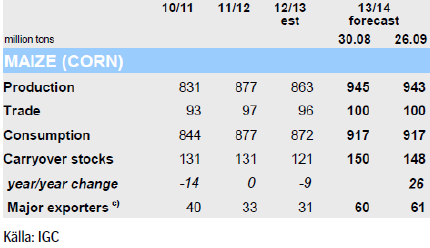
IGC rapporterade i veckan som gick. Den globala produktionen av majs beräknas uppgå till 943 mt, vilket är en minskning med 2 mt sedan IGC’s förra rapport men fortfarande nytt rekord och en ökning med 9% på årsbasis. Utgående lager justeras också ner med 2 mt sedan augusti, men 148 mt är fortfarande väl över genomsnittet och lagren hos de största exportörerna (Argentina, Brasilien, Ukraina och USA) estimeras till ett 26-års högsta.
Cofco, det kinesiska livsmedelsföretaget, prognosticerade att Kinas självförsörjningsgrad på majs kommer att sjunka till 90% fram till år 2020. Det är nog mot den bakgrunden man ska se den förvirrade rapporteringen i veckan som gick om att ett kinesiskt företag köpt 5% av Ukraina.
Vi anser att priset har fallit tillräckligt och går över till köprekommendation.
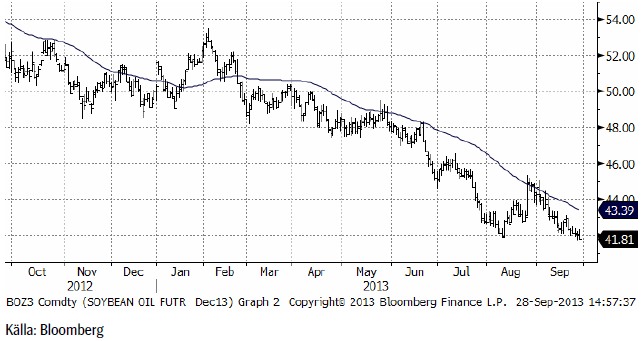
Sojabönor
Novemberkontraktet på sojabönor uppvisar en så kallad ”flagga” enligt den tekniska analysen. Det är den lilla rekylen uppåt vi ser i prisdiagrammet efter prisfallet från 1350 cent. ”Flaggor” brukar ofta etableras halvvägs i en rörelse. Halvvägs mäts i det här fallet från 1400 till 1300 cent. Det finns alltså, enligt den tekniska analysen, ytterligare 100 cent till på nedsidan att göra färdigt. Det skulle ta priset ner till åtminstone 1250, kanske rentav till 1225 cent.
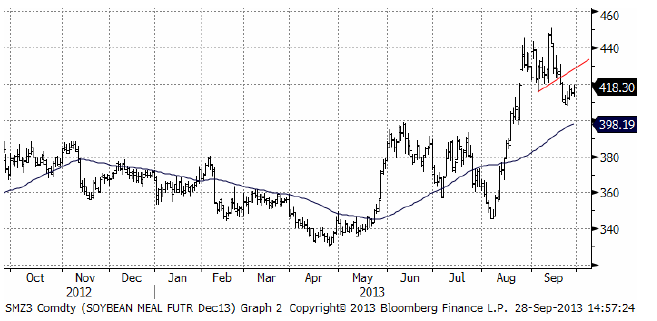
Sojamarknaden är naturligt uppdelad på sojamjöl och sojaolja och det är två helt olika världar. Sojamjölet uppvisar samma ”flagga” som i sojabönorna och vi tror att det kommer ett nytt kraftigt prisfall den här veckan.
Och nedan ser vi den mycket baissigare utvecklingen på sojaoljan. Priset ligger på en teknisk stödnivå.
Marknadens förväntningar på att USDA skulle justera upp tillståndet för sojabönor, efter förra veckans spridda regnskurar, kom av sig efter måndagens Crop Progress rapport där USDA istället lämnade siffrorna oförändrade för ”good/excellent” på 50%. Hälften av grödorna i Illinois klassas som ”good/excellent”, och i Indiana ligger siffran på 58%. För Iowa ligger siffran på blygsamma 34%. För Indiana och Iowa är detta en ökning med 1%-2% från veckan innan.
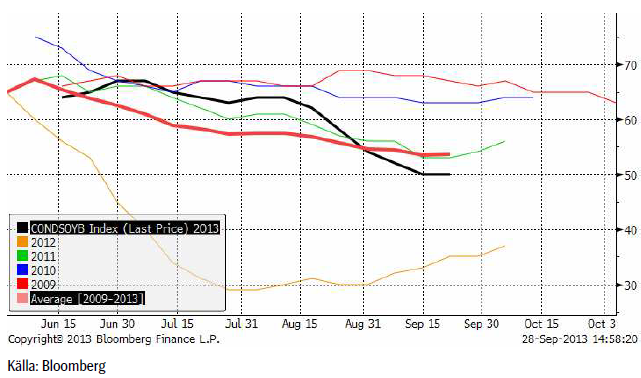
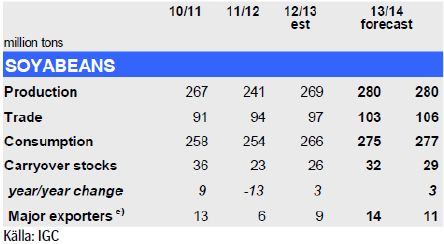
IGC rapporterade i veckan som gick. För sojabönor förväntas den globala produktionen att stiga för andra året i rad till rekordhöga 280 mt för 2013/14, en ökning med 4% på årsbasis, framförallt tack vare estimerade jätteskördar i Sydamerika. Globala utgående lager justeras ner med 3 mt från förra månaden till 29 mt, vilket bl.a reflekterar fortsatta nedjusteringar för USA, men beräknas öka med 12% på årsbasis med de stora exportörerna Argentina och Brasilien i täten. Den globala handeln med sojabönor väntas expandera med 9% på årsbasis drivet av en fortsatt stark efterfrågan från Kina (med en ökad import på 14%).
Den globala produktionen av raps / canola beräknas öka med 5% på årsbasis under 2013/14 till rekordhöga 66.5 mt, samtidigt som utgående lager beräknas öka med 17% på årsbasis – den första uppgången på 4 år.
Vi behåller säljrekommendation.
Raps
Rapspriset (november 2013) fann stöd på 360 euro, men vi tror att den rekyl som följde efter det kommer att bli kort och att ett nytt test av 360 euro är förestående.
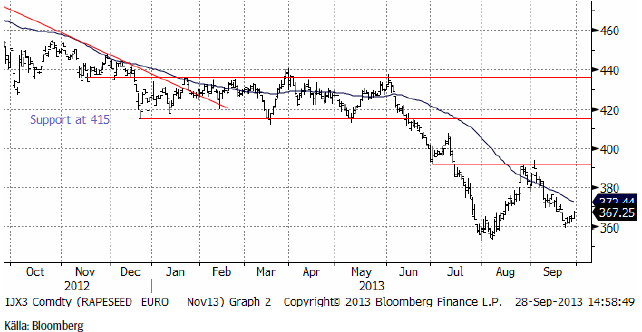
Att EU beslutat att lägga sig på 5% inblandning av biodiesel istället för 10%, tror vi inte fullt ut återspeglas i priserna än. Det finns de som lyckas visa att biobränsleefterfrågan inte haft någon påverkan på priserna, men det är ganska lätt att visa att de har haft det och har det även när biobränsleefterfrågan minskar.
Vi behåller säljrekommendationen på raps.
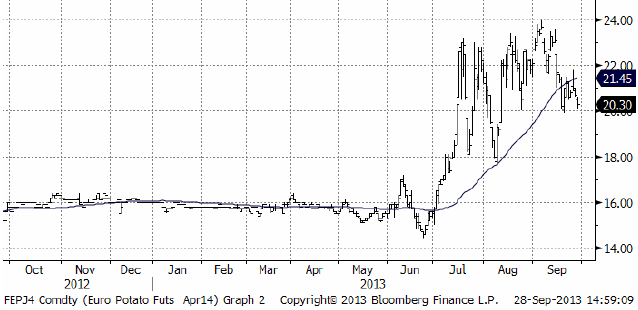
Potatis
Potatispriset av årets skörd, som handlas i april-kontraktet på Eurex, har fortsatt varit volatilt i veckan. Efter en ganska stor prisuppgång, föll priset tillbaka och stängde veckan på 20.30 euro per deciton. Det finns intresse för nästa års skörd, som alltså handlas på april 2015-kontraktet, men handeln har ännu inte riktigt kommit igång.
VD:n för brittiska firman Greenvale sade i veckan att Storbritannien kommer att behöva importera potatis i år. Odlad areal i Storbritannien blev låg i en historisk jämförelse. Shore Capital, en mäklarfirma, prognosticerade skörden till 5.3 mt, högre än förra årets 4.5 mt. Det historiska medelvärdet är 6 mt. Konsumtionen uppgår till ca 5.7 mt / år, vilket innebär att det finns ett importbehov. På grund av den torra sommaren i norra Europa finns sannolikt ett underskott även här.
Odlingen i EU har minskat med 40 mha till 1 775 mha i år enligt den tyska jordbrukarorganisationen DBV. Polen är den största producenten med 350,000 ha, följt av Tyskland och Rumänien.
Gris
Prist på Lean Hogs fortsatte att stiga i veckan, men trenden ser ut att ha tappat momentum. Slaktstatistiken visar på minskad utslaktning. Det talas i USA om spridningen av PEDv-viruset och nyheterna tyder på att minskningen är relaterad till sjukdomar eller rädsla för spridning av sjukdomar i USA.
I Kina är priserna relativt höga i ett historiskt perspektiv.
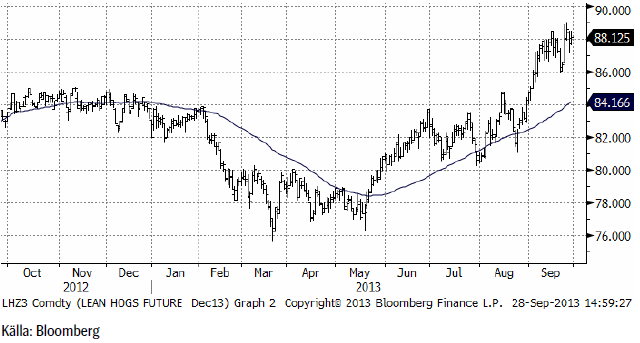
Å andra sidan förbättras marginalerna nu, när foderpriserna faller och priset på kött stiger.
Mjölk
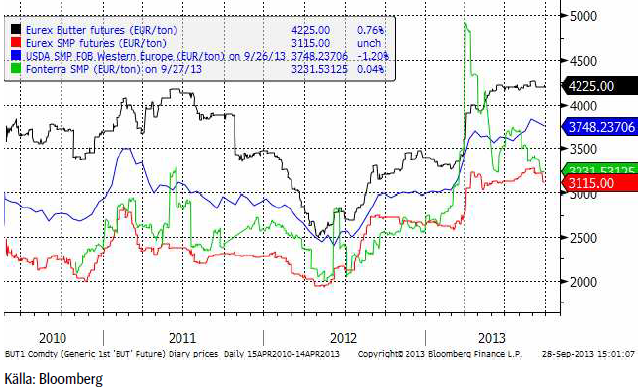
Terminerna på smör och skummjölkspulver vid Eurex-börsen var lite försiktigare i veckan som gick. Medan priset på smör behöll sin nivå, föll SMP relativt kraftigt. Fonterra-noteringen fortsatte gå ner i rask takt.
Socker
Marskontraktet på råsocker föll kraftigt i fredags, efter att inte ha orkat ta sig över toppen från juni. Rädslan uppstod när det stod klart att det blir stora leveranser på oktoberkontraktet som förfaller på måndag.
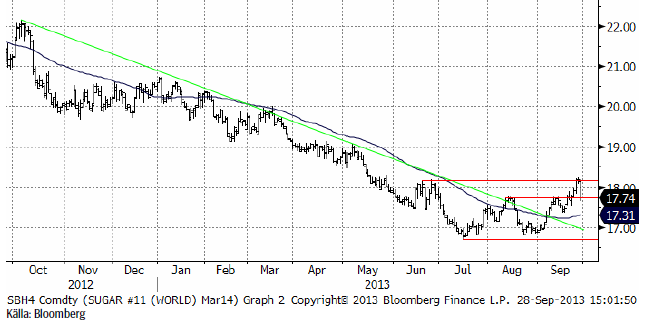
Thailand prognosticerar en produktion om 11 mt. Det är högre än ISO estimerat, men mindre än analysfirman Kingsman.
Ytterligare negativa nyheter kom från Brasilien, där konsultfirman Job Economia flaggade för att Brasilien kan tänka sig att importera etanol från USA.
Vi fortsätter dock att ha en positiv vy på prisutvecklingen framöver. Priset har gått ner i nästan tre år och har troligtvis en lång uppgångsfas framför sig. En rekyl nedåt mot 17 cent på marskontraktet betraktar jag som ett köptillfälle.
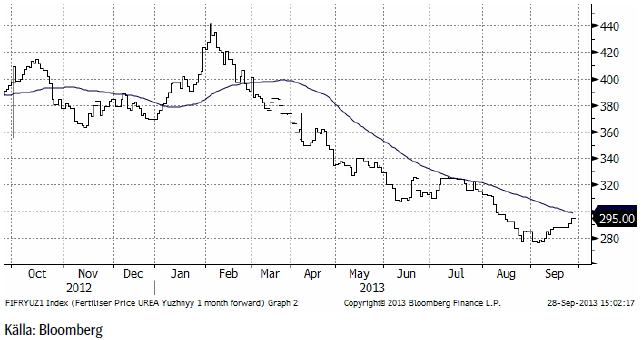
Gödsel
Priset på kväve / urea fortsatte att sega sig uppåt i veckan som gick. Priset noteras nu 15 dollar högre per ton på 295 dollar.
[box]SEB Veckobrev Jordbruksprodukter är producerat av SEB Merchant Banking och publiceras i samarbete och med tillstånd på Råvarumarknaden.se[/box]
Disclaimer
The information in this document has been compiled by SEB Merchant Banking, a division within Skandinaviska Enskilda Banken AB (publ) (“SEB”).
Opinions contained in this report represent the bank’s present opinion only and are subject to change without notice. All information contained in this report has been compiled in good faith from sources believed to be reliable. However, no representation or warranty, expressed or implied, is made with respect to the completeness or accuracy of its contents and the information is not to be relied upon as authoritative. Anyone considering taking actions based upon the content of this document is urged to base his or her investment decisions upon such investigations as he or she deems necessary. This document is being provided as information only, and no specific actions are being solicited as a result of it; to the extent permitted by law, no liability whatsoever is accepted for any direct or consequential loss arising from use of this document or its contents.
About SEB
SEB is a public company incorporated in Stockholm, Sweden, with limited liability. It is a participant at major Nordic and other European Regulated Markets and Multilateral Trading Facilities (as well as some non-European equivalent markets) for trading in financial instruments, such as markets operated by NASDAQ OMX, NYSE Euronext, London Stock Exchange, Deutsche Börse, Swiss Exchanges, Turquoise and Chi-X. SEB is authorized and regulated by Finansinspektionen in Sweden; it is authorized and subject to limited regulation by the Financial Services Authority for the conduct of designated investment business in the UK, and is subject to the provisions of relevant regulators in all other jurisdictions where SEB conducts operations. SEB Merchant Banking. All rights reserved.

Market is starting to take US/Iran headlines with a pinch of salt. Brent crude rose $2.8/b yesterday to an official close of $112.1/b. But after that it traded as low as $108.05/b before ending late night at around $109.7/b. Through the day it traded in a range of $106.87 – 112.72/b amid a flurry of news or rumors from Iran and the US. ”US temporary sanctions during negotiations” (falls alarm). ”We will bomb Iran” (not anyhow),… etc. While the market is still fluctuating to this kind of news flow, it is starting to take such headlines with a pinch of salt.

We’ll see. Maybe, maybe not. The Brent M1 contract is trading at $110.2/b this morning which very close to the average ticks through yesterday of $110.4/b.
Trump with bearish, verbal intervention whenever Brent trades above $110/b it seems. What seems to be a pattern is that Trump states something like ”very good negotiations going on with Iran”, ”New leaders in Iran are great,..”, ”Great progress in negotiations,…”, ”Deal in sight,..” etc whenever the Brent M1 contract trades above $110/b. An effort to cool the market. These hot air verbal interventions from Trump used to have a heavy bearish impact on prices, but they now seems to have less and less effect unless they are backed by reality.
As far as we can see there has been no real progress in the negotiations between the US and Iran with both sides still standing by their previous demands.
Iran is getting stronger while the cease fire lasts making a return to war for Trump yet harder. Iran is naturally in constant preparation for a return to war given Trump’s steady threats of bombing Iran again. Iran is naturally doing what ever is possible to prepare for a return to war. And every day the cease fire lasts it is better prepared. This naturally makes it more and more difficult and dangerous for the US to return to warring activity versus Iran as the consequences for energy infrastructure in the Persian Gulf will be more and more severe the longer the cease fire lasts. Israel seems to see it this way as well. That the war is not won and that current frozen state of a cease fire gives Iran opportunity to rebuild military and politically.
Global inventories are drawing down day by day. How much? In the meantime the Strait of Hormuz stays closed. There is varying measures and estimates of how much global inventories are drawing down. Our rough estimate, back of the envelope, is that global inventories are drawing down by at least some 10 mb/d or about 300 mb/d in a balance between loss of supply versus demand destruction. Other estimates we see are a monthly draw of 250-270 mb/d. The IEA only ’measured’ a draw in global observable stocks of 117 mb in April with oil on water rising 53 mb while on shore stocks fell 170 mb. But global stocks are hard to measure with large invisible, unmeasured stocks. As such a back of the envelope approach may be better.
Oil products is what the world is consuming. Oil product prices likely to rise while product stocks fall. Strategic Petroleum Reserves (SPR) are predominantly crude oil. Discharging oil from OECD SPR stocks, a sharp reduction in Chinese crude imports and a reduction in global refinery throughput of 6-7 mb/d has helped to keep crude oil markets satisfactorily supplied. But global inventories are drawing down none the less. And oil products is really what the world is consuming. So if global refinery throughput stays subdued, then demand will eventually have to match the supply of oil products. The likely path forward this summer is a steady draw down in jet fuel, diesel and gasoline. Higher prices for these. Then, if possible, higher refinery throughput and higher usage of crude in response to very profitable refinery margins. And lastly sharper draw in crude stocks and higher prices for these. But some 6 mb/d of oil products used to be exported through the Strait of Hormuz. And it may not be so easy to ramp up refinery activity across the world to compensate. Especially as Ukraine continues to damage Russian refineries as well as Russian crude production and export facilities.
Watch oil product stocks and prices as well as Brent calendar 2027. What to watch for this summer is thus oil product inventories falling and oil product premiums to crude rising. Another measure to watch is the Brent crude 2027 contract as it rises steadily day by day as the Strait of Hormuz stays closed and global oil inventories decline. The latter is close to the highest level since the start of the war and keeps rising.
The Brent M1 contract and the Brent 2027 prices and current price of jet fuel in Europe (ARA). All in USD/b

Our back of the envelope calculation of the global shortage created by the closure of the Strait of Hormuz. Note that 3.5 mb/d of discharge from SPR is also a draw. Note also that ’Forced demand loss’ of 2.5 mb/d is probably temporary and will fall back towards zero as logistics are sorted out leaving ’Price demand loss’ to do the job of balancing the market. Thus a shortfall of at least 9 mb/d created by the closure. More if SPR discharge is included and more if Forced demand loss recedes.

Brent is climbing higher. Front-month is at USD 106.3/bl this morning, close to a weekly high and a USD 9/bl jump from Mondays open. This is the move we flagged as a risk earlier in the week: the market shifting from ”a deal is around the corner” to ”this is going to take longer than we thought”.

Analyst Commodities, SEB
During April, rest-of-year Brent remained remarkably stable around USD 90/bl. A stability which rested on one single assumption: the SoH reopens around 1 May. That assumption is now slowly falling apart.
As we highlighted yesterday: every week of delay beyond 1 May adds (theoretically) ish USD 5/bl to the rest-of-year average, as global inventories draw 100 million barrels per week. i.e., a mid-May reopening implies rest-of-year Brent closer to USD 100/bl, and anything pushing into June or July takes us meaningfully higher.
What’s changed in the last 48 hours:
#1: The US military has formally warned that clearing suspected sea mines from SoH could take up to six months. That is a completely different timescale from what the financial market is pricing. Even a political deal tomorrow does not immediately reopen the strait.
#2: Trump has shifted his tone from urgency to ”strategic patience”. In yesterday’s press conference: ”Don’t rush me… I want a great deal.” The market is reading this as a president no longer feeling pressured by timelines, with the naval blockade running in the background.
#3: So far, the military activity is escalating, not de-escalating. Axios reports Iran is laying more mines in SoH. The US 3rd carrier strike group (USS George H.W. Bush) is arriving with two countermine vessels. Trump yesterday ordered the US Navy to destroy any Iranian boats caught laying mines. While CNN reports that the Pentagon is actively drawing up plans to strike Iranian SoH capabilities and individual Iranian military leaders if the ceasefire collapses. i.e., NOT a attitude consistent with an imminent deal!
Spot crude and product prices eased off the early-April highs on a combination of system rerouting and deal optimism. Both now weakening. Goldman estimates April Gulf output is reduced by 14.5 mbl/d, or 57% of pre-war supply, a number that keeps getting worse the longer this drags on.
Demand-side adaptation is ongoing: S. Korea has cut its Middle East crude dependence from 69% to 56% by pulling more from the Americas and Africa, and Japan is kicking off a second round of SPR releases from 1 May. But SPRs are finite.
Ref. to the negotiations, we should not bet on speed. The current Iranian leadership is dominated by genuine hardliners willing to absorb economic pain and run the clock to extract concessions. That is not a setup for a rapid resolution. US/Israeli media briefings keep framing the delay as ”internal Iranian divisions”, the reality is more complicated and points toward weeks and months, not days.
Our point is that the complexity is large, and higher prices have only just started (given a scenario where the negotiations drag out in time). The market spent April leaning on the USD 90/bl rest-of-year assumption; that case is diminishing by the hour. If ”early May reopening” is replaced by ”June, July or later” over the next week or two, both crude and products have meaningful room to reprice higher from here. There is a high risk being short energy and betting on any immediate political resolution(!).
Down on Friday. Up on Monday. The Brent June crude oil contract traded down 5.1% last week to a close of $90.38/b. It reached a high of $103.87/b last Monday and a low of $86.09/b on Friday as Iran announced that the Strait of Hormuz was fully open for transit. That quickly changed over the weekend as the US upheld its blockade of Iranian oil exports while Iran naturally responded by closing the SoH again. The US blew a hole in the engine room of the Iranian ship TOUSKA and took custody of the ship on Sunday. Brent crude is up 5.6% this morning to $95.4/b.
The cease-fire is expiring tomorrow. The US has said it will send a delegation for a second round of negotiations in Islamabad in Pakistan. But Iran has for now rejected a second round of talks as it views US demands as unrealistic and excessive while the US is also blocking the Strait of Hormuz.
While Brent is up 5% this morning, the financial market is still very optimistic that progress will be made. That talks will continue and that the SoH will fully open by the start of May which is consistent with a rest-of-year average Brent crude oil price of around $90/b with the market now trading that balance at around $88/b.
Financial optimism vs. physical deterioration. We have a divergence where the financial market is trading negotiations, improvements and resolution while at the same time the physical market is deteriorating day by day. Physical oil flows remain constrained by disrupted flows, longer voyage times and elevated freight and insurance costs.
Financial markets are betting that a US/Iranian resolution will save us in time from violent shortages down the road. But every day that the SoH remains closed is bringing us closer to a potentially very painful point of shortages and much higher prices.
The US blockade is also a weapon of leverage against its European and Asian allies. When Iran closed the SoH it held the world economy as a hostage against the US. The US blockade of the SoH is of course blocking Iranian oil exports. But it is also an action of disruption directed towards Europe and Asia. The US has called for the rest of the world to engaged in the war with Iran: ”If you want oil from the Persian Gulf, then go and get it”. A risk is that the US plays brinkmanship with the global oil market directed towards its European and Asian allies and maybe even towards China to force them to engage and take part. Maybe unthinkable. But unthinkable has become the norm with Trump in the White House.


Sommarväder skapar prisrally på elbörsen
Oil product price pain is set to rise as the Strait of Hormuz stays closed into summer

Solkraften pressar elpriserna dagtid

Michel Gubel ger sin syn på oljemarknaden