Följ oss

Analys

SEB Jordbruksprodukter, 22 april 2013

Publicerat

den

SEB Veckobrev med prognoser på jordbruksråvaror

SEB - Prognoser på råvaror - CommodityEfter två år av avvaktande lugn på råvarumarknaden, vaknade den till liv, om man får säga så när det handlar om prisfall, i veckan som gick. BNP-tillväxten under första kvartalet i Kina kom in på +7.7%, betydligt svagare än de 8% som marknaden väntat sig. IMF reviderade ner sin prognos för global BNP-tillväxt till +3.3%. Det är den svagaste tillväxten sedan åtminstone 1980, bortsett från katastrofåret 2008. Den svaga tillväxten i världen, som nu även märks i tillväxtländer, ledde till stora prisfall på råvarumarknaden i veckan som gick.

Tendens för råvarupriserVädret i USA har fördröjt majssådden, vilket fått majspriset att hålla sig stabilt, men i gengäld påverkat sojabönorna negativt, eftersom denna gröda då tenderar att vinna areal. Kinas svagare ekonomi tyngde också sojabönorna. Handeln är annars mest väderstyrd nu och vi går igenom detta lite djupare än vanligt.

Odlingsväder

USA och Kanada är kallt, vått och snörikt. Australiens odlingsområden är torra och norr om Svarta-havet byggs ett högtryck upp. Norra Kina är torrt, där man odlar vete. I lördags (förrgår) föll temperaturen i Oklahoma ner till minus 4 grader och i New Mexico till minus fem grader. Samtidigt har över hälften av vetet börjat gå i ax, vilket gör plantan känslig för frost. Mer om detta nedan.

Vete

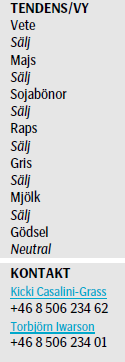
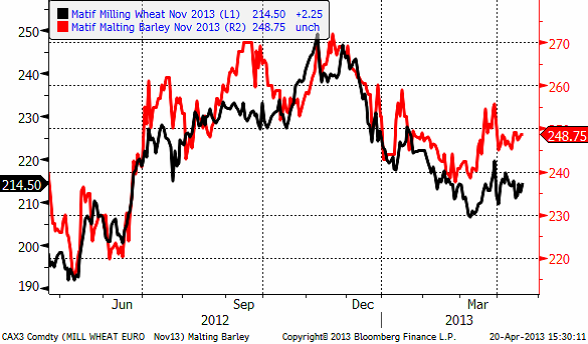
Priset på november (2013) har hållit sig över 210 euro, som nu återigen fungerar som ett tekniskt stöd. Frågan är om priset ska bryta uppåt och testa 230.

Vetepris-diagram

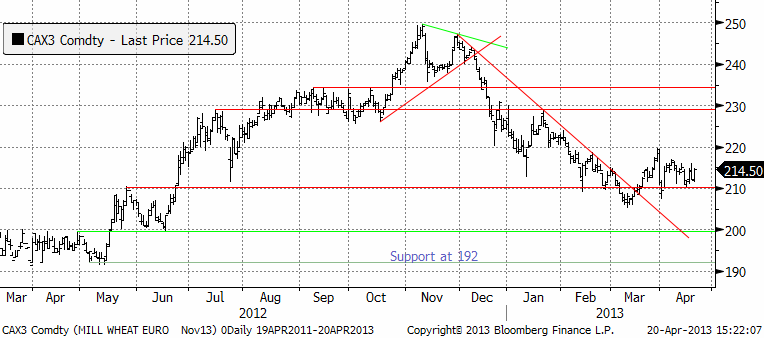
Decemberkontraktet på CBOT ser mindre ”bullish” ut än grafen för Matif-vetet. Så som Chicagovetet handlats förefaller ett test av 700 cent på nedsidan vara troligare.

Vetepris

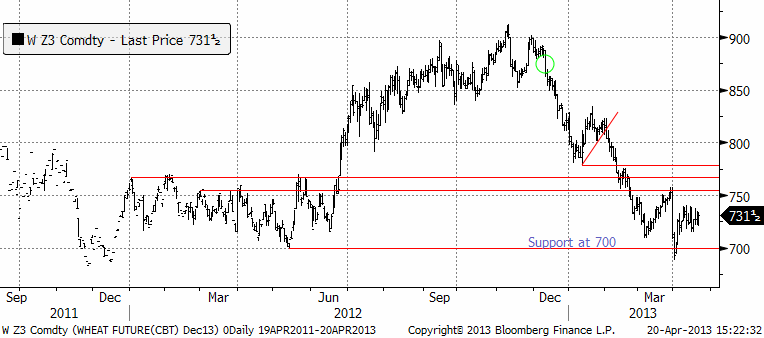
Ser vi på den senaste veckan förändring av terminskurvorna, ser vi att framförallt gammal skörd på Matif handlats ner. Det kan bero på att Tunisien faktiskt köpt ryskt vete i veckan. Det verkar alltså som om Ryssland kommit ut på exportmarknaden igen, efter att ha varit borta i nästan sex månader. I USA föll framförallt de tidsmässigt mest avlägsna leveransdatumen.

Terminskurvor för vete

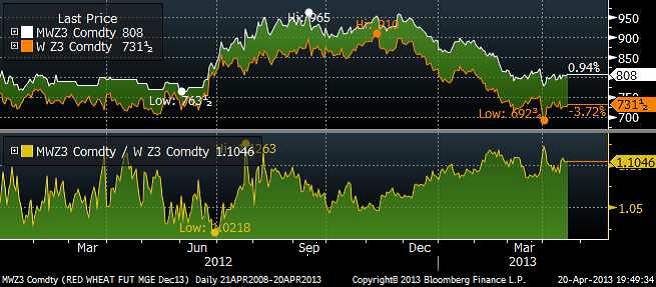
Den kalla och sena våren i USA har gjort att vårvetet på Minneapolis Grain Exchange handlats upp. I diagrammet nedan ser vi kvoten mellan priset på vårvete och chicagovete. Premien för kvalitet ökade som vi ser redan under vintern, och har legat högt – och kommer kanske att gå högre på helgens köldknäpp.

Vete-diagram

Vi ser ju faktiskt något av samma sak vad gäller maltkornet på Matif, som drar ifrån höstvetet. Strategie Grains fortsätter att justera ned sitt estimat för EU:s veteproduktion 2013/14 med ca 500 000 ton till 130 mt, vilket är den fjärde nedjusteringen i rad. Revideringen beror främst på en minskning av produktionen i Storbritannien med 330 000 ton efter förra årets katastrofala höstsådd samt lägre areal i Danmark och Spanien som resulterar i en minskning med 200 000 ton. Det blöta och kalla vädret i år har dessutom försenat höstgrödornas utveckling samtidigt som det har hämmat sådden av vårgrödor.

Estimatet för EU:s produktion plus Kroatiens, som ansluter sig och blir EU:s 28:e medlem i juli, uppgår till 131.1 mt, vilket är en nedjustering från 131.6 mt förra månaden. Men temperaturen i norra Europa, med centrum i Tyskland, har den senaste veckan legat över det normala.

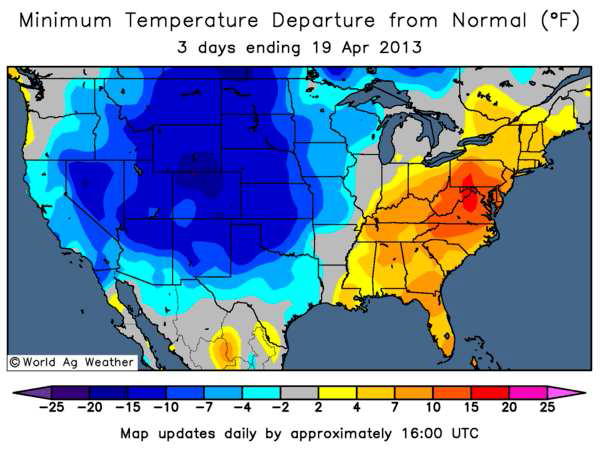
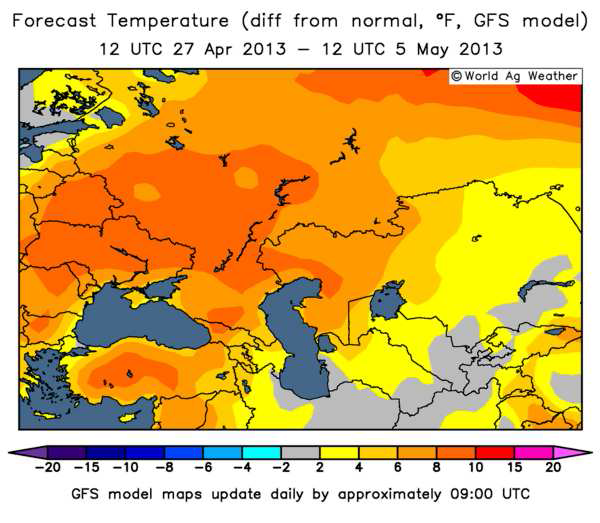
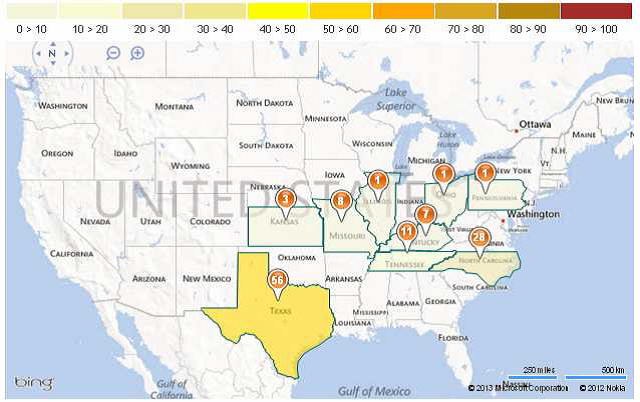
Prognosen för de närmaste två veckorna visar att värmen håller i sig. Nederbörden har också varit god och väntas vara fortsatt god. I USA har det däremot varit alarm. I Kansas, den delstat som producerar mest vete, föll temperaturen i lördags till minus 4 grader. I Texas föll temperaturen till minus 5 grader. Även Oklahoma och New Mexico berördes av frosten. Kansas, Oklahoma och Texas star för 28% av den amerikanska veteproduktionen. 68% av Oklahomas vete och 49% av Texas vete hade satt ax den 14 april enligt USDA-data. I Kansas var det bara 17% som gått i ax. Nedan ser vi de tre senaste dagarnas temperaturavvikelse från det normala. Nedan ser vi de tre senaste dagarnas temperaturavvikelse för USA.

Väder

Under tiden håller ett ordentligt högtryck på att stärkas över Svartahavsområdet (Ryssland och Ukraina) med temperaturer upp till 8 grader över det normal. Det är redan ovanligt torrt i området nord – till nordost om Svarta havet.

Väderprognos

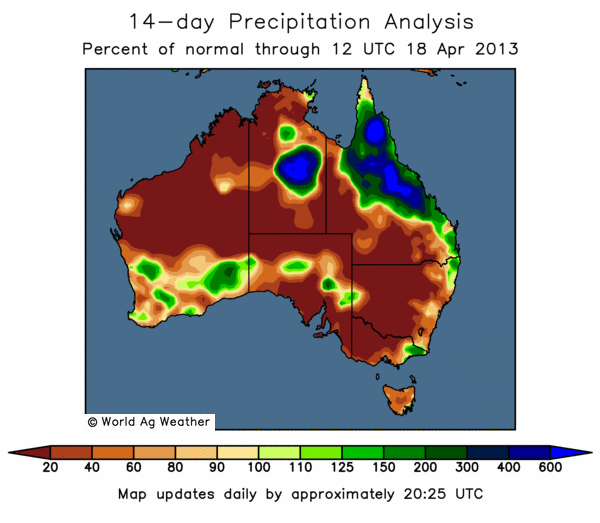
På andra sidan klotet, där vårbruket snart ska starta, är det ovanligt torrt, som vi ser av nederbördskartan nedan.

Nederbördskarta

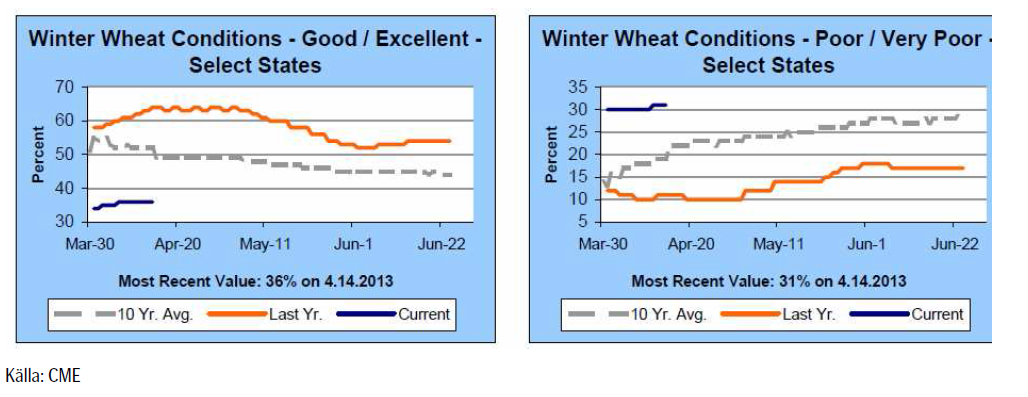
Crop progress för en vecka sedan visade oförändrat 36% i good/excellent condition.

Crop progress

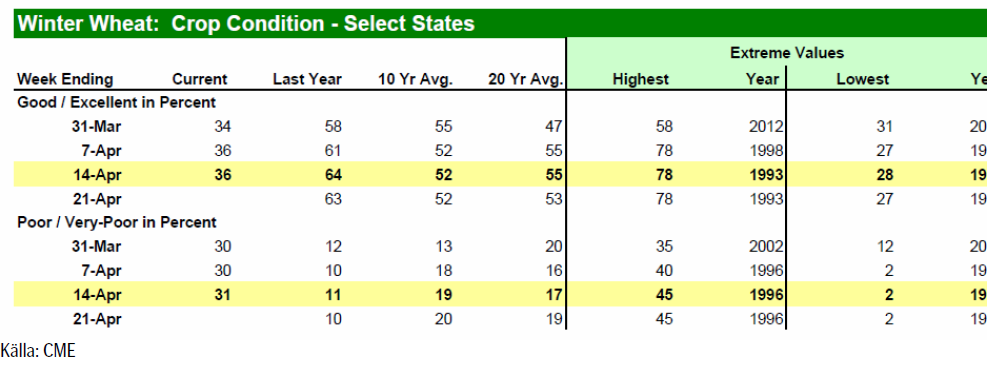
USDA bekräftar att frost har skadat somliga höstgrödor som har kommit ur vintervilan, och som då är mer utsatta för kyla. Bl.a i Kansas, oroar sig lantbrukarna över de låga temperaturernas påverkan på grödorna, men det är fortfarande för tidigt att avgöra skadornas omfattning. I måndagens Crop Progress rapport från USDA så klassas dock fortfarande 36% av det amerikanska höstvetet som ”good/excellent” vilket är oförändrat från förra veckan, men givetvis mycket lägre än förra årets 64% vid samma tid, men samtidigt bättre än vad marknaden hade förväntat sig. Andelen grödor klassade som ”poor/very poor” har dock ökat med 1% till 31%.

Vete-kvalitet

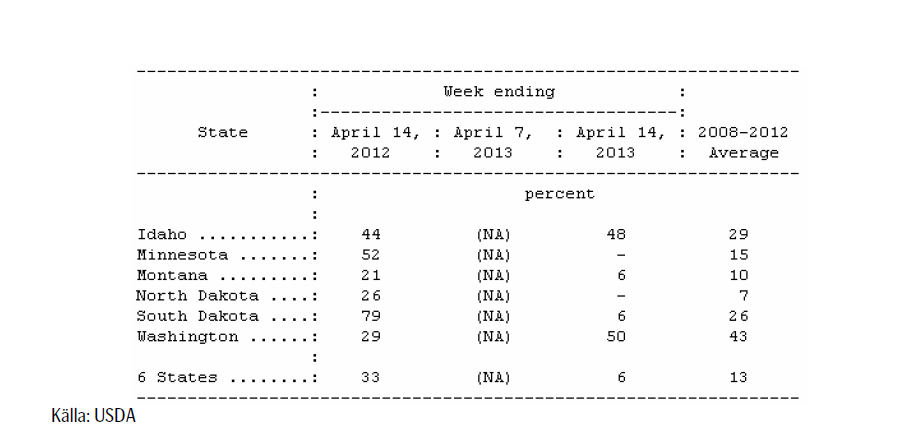
Crop Progress-rapporten visar också att sådden av vårvete i USA har fått en långsam start. 6% är i marken, vilket är att jämföra med det femåriga genomsnittet på 13% och 33% förra året, som en följd av snöfall i de norra staterna som producerar vårvete. Snön, som inte bara försenar sådden, leder också till en viss oro för översvämningar vid en snabb snösmältning framöver.

Crop progress-rapporten

Vi fortsätter tro på sidledes prisrörelse tills vidare. Vi har sett de högsta priserna för året – om det inte blir en rejäl torka i år igen. Allt annat lika bör man passa på att sälja på uppgångar tycker jag.

Maltkorn

Priset på maltkorn med leverans i november har fortsatt att visa mer styrka än höstvetet / kvarnvetet på Matif.

Maltkorn-priser

Majs

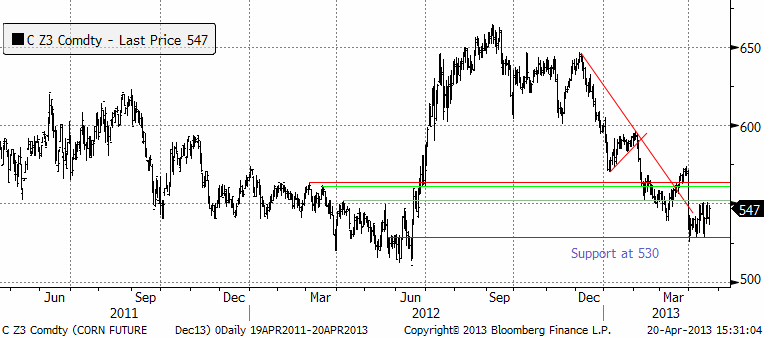
Majspriset (december 2013) har trotsat prisfallen på resten av råvarumarknaden och ligger på toppnivåer för månaden. I fredags stängde handeln i decemberkontraktet på 547 cent per bushel. Det är den låga takten i sådden som ligger bakom. I veckan var endast 2% av arealen sådd i USA, pga kallt och ogynnsamt väder. Från Argentina rapporterar BAGE att 32% är skördat.

Majstermin

Råoljepriset har fortsatt falla, men etanolpriset har stigit i veckan, vilket gett stöd för majspriset. I veckans energistatistik var etanollagren mindre, men så var även produktionen.

Prisdiagram

Strategie Grains höjer sitt estimat för EU:s majsproduktion 2013/14 med 500 000 ton till 64.6 mt som en följd av ett skifte i areal från vårkorn till majs i Frankrike, Polen och Tyskland. Estimatet för EU:s produktion plus Kroatiens uppgår till 66.5 mt, vilket är en ökning från förra månadens 66 mt. Kroatien ansluter sig till EU:s framgångsrika union och blir dess 28:e medlem från och med juli månad. Kroatien är ett land som är har ”credit rating” ”B”, har en frisk banksektor, statskulden är 60% av BNP, och livnär sig huvudsakligen på varvsindustri och säsongsturism.

Det kalla och blöta vädret i USA har också lett till att sådden av majs har fått en riktigt långsam start. USDA:s Crop Progress-rapport från den 14 april visar att amerikanska lantbrukare endast hade sått 2%, vilket är 5% lägre än det femåriga genomsnittet på 7%.

Det är också en enorm kontrast jämfört med förra året då det varma och torra vädret gjorde att 15% av sådden var avklarad vid denna tidpunkt på året.

Framförallt har vädret varit en bidragande faktor till begränsat fältarbete i Iowa och Illinois, de största producenterna av majs. I Illinois uppgick sådden till 1%, att jämföra med det femåriga genomsnittet på 12%, medan sådden i Iowa ännu inte har påbörjats.

USA-karta med texas markerat

Prisfallet har stannat av därför att sådden går långsamt. Det är vädret som styr. Om vädret förbättras och takten i sådden ökar, kan ett test av 530 cent bli aktuellt i veckan. Minns den stora arealen från prospective plantings-rapporten för ett par veckor sedan. Marknaden väntar bara på varmare och torrare väder i ”Corn belt” i USA för att sälja terminer.
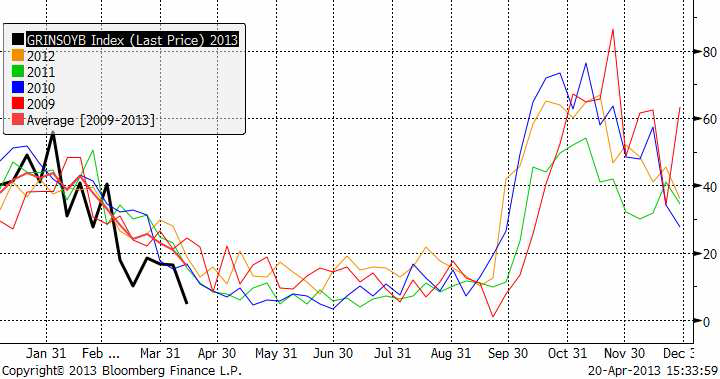
Sojabönor

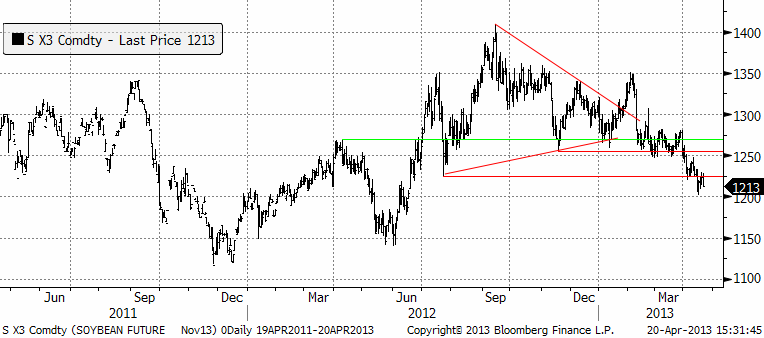
Sojabönorna (november 2013) har tagit nästa trappsteg nedåt och studsade på 1200 cent, med 1225 som övre motstånd. Chansen är stor att 1200 bryts i veckan som kommer. Det rapporterades bland annat i veckan att efterfrågan på griskött i USA utvecklas svagt och fågelinfluensan i Kina kan påverka importbehovet av sojabönor i Kina något sämre, allt annat lika. Det kalla och ogynnsamma vädret för sådden av majs i USA, där endast 2% var i backen i förra måndagens statistik, gör att mer areal kan flyttas över till soja istället. Soja sås senare än majs. På samma sätt som det amerikanska vädret ger stöd för majspriset, verkar det alltså negativt på sojapriset.

Sojabönor

Det kommer naturligtvis vanlig veckostatistik också. Nedan ser vi export inspections enligt USDA.

Export inspections enligt USDA

BAGE rapporterade att skörden var klar till 39% och behöll skördeestimatet på 48.5 mt. USDA låg förra veckan på 51.5 mt. Brasiliens skörd är till 82% färdig. Det är lite snabbare än vanligt. Abiove sänkte skördeestimatet till 82.1 mt.

USDA låg i april månadads WASDE-rapport på 83.5 mt. Conab ligger högre. Vi tror att priset kommer att fortsätta falla och rekommenderar en såld position i sojabönor.
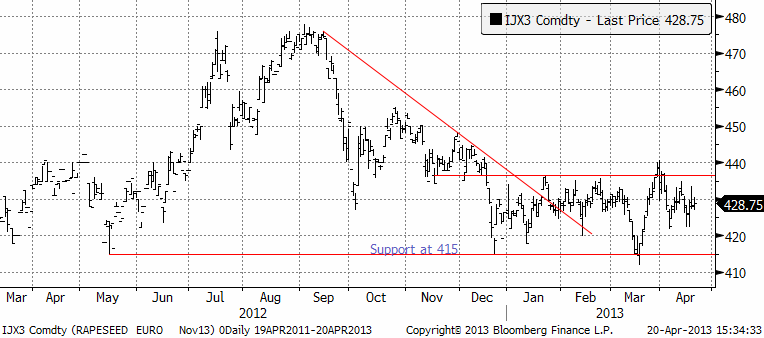
Raps

Rapspriset (november 2013) ligger kvar på någorlunda hög nivå. En anledning är att skörden i Europa väntas bli ca 1 månad senare än normalt.

Rapspris

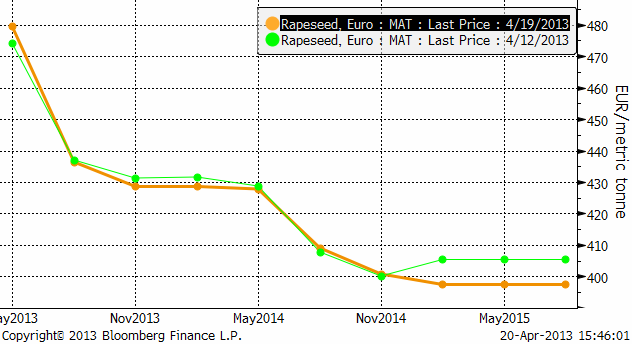
Vi ser förhållandevis små förändringar i terminskurvan från förra veckan (fredag till fredag).

Terminskurva för raps

Om vi däremot tänker att skörden blir senare än normalt, kan det påverka utbudet för augustikontraktet på Matif. Leveranser på det kontraktet kan ske hela augusti och det är normalt sett inga problem att leverera ny skörd på det. Men i år ligger skörden kanske en månad senare än normalt. I diagrammet nedan ser vi priset på novemberkontraktet dividerat med priset på augustikontraktet. Vi ser att marknaden har börjat prisa in en försening av skörden (och utbudet). Med väsentligt bättre väder i Europa i prognosen för de kommande 14 dagarna tror vi att det kan vara värt att sälja augusti och köpa november.

Rapsdiagram

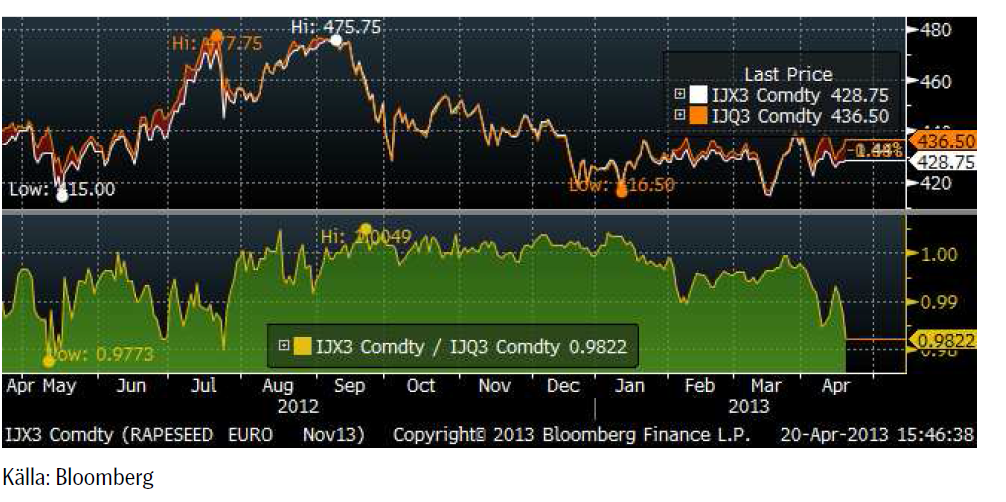
Generellt sett alltså, tror vi att en såld position i raps är bra. Vi tror också att augusti är mer säljvärd än november. Att sälja augusti och köpa november är en affär som direkt spelar på att vädret förbättras fram till skörd.

Gris

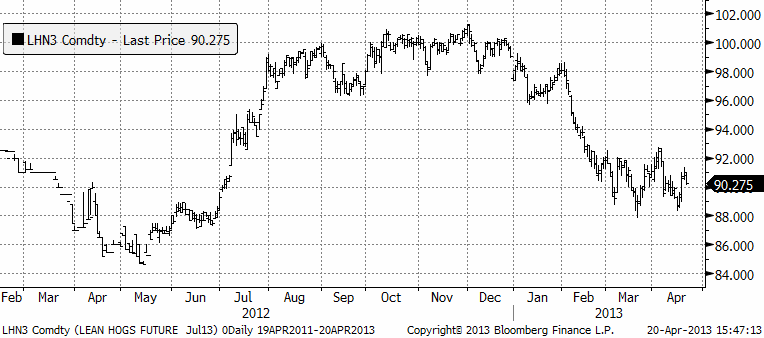
Grispriset (September 13) som har fortsatt att röra sig sidledes. Det rapporterades i veckan att efterfrågan på griskött i USA utvecklar sig svagare än väntat, vilket fick priset att falla tillbaka mot slutet av förra veckan.
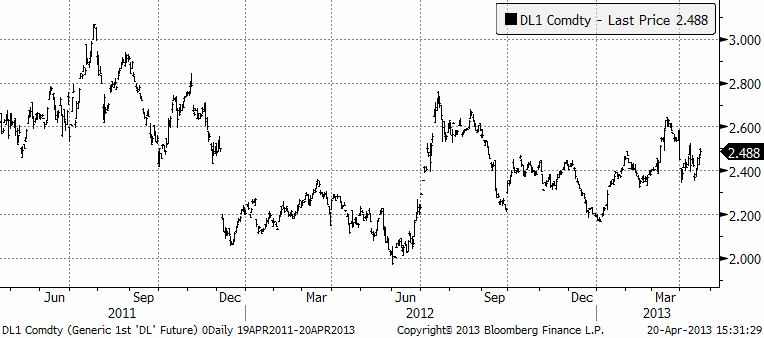
Grispris

Mjölk

Fonterras pris på SMP tvärvände ner i veckan. Priset ligger fortfarande högt. Ser vi till tidigare tillfällen när Fonterra-priset rusat, ser vi att då har nedgången varit lika kraftig som uppgången och hela den abnorma uppgången tagits ut av nedgången.

I kursdiagrammet nedan ser vi priserna på Fonterras SMP, USDA:s prisnotering på SMP i Europa och Eurex-börsens pris, samt Eurex pris på smör. Alla priser är angivna i euro per ton.

Kursdiagram för fonterra smp, eurex

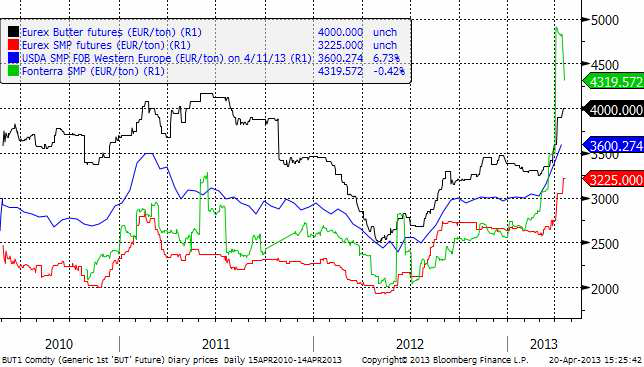
Priserna på smör och skummjölkspulver har fortsatt att stiga på Eurex. Sedan förra veckan har det implicita priset på mjölk, som man får genom att ta rätt andelar smör och SMP, stigit med 10% för leverans i maj och med 9% för leverans i juni. För leverans längre fram i tiden har det varit betydligt mindre prisrörelser.

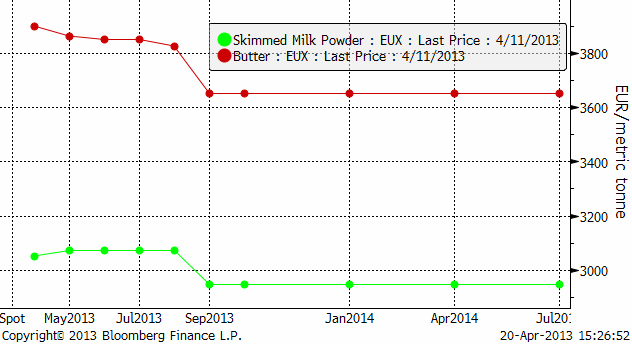
Nedan ser vi terminskurvorna för smör och skummjölkspulver på Eurex.

Skimmed milk powder och butter

SEB Commodities erbjuder ett litet ”prova-på” kontrakt som består av 0.5 ton Eurex-smör och 0.9 ton Eurex SMP. Ett paket som motsvarar 10 ton flytande mjölkråvara. Just nu är det underliggande värdet på ett sådant kontrakt drygt 33 000 kronor. Vi garanterar börspris eller bättre.

Den som vill följa priset på SMP på Eurex gör det via länken:

www.eurexchange.com/exchange-en/products/com/agr/14016/

Vi tycker att den här haussen på världsmarknaden skapar ett bra tillfälle att säkra via terminer.

[box]SEB Veckobrev Jordbruksprodukter är producerat av SEB Merchant Banking och publiceras i samarbete och med tillstånd på Råvarumarknaden.se[/box]

Disclaimer

The information in this document has been compiled by SEB Merchant Banking, a division within Skandinaviska Enskilda Banken AB (publ) (“SEB”).

Opinions contained in this report represent the bank’s present opinion only and are subject to change without notice. All information contained in this report has been compiled in good faith from sources believed to be reliable. However, no representation or warranty, expressed or implied, is made with respect to the completeness or accuracy of its contents and the information is not to be relied upon as authoritative. Anyone considering taking actions based upon the content of this document is urged to base his or her investment decisions upon such investigations as he or she deems necessary. This document is being provided as information only, and no specific actions are being solicited as a result of it; to the extent permitted by law, no liability whatsoever is accepted for any direct or consequential loss arising from use of this document or its contents.

About SEB

SEB is a public company incorporated in Stockholm, Sweden, with limited liability. It is a participant at major Nordic and other European Regulated Markets and Multilateral Trading Facilities (as well as some non-European equivalent markets) for trading in financial instruments, such as markets operated by NASDAQ OMX, NYSE Euronext, London Stock Exchange, Deutsche Börse, Swiss Exchanges, Turquoise and Chi-X. SEB is authorized and regulated by Finansinspektionen in Sweden; it is authorized and subject to limited regulation by the Financial Services Authority for the conduct of designated investment business in the UK, and is subject to the provisions of relevant regulators in all other jurisdictions where SEB conducts operations. SEB Merchant Banking. All rights reserved.

Fortsätt läsa
Annons
Klicka för att kommentera

Skriv ett svar

Din e-postadress kommer inte publiceras. Obligatoriska fält är märkta *

Analys

US inventories will likely rise less than normal in mths ahead and that is bullish

Publicerat

den

SEB - analysbrev på råvaror

US commercial crude and product stocks will now most likely start to rise on a weekly basis and not really start to decline again before in week 38. We do however expect US inventories to rise less than normal in reflection of a global oil market in a slight deficit. This will likely hand support to the Brent crude oil price going forward.

Bjarne Schieldrop, Chief analyst commodities at SEB
Bjarne Schieldrop, Chief analyst commodities, SEB

Shedding some value along with bearish metals and China/HK equity losses. Brent crude has trailed lower since it jumped to an intraday high of USD 87.7/b on 19. March spurred by Ukrainian drone attacks on Russian refineries. Ydy if fell back 0.6% and today it is pulling back another 1% to USD 85.4/b. But the decline today is accompanied by declines in industrial metals together with a 1.3% decline in Chinese and Hong Kong equities. Thus more broad based forces are helping to pull the oil price lower.

US API indicated a 5.4 m b rise in US oil stocks last week. But rising stocks are normal now onwards. The US API ydy indicated that US crude stocks rose 9.3 m b last week while gasoline stocks declined 4.4 m b while distillates rose 0.5 m b. I.e. a total rise in crude and products of 5.4 m b (actual EIA data today at 15:30 CET). That may have helped to push Brent crude lower this morning. It is however very important to be aware that US inventories seasonally tend to rise from week 12 to week 38. And from week 12 to 24 the average weekly rise is 4.1 m b per week. The increase indicated by the US API ydy is thus not at all way out of line with what is normally taking place in the months to come. What really matters is how US commercial inventories do versus what is normal at the time of year.

US commercial stocks have fallen 17 m b more than normal since end of 2023. So far this year we have seen a draw of  39 m b vs the last week of 2023. The normal draw over this period is only -22 m b. I.e. US commercial inventories have drawn down 17 m b more than normal over this period. This has been the gradual, bullish nudge on oil prices. US commercial stocks should normally rise 63.5 m b from week 12 to week 38. What matters to oil prices is thus whether US inventories rise more or less than that over this period.

Drone attacks on Russian refineries was a catalyst to release Brent to higher levels. Brent crude broke out to the upside on 13 March along with the Ukrainian drone attacks on Russian refineries. Some 800 k b/d of refining capacity was hurt and probably went off line. But in the global scheme of things this is a mere 1% or so of total global refining capacity. And if we assume that it is off line for say 3 months, then it equates to maybe 0.25% impact on global refining activity in 2024 which is easy to adapt to. Refining margins have not moved  much at all. ARA spot diesel cracks are now USD 2.25/b lower than it was in 12 March 2024. Thus no crisis for refined products at all.

We’ll probably not return to pre-drone attack price level of USD 82/b any time soon. Though a dip to that price level is of course not at all out of the question. The oil market may send the oil price lower in the short term since very little material impact in the global scope of things seems to follow from the drone attacks on Russian refineries. Our view is however that the attacks were more like a catalyst to release the oil price to the upside following a steady and stronger than normal decline in US commercial inventories. I.e. the latest price gains in our view is not so much about an added risk premium in the oil price but more about oil price finally adjusting higher according to the fundamentals which have played out since the start of the year with stronger than normal declines in US commercial inventories. We thus see no immediate return to pre-drone-attack price level of USD 82/b. Rather we expect to see continued support to the upside through steady, gradual inventory erosion versus normal like we have seen so far this year.

Voluntary cuts by Russia in Q2-24 could be bullish if delivered as promised. Earlier in March we saw Russia’n willingness to cut back supply in Q2-24 in a mix of production restraints and export restraints. Saudi Arabia and Russia are equal partners in OPEC+ with equal magnitudes of production. In a reflection of this they set equal baselines in May 2020 of 11.0 m b/d. Saudi Arabia produced 9.0 m b/d in February while Russia produced 9.4 m b/d. This is probably why Russia in early March stated that they were willing to cut back in Q2-24. To align more with what Saudi Arabia is producing. It has been of huge importance that Saudi Arabia last year cut its production down to 9.0 m b/d and thus below Russian production. This reactivated Russia as a dynamic, proactive participant in OPEC+. The actual effect of proclaimed production/export cuts by Russia in Q2-24 remains to be seen, but calls for USD 100/b as a consequence of such cuts have surfaced.

So far we haven’t lost a single drop of oil due to Houthie attacks in the Red Sea. We have lost some up-time in Russia refining due to Ukrainian drone strikes lately. But nothing more than can be compensated elsewhere in the world. Temporarily reduced volumes of refined hydrocarbons from Russian will instead lead to higher exports of unrefined molecules (crude oil).

For now OPEC+ is comfortably controlling the oil market and the market will likely be running a slight deficit as a result with inventories getting a continued gradual widening, negative difference versus normal levels thus nudging the oil price yet higher. SEB’s forecast for Brent crude average 2024 is USD 85/b. This means that we’ll likely see both USD 90/b and maybe also USD 100/b some times during the year. But do make sure to evaluate changes in US oil inventories versus what is normal at the time of year. Rising inventories are bullish if they rise less than what is normal from now to week 38.

US commercial crude and product stocks will likely rise going forward. But since the global oil market is likely going to be in slight deficit we’ll likely see slower than normal rise in US inventories with an increasing negative difference to normal inventory levels.

US commercial crude and product stocks
Source: SEB calculations and graph, Blbrg data feed, EIA data

Total US crude and product stocks incl. SPR are now 4 m b below the low-point from December 2022

Total US crude and product stocks incl. SPR
Source: SEB graph and calculations, Blbrg data feed, EIA data
Fortsätt läsa

Analys

From surge to slump for natural gas: Navigating the new normal in Europe

Publicerat

den

SEB - analysbrev på råvaror

Over the past 4-5 months, EU natural gas prices, indicated by the TTF benchmark, have plummeted by 50% from an October high of EUR 56/MWh to the current EUR 28/MWh for the front-month contract, defying expectations of seasonal price increases. This downturn can be attributed to robust EU inventories at 59% capacity and persistently subdued natural gas demand, down by 11% compared to historical norms. Mild weather in Northwest Europe and a prolonged industrial recession have suppressed consumption, resulting in a significant gas surplus despite nearing the end of the winter heating season (90% complete). These factors collectively exert downward pressure on prices.

Ole R. Hvalbye, Analyst Commodities, SEB

The correlation between Brent and TTF prices remains from times partly “fluid”. In our December 2023 natural gas price update, we predicted a constrained global natural gas market, anticipating a swift resurgence in demand following a decline in gas prices. Our projections were underpinned by a robust Brent Crude price outlook, set at USD 85/bl, USD 87.5/bl, and USD 90/bl for 2024, 2025, and 2026 respectively, with a Crude-to-gas rate of 80%. However, this scenario has yet to materialize as the anticipated demand recovery has been notably delayed, requiring even lower prices than initially predicted for its realization—a phenomenon unique in recent memory.

Achieving a global natural gas price convergence towards levels more aligned with Brent Crude appears plausible, signaling a return to a measure of normalcy. The absence of a winter premium during the 2023/24 winter season suggests a healthier outlook for Q2-24, mitigating the risk of substantial short-term price spikes in European gas markets. The sporadic spikes witnessed in 2022 and partially in 2023 are now a thing of the past, indicating a change from the volatility experienced in recent years.

Short-term EU gas prices hinge heavily on immediate weather patterns and industrial gas demand, both exerting considerable influence on inventory levels, which serve as a critical gauge of supply and demand dynamics. Looking further ahead, the trajectory of prices is linked with the global LNG balance, particularly contingent upon factors such as projected US natural gas production and the capacity of US LNG exports to the global market.

Moreover, the declining influence of Russia on the European gas market is notable, with sporadic gas export halts from the former energy powerhouse carrying reduced impact. Global market recalibrations indicate a sustained elevation in price levels, with EUR 30/MWh emerging as a feasible benchmark for the foreseeable future. We also call “the end of the energy crisis”, as the worst is history. Reflecting on the current year, EU TTF prices hit the lowest point in late February, with expectations of a potential slide/climb from current prices at EUR 28/MWh.

In essence, our current natural gas price forecast hinges on a delicate equilibrium among three pivotal factors. Firstly, the TTF price must strike a balance, remaining sufficiently low to stimulate a resurgence in demand. For context, the historical average real price hovers around EUR 27/MWh, with EUR 30/MWh anticipated to gradually encourage demand recovery, thereby mitigating the effects of demand destruction. Secondly, the TTF price should maintain a relatively ”normal” relationship with Crude prices, as historical trends indicate a natural correlation between the two. A notably low rate would invariably attract heightened interest from Asian markets, as LNG emerges as a cost-effective alternative to oil in terms of energy content. Lastly, the TTF price must also exhibit a level of elevation to cover the expenses associated with producing and transporting US natural gas to the European market. This entails factoring in costs related to Henry Hub, tolling fees, liquefaction, transportation, and regasification, among other associated expenses. Achieving a delicate equilibrium among these factors is vital for ensuring the stability and sustainability of natural gas pricing dynamics in the European market.

Consequently, our current stance reflects a delicate balancing act among these three critical factors. Settling on EUR 30/MWh, we predict that prices lower than this threshold would catalyze a swifter demand resurgence, while simultaneously enhancing the appeal of natural gas against oil as the spread widens. Moreover, importation from the USA would encounter mounting challenges as prices decline, particularly approaching the EUR 25/MWh mark when landed in ARA.

The TTF market has been complexly interlinked with the global LNG market at the margins since 2015, many years before the energy crisis. While the proportion of LNG consumed in Europe has surged significantly, the concept of LNG prices influencing TTF prices at the margin is not new. However, in terms of volume, the current situation declares us notably more vulnerable than in previous years.

In our updated projections, we have revised our price forecasts downward, particularly notable at the front end, encompassing Q2-24, Q3-24, and the Full-year (FY) 2024. Other adjustments, though marginally smaller, remain for FY 2025, 2026, and 2027. Despite these reductions, we anticipate a trajectory of increasing European natural gas prices from their current levels. Notably, Q1-24 is now expected to average EUR 27/MWh, followed by predictions of EUR 25/MWh, EUR 28/MWh, and EUR 32/MWh for Q2-24, Q3-24, and Q4-24 respectively. Consequently, the average for FY 2024 is forecasted at EUR 28/MWh, marking a notable decline from the previous estimate of EUR 40/MWh.

In our outlook for longer-term pricing, we anticipate an average of EUR 30/MWh for the years 2025, 2026, and 2027—a reduction of EUR 10/MWh compared to our previous update in December 2023, which projected EUR 40/MWh. This long-term forecast only sits marginally higher, by EUR 3-4/MWh, than the historical average real price of approximately EUR 27/MWh. Such pricing aligns intending to stimulate further demand recovery and maintain consumer affordability within the European economy. Reflecting on historical trends, previous price levels in the European market might be seen as reliant on potentially risky agreements with Russia. Consequently, the era of exceptionally low-cost energy is drawing to a close, indicating a new paradigm where European gas and power are priced slightly higher, establishing a ”new normal” for the foreseeable future.

TTF spot prices

PRICE ACTION

The absence of a winter premium for global natural gas is notable. Our longer-term natural gas price projection, set at EUR 30/MWh, demonstrates resilience compared to historical market norms. Last quarter (Q4-23) closed at EUR 43/MWh for the front-month contract, a figure approximately EUR 10/MWh lower than our recent expectations. Noteworthy market adjustments have transpired not only within the European gas market but also on a global scale. This ongoing adaptation is expected to continue influencing the gas market into 2024, resulting in fewer severe price spikes and a return to more normal price differentials.

Global natural gas prices, EUR/MWh

Maintaining our gas price forecast at EUR 30/MWh for 2025 suggests an expectation for European natural gas prices to stabilize at current market rates. This projection extends to 2026 and 2027, which stand roughly 30% higher than historical norms – a contrast to the previous era of favorable deals with Russia flooding European consumers with low-cost piped natural gas.

Considerable attention is drawn to the relationship between gas and oil prices. With our oil market outlook projecting USD 85/bl, USD 87.5/bl, and USD 90/bl for 2024, 2025, and 2026 respectively, the convergence of gas prices to more normal circumstances implies a corresponding alignment with oil prices. Historically, EU natural gas prices have traded at 0.55-0.6 times Brent crude prices, a figure that is expected to converge closer to historical norms. However, our forecasts for 2024, 2025, and 2026 slightly exceed historical norms, at 0.62 x Brent, 0.65 x Brent, and 0.62 x Brent respectively, reflecting a tighter natural gas balance in the coming years.

The transformation of global LNG trade, from roughly 5% spot and short-term LNG trade in 2000 to roughly 30% in 2023, underscores a higher degree of flexibility in negotiating spot and short-term LNG contracts. This evolution suggests a shift towards contracts potentially decoupled from Brent indexations, challenging the conventional reliance on oil prices as a benchmarking tool for global natural gas prices.


US LNG

A significant surge in global liquefaction (export) capacity is anticipated from the US and Qatar starting in 2026 and beyond. These large-scale liquefaction projects typically entail long-term contracts with predefined off-takers or demand centers, primarily serving power plants or industrial applications. The transportation of substantial LNG volumes from the US to Europe underscores strategic economic and energy considerations. The US, propelled by abundant shale gas resources and extensive LNG liquefaction infrastructure, has emerged as a major LNG exporter. Europe, seeking to diversify energy sources and reduce dependence on Russia, offers an attractive market for American LNG. Additionally, LNG’s flexibility as a cleaner-burning fuel aligns with Europe’s environmental sustainability objectives and transition away from coal.

The transatlantic LNG trade between the US and Europe capitalizes on arbitrage opportunities driven by regional gas price variations and demand-supply imbalances. This flow not only enhances energy security for European nations but also aids NE Asia in meeting environmental obligations.

The US-Europe netback for LNG cargo depends on various economic factors, including global natural gas prices, US regional supply and demand dynamics, and fluctuations in shipping costs.

The competitiveness of US LNG in the European market is influenced by several factors, including the US benchmark price for domestic natural gas (Henry Hub), source gas costs, voyage costs, shipping costs, and regasification costs at the destination.

In more detail the competitiveness of US LNG in the European market is influenced by factors such as the US benchmark price for domestic natural gas (Henry Hub); Source gas cost (Henry Hub + Tolling fee and liquefaction fee); voyage cost (Insurance, port, canal, boil-off, and fuel cost); shipping cost at day rate; and regasification cost in the other end.

A simplified calculation demonstrates the US-EU arbitrage opportunity. At current market figures, the total cost of delivering LNG from the US to Europe is roughly USD 7.05/MMBtu or approximately EUR 22/MWh. Comparatively, the EU TTF front-month contract trades at EUR 28/MWh, indicating an average EUR 6/MWh arbitrage opportunity and an equal profit margin for traders. However, with state-of-the-art LNG vessels, the total cost could decrease significantly, resulting in a substantial profit margin for traders.

The calculation (with current market figures all in USD per MMBtu as a standard unit):
Front-month Henry Hub (1.65) + 15% tolling fee (0.25) and liquefaction fee for conventional LNG ships (2.5) + Insurance, port, and canal (on average 0.33) + boil-off and fuel cost (on average 1.2) + regasification (0.5) + shipping cost at current day rate (0.62).

i.e., for total cost from the US to Europe we get 1.65 + 0.25 + 2.5 + 0.33 + 1.2 + 0.5 + 0.62 = USD 7.05/MMBtu – or roughly EUR 22/MWh. At the time of writing, the EU TTF front-month contract is trading at EUR 28/MWh. Hence, in the current spot market, the US-EU arbitrage is at roughly on average EUR 6/MWh and equally EUR 6/MWh profit to trader. However, this is a conservative estimate. In a situation with a state-of-the-art MEGI / X-DF LNG vessel, we would have a lower liquefaction fee and per unit insurance, boil-off, and fuel cost, which would imply a total cost of USD 6.0/MMBtu (EUR 18.5/MWh) – consequently, a massive EUR 9.5/MWh profit to the trader. Understating the massive economic argument in shipping LNG from the US to the EU (at current market rates).

But even though a substantial arrival of LNG export capacity in the US is approaching, it is not like the US has unlimited natural gas production, or unlimited LNG capacity to feed the global thirst for LNG. Hence, it is not like the EU TTF will plunge to levels comparable to the US Henry Hub + all associated costs for delivering to the EU.

A substantial surge in LNG export capacity is imminent, fueled by significant investments totaling USD 235 billion directed towards upcoming super-chilled fuel projects since 2019. The majority of these projects are slated to come online from the second half of 2025 onward, with an additional USD 55 billion investment expected by 2025, driving a remarkable 45% surge in LNG liquefaction capacity by the end of the decade.

Currently, the global LNG export market boasts a total capacity of approximately 420 million tonnes, projected to expand significantly to 610 million tonnes by 2030. The bulk of this expansion will stem from Qatar, Russia, and the US, with capacities increasing by roughly 23, 26, and 117 million tonnes respectively from 2024 to 2030.

However, it’s worth noting that on January 26, 2024, the Biden Administration paused LNG exports to non-FTA countries, awaiting updated analyses by the DOE. This affects 4 major projects and risks WTO challenges. The DOE cites outdated assessments, signaling a policy shift and raising market uncertainties.

This pause could have significant geopolitical and trade implications, as it also becomes an election issue. Stakeholders, including exporters and developers, now face uncertainties and must review agreements. Overall, the pause prompts a broader review of LNG export policies, impacting domestic and international markets. However, it’s too early to fully assess its impact, so the aforementioned capacity forecast remains firm for now.

The industry’s confidence is underpinned by the anticipation of rising LNG demand, driven by Europe’s efforts to reduce reliance on Russian gas and Asia’s shift away from coal, particularly in China. Yet, this expansion is not merely speculative; it represents a long-term commitment between suppliers and off-takers. These projects typically entail long-term contracts of 20+ years, often supplying power plants or industrial applications. Consequently, the new LNG export capacity is expected to match a similar scale of demand.

The significant export ventures from the United States to Qatar will further cement LNG’s role in the global energy landscape, with contracts extending well into the 2050s, even surpassing some carbon-neutral targets.

Moreover, there remains ample room for natural gas in the long run. The COP28 acknowledged that transitional fuels like LNG can facilitate the energy transition, signaling implicit support for LNG over dirtier fossil fuels.

Critics argue that natural gas isn’t the most environmentally friendly fossil fuel due to potential methane leakage along the supply chain. However, such concerns arise belatedly as the wave of new facilities is already underway. With oil demand reaching its peak and coal declining gradually, gas is expected to maintain its prominence in the energy mix.


SUPPLY & DEMAND

In the short term, the winter wildcard/premium is gone, pointing to a healthier Q2 2024. We have, a while back, pinpointed that the European natural gas market is in a limbo state between supply uncertainties and demand uncertainties. With a consequence of a winter wildcard largely being balanced by the short/medium-term weather and withdrawal rate of European natural gas inventories.

Recent weather forecasts predict slightly colder temperatures in early April across Northwest Europe, but the preceding winter months saw normal to milder conditions, resulting in lower-than-expected inventory drawdowns and weak price trends.

Looking ahead, forecasts for April to June 2024 suggest above-normal temperatures in Northwest Europe, reducing heating and power demand and maintaining subdued gas consumption. Prices in Q2-24 are forecasted to average around EUR 25/MWh.

Daily LNG imports - Europe

Furthermore, it is easy to think of the faded energy crisis as a European crisis. But the adaptation for global gas markets has been equally/more important. Very high global gas prices have resulted in adaption in all corners of the globe, consequently, easing the global natural gas balance and freeing more gas volumes to the highest bidder at more “reasonable” prices. During the peak of the crisis, the highest bidder was naturally Europe which was sucking up all excess global LNG volumes. However, at the current price levels, the “three importing giants”, namely China, South Korea, and Japan have finally woken up, and are no longer “re-routing” their LNG cargos, while also actively participating in the short-term/spot market.

Russia’s grip over the EU is expected to weaken in the spring/summer of 2024. Since February/March 2022, President Putin sought to balance revenue generation and geopolitical pressure by controlling the energy supply to the EU. This strategy faced challenges: reducing exports to zero would jeopardize revenue, while high exports would alleviate the EU’s energy crisis, as seen in winter 2022/23. Despite efforts, Putin’s goal of using natural gas as a strategic tool faltered in winter 2023/24.

Russia - Europe pipeline flow of natural gas

Market adaptation ensued. Since December 2022, Russian piped gas supply to Europe has fluctuated between 10-25% of historical averages, currently nearing 20%. To intensify geopolitical pressure, Russia may need to further reduce flows, possibly to around 10% in winter 2024/25. Despite the distant outlook, the market has already factored in potential price increases for next winter.

Two main pipelines deliver Russian gas to Europe: ”Turkstream,” to Turkey, and the ”Brotherhood,” through Ukraine to Slovakia. These pipelines each contribute roughly 50% of the 0.75 TWh per day flow. The pipeline via Ukraine faces physical risks, and a supply halt is likely next winter as the transit agreement between Gazprom and Naftogaz expires in December 2024, with little chance of renewal.


EU INVENTORIES

The trajectory of EU natural gas inventories for the upcoming summer is primarily influenced by both the global LNG market and European natural gas demand. In Q2-23 (one year ago), inventories commenced the injection season at an all-time high, leading to the current record-high inventory status. These comfortable inventories suggest the EU has the situation under control as it emerges from the winter season. Currently, inventories stand at 59%, a substantial 25% above the 2015-2022 average.

European natural gas inventories

Despite missing out on over 1,000 TWh of natural gas imports from Russia compared to historical levels, the mild winter of 2022/23, reduced demand due to high prices, and increased LNG imports compensated with an additional 1,400 TWh. This over-compensation of 400 TWh in Q1-23 facilitated an unprecedented injection rate into European inventories during Q1 and Q2 2023. As a result, European inventories shifted from a deficit of 180 TWh in January 2022 to a surplus of 259 TWh in April 2023, leading to the current record-high levels.

However, if NE Asia, predominantly led by China, continues to outbid the EU for LNG cargo and industrial gas demand increases due to favorable long-term hedging levels, current comfortable inventory levels will gradually return to normal. This suggests EU TTF prices will slowly climb towards over EUR 30/MWh by the next heating season, a trend partly factored into current pricing.

While the crisis urgency has faded, market adjustments now activate at lower price thresholds. Nonetheless, we anticipate slightly higher long-term price levels (EUR 30/MWh) due to increasing LNG bids from China (+NE Asia), a rebound in EU demand, and reduced LNG imports influenced by lower prices. This will result in a slower inventory build during Q2-24 and Q3-24 compared to last year. Despite diminishing supply from Russia, the EU remains focused on maintaining preparedness for future winters, leading to a new normal in natural gas inventory levels throughout the year.

The European energy crisis has significantly eased during 2023 and Q1-24. Softened front-end prices influence longer-dated prices, with the winter premium/seasonality fully washed out during the ongoing heating season. Healthy EU natural gas inventories, currently at 59% capacity (675 TWh) and surpassing the European Commission’s target of reaching 90% storage fullness by 1 November, contribute to this subsiding crisis. Continued subdued European consumption (11% below historical averages) and robust LNG imports set a ceiling on short-term prices, although increased EU demand could quickly alter this scenario, as EU demand has proven stickier than anticipated.

DEMAND RECOVERY

Reduced uncertainty and lower prices are expected to lead to more long-term hedging. Since the start of Q1 2024 (year-to-date), the TTF spot has averaged EUR 27/MWh, approximately USD 50/boe, only marginally below the ’historical norm’ when adjusted for inflation. Despite these price levels, a resurgence in European industrial gas consumption during the winter is not straightforward.

EU natura gas demand recuction vs normal

Industrial gas demand remains subdued, sitting 11% below historical averages. While this marks an improvement from the 25-30% drop experienced in mid-summer 2022 – a period characterized as the ”peak of the crisis” – when spot prices consistently traded at EUR 150/MWh (USD 255/boe).

The slower-than-expected recovery is largely attributed to industries hesitating to commit to longer-term prices. For example, during Q4 2023, despite tumbling spot prices, futures prices remained strong. In mid-October, gas for delivery in January 2024 was priced at EUR 55/MWh (USD 103/boe). Thus, during Q4 2023, peak-winter prices maintained a considerable premium over spot prices to a large extent.

However, the current landscape has changed. The winter premium has diminished as we exit the heating season, and weak spot prices predominantly drive forward. This reflects a market that is more certain and willing to forecast futures during a less turbulent phase. The convergence and narrowing gap between spot and long-term prices signify that ”peak natural gas has passed.” Major consumers in Europe are expected to adopt more long-term hedging for longer-term prices, ideally hedging these futures close to current spot prices. This suggests that current market prices will likely trigger increased consumption compared to Q3 and Q4 2023, although a full-scale comeback will take time.

As previously noted, substantial demand destruction occurred not only in Europe but also globally, particularly in Asia. Over the last couple of years, demand destruction amounted to approximately 800 TWh per year, while the normal growth rate in the global LNG market is 200 TWh per annum. This indicates that most of the demand will eventually return, although the timing remains uncertain. 


NE ASIAN LNG

EUR 25/MWh presents a favorable ”buy opportunity,” and prices are expected to either slide or climb from this point. The decline in prices can be attributed to sustained low demand and high inventories. We anticipate prices to either slide or increase from here, with minimal downside, as prices are likely to find support around EUR 25/MWh.

Forward prices for both JKM and TTF indicate that the NE Asian LNG market will remain a preferred destination for marginal LNG cargo in the near term. While the EU previously heavily relied on NE Asia, the European market can no longer solely depend on the economic vulnerabilities of NE Asia or China.

LNG arbitrage

A long-awaited pent-up demand for energy in China would lead to increased demand for goods and services, consequently boosting energy consumption, particularly natural gas, primarily in the form of LNG. In such a scenario, the JKM may command a larger premium over the TTF than the existing EUR 2.5/MWh (3-month rolling contract). This would divert LNG spot cargoes away from Europe, further reducing the EU’s natural gas surplus. Thus, the ongoing recovery in China’s economy is likely to stimulate Asia’s demand for natural gas, potentially resulting in EU LNG purchasers paying a premium to secure essential LNG imports in the future.

Daily LNG imports NE Asia

With current prices, we anticipate an increase in EU demand coupled with a decrease in EU LNG imports. This trend may persist until we observe a slight shortfall in compensation relative to the natural gas deficit from Russia, which could drive prices upward during the summer.


KEY TAKEAWAYS

The ongoing transition from coal to natural gas signifies a significant shift in the global energy landscape. Natural gas emerges as a crucial bridging technology, offering a cleaner alternative to coal and facilitating the transition toward widespread adoption of renewable energy sources. This transition underscores the environmental benefits of natural gas, positioning it as a pivotal component in mitigating climate change and reducing greenhouse gas emissions.

Despite challenges such as the reduction in Russian gas supply, the natural gas market is adapting rapidly. Europe, in particular, faces competition for global LNG volumes, primarily sourced from the US and Qatar. The market’s ability to swiftly adjust reflects its adaptability and resilience on a global scale, highlighting the importance of diversifying energy sources and supply routes.

Our current natural gas price forecast relies on achieving a delicate equilibrium among key factors. This includes stimulating demand, maintaining a correlation with crude prices, and ensuring cost coverage for US natural gas transportation. Striking this balance is essential for maintaining stability and sustainability in European gas pricing dynamics, ensuring energy security.

In response to changing market conditions, we have revised our price outlook downward for the short term, notably for Q2-24, Q3-24, and FY 2024. Specifically, Q1-24 is forecasted to average EUR 27/MWh, followed by predictions of EUR 25/MWh for Q2-24, EUR 28/MWh for Q3-24, and EUR 32/MWh for Q4-24. However, prices are expected to gradually increase over the longer term, with an average forecast of EUR 30/MWh for the years 2025, 2026, and 2027, slightly higher than historical averages.

This revised outlook reflects the evolving nature of the natural gas market and the need for flexibility in response to changing geopolitical landscapes and supply dynamics. Looking ahead, natural gas remains a crucial bridge over coal, facilitating the transition towards cleaner energy sources.

Fortsätt läsa

Analys

Fed cuts ahead bolstering oil prices

Publicerat

den

SEB - analysbrev på råvaror

Initially, Brent Crude experienced a decline yesterday following the release of US crude inventories data. However, nationwide US crude inventories, excluding those held in the Strategic Petroleum Reserve (SPR), saw a decline for the second consecutive week, remaining below the five-year seasonal average. Additionally, there was a larger-than-expected decline in gasoline holdings. While the overall draw presents a bullish narrative, it required some support from yesterday’s Federal Reserve announcement to trend in a positive direction.

Ole R. Hvalbye, Analyst Commodities, SEB

The Brent Crude front-month contract strengthened before yesterday’s close and has continued this positive momentum into today, currently trading at USD 86.5 per barrel. This reflects an increase of roughly USD 1 per barrel (1%) compared to yesterday evening’s low point.

The Federal Reserve signaled its intention to adhere to its outlook for three rate cuts this year, boosting both risk appetite and weakening the US dollar, which has benefited global crude prices.

In our analysis, global crude prices are currently supported by strong fundamentals. Demand growth remains robust, complemented by significant production cuts by OPEC+ and subdued output from US shale oil producers. Consequently, the global oil market is operating at a slight deficit, resulting in a gradual depletion of oil inventories, as evidenced by the recent declines in US crude and product inventories (further details below). This trend is expected to provide support for oil prices and potentially drive them sideways to upwards, with limited downside risks.

However, it’s important to note that while fundamentals appear promising and the oil market has found some reassurance in yesterday’s Federal Reserve announcement, expectations for enduring inflation may act as a headwind for oil prices over the longer term, potentially capping a significant oil price rally.

As a reminder, our assumptions for Brent oil prices have remained firm since September 2023. We anticipate Brent Crude to average USD 85/bl and USD 87.5/bl for 2024 and 2025, respectively, with projections of USD 90/bl for 2026 and 2027.


Yet another week of drawdown in US inventories. Commercial crude oil inventories in the U.S., excluding those held in the Strategic Petroleum Reserve, decreased by 2.0 million barrels from the previous week, reaching a total of 445.0 million barrels. This figure is approximately 3% below the five-year average for this time of year.

Total motor gasoline inventories saw a significant decline of 3.3 million barrels from the previous week, now standing approximately 2% below the five-year average. However, distillate fuel inventories experienced a marginal increase of 0.6 million barrels, remaining roughly 5% below the five-year average. Meanwhile, propane/propylene inventories rose by 0.4 million barrels, reaching a notable 9% above the five-year average.

Overall commercial petroleum inventories witnessed a decrease of 6.1 million barrels last week. Total products supplied over the last four-week period averaged 20.1 million barrels per day, indicating a 2.2% increase from the same period last year.

Motor gasoline product supplied averaged 8.8 million barrels per day over the past four weeks, showing a marginal increase of 0.3% from the same period last year. Conversely, distillate fuel product supplied averaged 3.7 million barrels per day, down by 1.9% from the same period last year. Jet fuel product supplied experienced a slight decrease of 0.2% compared to the same four-week period last year.

Fortsätt läsa

Populära