

Analys
SEB Jordbruksprodukter, 18 mars 2013

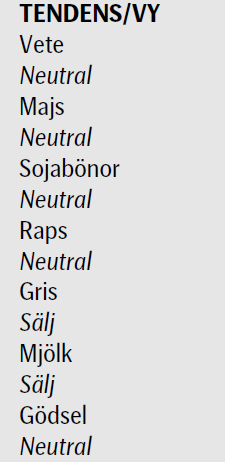
 Prisfallet på spannmål har stannat av och såväl Chicago som Matif hade en av sina bättre veckor på länge. Sojabönorna med rapsfröet i släptåg gick åt motsatt håll, men båda håller sig ännu över sina respektive tekniska stödnivåer. Terminer på mjölkprodukterna smör och SMP steg på den tyska börsen Eurex. På tisdag får vi resultatet av Fonterras senaste auktion.
Den 28 mars är det dags för kvartalsstatistiken från det amerikanska jordbruksdepartementet. Klockan 17 den dagen presenteras uppdaterade siffror på ”prospective plantings” för vete och majs och lagerstatistiken per den första mars.
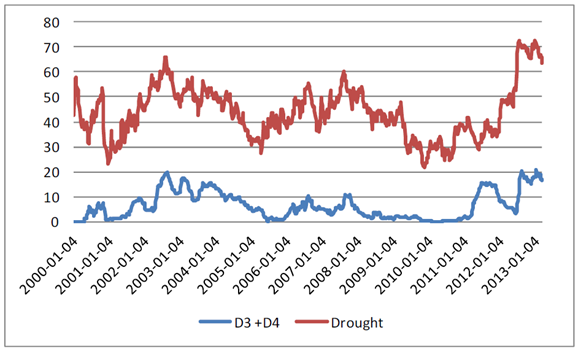
Odlingsväder
I veckan som gick regnade det i området kring Mississippi-floden, medan de västra delarna var fortsatt torra. Torkan släpper längs Mississippifloden och i östra USA och tränger ut torkan längre mot väster. Fortfarande är stora delar av USA torkdrabbat, men något mindre i veckans rapport. 63.6% av USA:s mark är torrare än normalt. I Juldagens rapport var det som värst med över 72% torrt. 16.5% av USA:s mark är fortfarande extremt eller exceptionellt torr. Även det är en minskning från maximum på över 19% som nåddes den sista januari.
Regn och kyla var på sina håll i USA så besvärande att sådden av majs hindrades. Europa fick nederbörd i veckan. Tidigare i år har Europa fått lite mindre nederbörd än normalt.
Vete
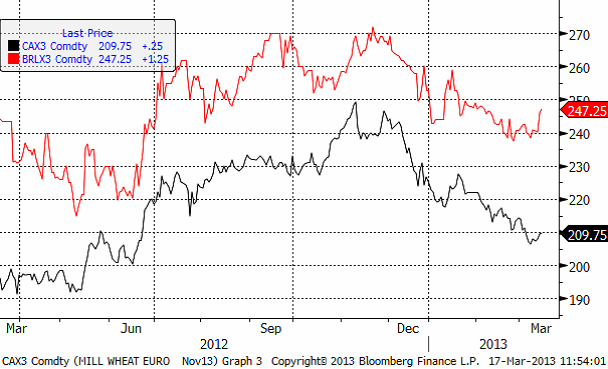
Priset på november (2013) steg upp mot 210-nivån i veckan. Det är ett avgörande läge, eftersom den här prisnivån just nu också är i den övre delen av den trendkanal nedåt som priset legat i sedan början av december när WASDE-rapporten fick marknaden på fall. När man är ute och talar med lantbrukare i Sverige får man höra följande: För det första är det ganska få som hann med att prissäkra på de höga prisnivåerna över 230 euro per ton som marknaden erbjöd mellan augusti och december. Den första stora prisuppgången 2007 var det nästan ingen som sålde eftersom man inte visste hur långt upp priset kunde gå. Vid nästa stora prisuppgång, 2010, prissäkrade man därför för tidigt, redan i september i många fall. Därför ångrade man sig när toppen noterades i februari 2011. Den här gången har man därför väntat – och missat toppen. Därför är det säkert många som kommer att passa på och sälja om priset rekylerar upp till – exempelvis – 220 euro per ton. Detta gör att uppgångar härifrån kan bli ganska begränsade, om inte utbudet i världen skadas allvarligt av försämrade odlingsförhållanden.
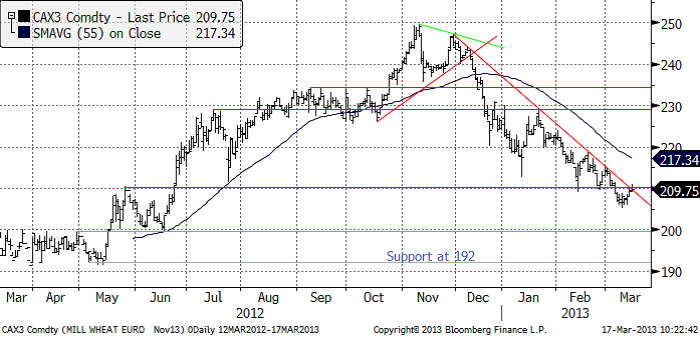
Jag tror att prisfallet de tre senaste månaderna är över och att vi får se lite ”sidledes” rörelse de närmaste veckorna. Intresse att prissäkra från lantbrukshåll finns om priserna är lite högre. Utvecklingen på vädret framöver blir viktigt.
Decemberkontraktet på CBOT hade en av sida bättre veckor, även den. Inte för att det är början på en prisuppgång, utan för att priset, som vi skrev förra veckan, kanske gått lite för långt ner lite för hastigt. Prisuppgången kommer alltså trots att det i veckan kom rapporter om ökande nederbörd och avtagande torka. Den enda tolkningen då är rimligen den, att priset gått ner lite för långt.
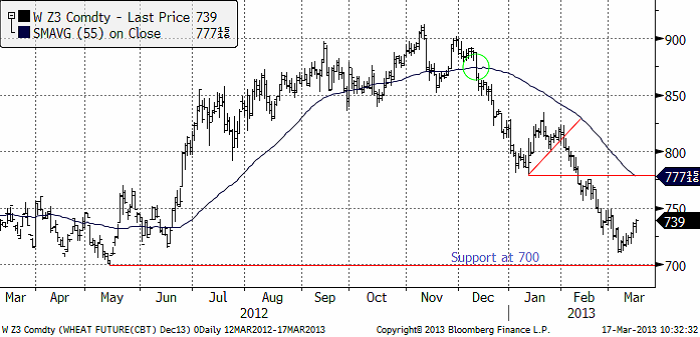
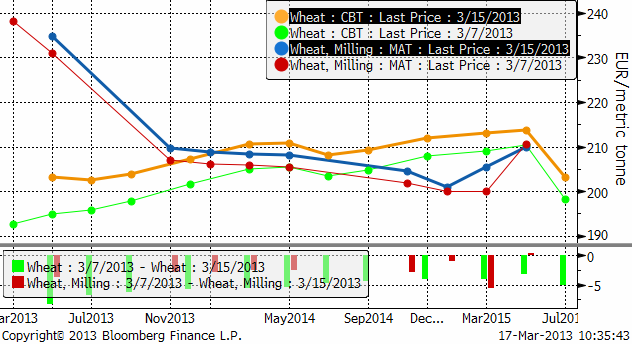
Terminskurvorna visar att alla terminer stigit. På Matif har alla löptider gått upp lika mycket. I USA har gammal skörd handlats upp mer än ny. Det är rimligt att detta sker, eftersom lagerkostnaderna minskar med minskande lager och att transporterna ut från USA kommer igång igen. Att vete blivit billigare än majs för gammal skörd bidrar också till att dra upp priset på vete.
Det har kommit en del statistik i veckan – som pekar åt olika håll. Franska Cocerals rapport indikerar högre priser. De tror att skörden i Frankrike blir bara något högre och 12 mt lägre i Storbritannien, där sådden var 25% mindre än normalt i höstas. Frankrike, som är EU:s största veteproducent beräknas bara öka skörden marginellt med 0.1 mt till 35.9 mt. Detta beror på att de största odlingsdistrikten Picardie och Centre fick mer än dubbelt så mycket nederbörd som normalt i december. FranceAgriMer estimerar att 66% av den franska veteskörden är i ”good” eller ”very good” condition per den 4 mars. Förra året samma tid var siffran 68%. Det är alltså nästan samma nivå.
 Coceral estimerade den tyska skörden till 23.6 mt, vilket är på samma nivå som DRV (Deutsche Raiffeisenverband) också publicerade i veckan som gick. DRV pekade på att det hittills inte förekommit några övervintringsskador på grund av frost.
Spanien, som förra året drabbades av torka, väntas i år producera normalt. Forna öststater väntas fortsätta öka produktionen. I förra veckans WASDE-rapport noterade vi också att den enda justering som USDA gjorde var att höja Litauens skörd med 500,000 ton. Det är en tydlig tendens.
”Soft Wheat” – skörden i EU tror Coceral blir 127.8 mt (+3.2 mt från förra året).
Strategie Grains som också rapporterade i veckan tror att samma skörd blir 131.6 mt. EU-kommissionen tror på ännu högre skörd, 132.1 mt.
Liksom förra veckan tror jag att de tre senaste månadernas prisfall på vete är över. Däremot tror jag inte på någon rask uppgång, utan mer på ”sidledes” rörelse medan marknaden tolkar de rapporter som kommer in – och lagerstatistiken som USDA publicerar den 28 mars. Ska man hålla koll på någonting särskilt är det om 210-nivån på Matif bryts på uppsidan. Det vore ett klart styrketecken om köparna lyckas ta hand om alla säljordrar som troligtvis anhopat sig där.
Maltkorn
Priset på maltkorn med leverans i november har visat mer styrka än kvarnvetet i veckan som gick. Priset steg från 240 till 247, medan kvarnvetet ”bara” steg några euro.
Majs
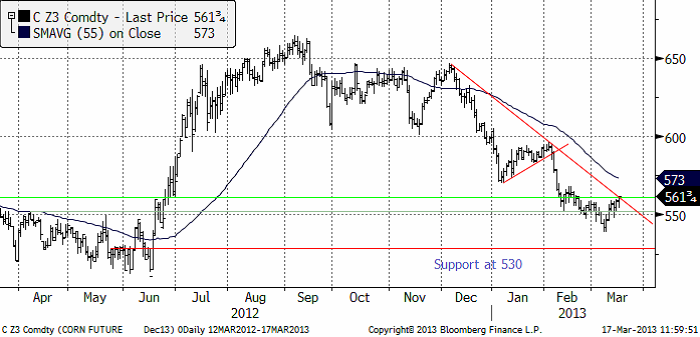
Majspriset (december 2013) fortsatte att stiga i veckan som gick. Priset gick upp till 561 cent – en nivå som dels ligger an mot den övre trendkanalen och dels är en nivå där uppgångar slutat tidigare. Marknaden står alltså nu under helgen och väger. Om priset håller sig på den här nivån får vi en någorlunda god bekräftelse på att prisfallet från december är över.
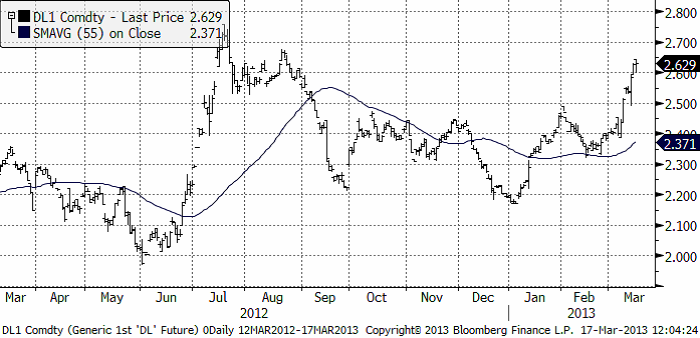
Veckovis etanolproduktion i minskade i veckan, men priset på etanol steg kraftigt. Vid årsskiftet handlades etanolen i 2.20 dollar per gallon och nu ligger den på 2.60. Detta sker samtidigt som oljepriset har fallit. Högre pris borde leda till högre produktion och högre efterfrågan på majs.
Vi har samma tolkning av marknaden som förra veckan. Prisfallet har troligtvis ebbat ut och priset bör röra sig ”sidledes”.
Sojabönor
Sojabönorna (november 2013) har till skillnad från majs, vete och maltkorn, handlats ner i veckan som stödet som jag skrivit om tidigare, på 1254 cent, har hållit. Novemberterminen stängde i fredags på 1261.
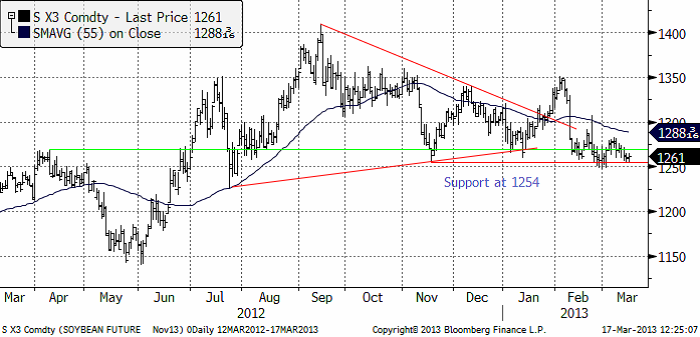
Skörden i Brasilien har kommit halvvägs. Bönderna har sålt 60% av skörden. Som jag skrev förra veckan är priserna inåt landet pressade på grund av den långsamma exporten. I Paranagua är väntan 75 dagar enligtFryer reports. Argentinska bönder har bara sålt 10% av skörden vilket är mindre än förra året då 30% sålt så här års. Argentina förklarades nästan i konkurs i en domstol i London häromveckan. Det finns därför en anledning att behålla sparkapitalet i den reala och säkra form som sojabönorna utgör.
I fredags publicerade NOPA (National Oilseed Processors Organisation) sin månadsvisa crush report. Den visar att sojabönslagret i USA äts upp i ett rasande tempo, samtidigt som världen får lov att vänta för att kunna få tag på de sydamerikanska bönorna.
Marknadsläget är oförändrat från förra veckan: I veckan som kommer får man hålla koll på om priset håller sig över det tekniska stödet vid 1254 eller om det bryts. Om det bryts vill vi vara korta sojabönor.
Raps
Rapspriset (november 2013) föll i torsdags rakt ner till det tekniska stödet på 415 euro per ton, men vände i fredags upp därifrån till 420, men stängde veckan på exakt 415 euro. Det var stora prisfall även i Winnipeg. Detta ”borde” inte ske ur ett fundamentalt perspektiv eftersom lagren är så små men sojabönorna sjönk och då kan inte rapsen gå sin egen väg.
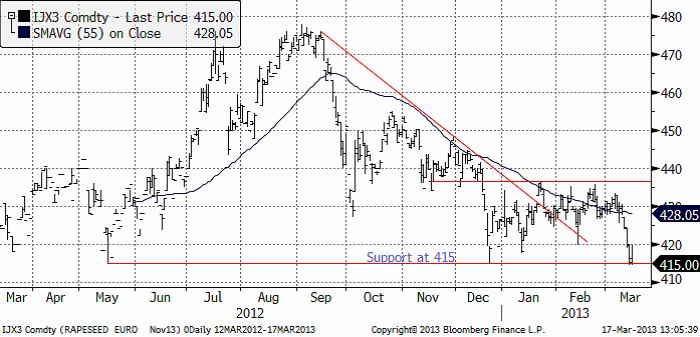
Olyckligtvis lämnade vi förra veckan en negativ vy på rapsen till nuvarande neutrala. Om marknaden handlar ner priset under 415 går vi omedelbart över till negativ vy igen, annars håller vi fast vid det neutrala. Jag tror inte man bör vara lång raps, så har man raps som inte är prissäkrat bör man överväga att göra det.
Gris
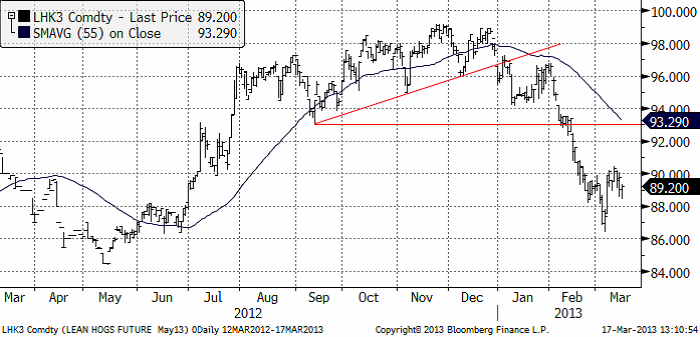
Grispriset (Maj 13) vände ner igen, precis som vi skrev förra veckan. Prisuppgången i början på mars får vi än så länge betrakta som en rekyl mot den i det större perspektivet fallande trenden.
Mjölk
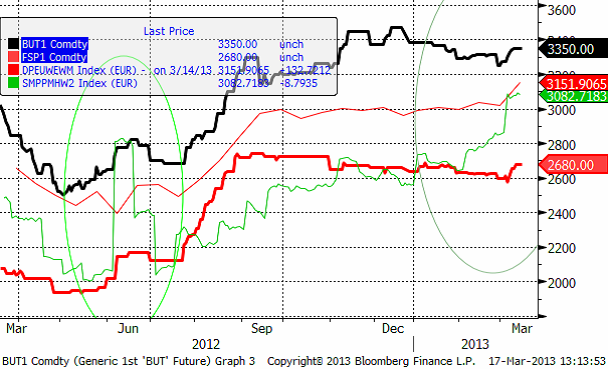
Resultatet för Fonterras auktion presenteras på tisdag. I februari började det priset stiga ordentligt, från 2600 euro per ton till 3082 euro per ton. Den senaste veckan har vi också sett att priserna på Eurex stigit något, men inte alls i samma utsträckning som Fonterra auktionens pris.
I kursdiagrammet nedan ser vi fyra kurvor, som förra veckan. Överst har vi smör i euro per ton, alla är i euro per ton. Den tunna röda linjen USDA:s notering för SMP i västra Europa. Den feta röda linjen är terminspriset på SMP på Eurex, som avser snittpriset på SMP i Tyskland, Holland och Frankrike. Den gröna linjen är Fonterras auktionspris på SMP.
SEB Commodities erbjuder ett litet ”prova-på” kontrakt som består av 0.5 ton Eurex-smör och 0.9 ton Eurex SMP. Ett paket som motsvarar 10 ton flytande mjölkråvara. Just nu är det underliggande värdet på ett sådant kontrakt drygt 33 000 kronor.
Den som vill följa priset på SMP på Eurex gör det via länken:
www.eurexchange.com/exchange-en/products/com/agr/14016/
Vi har säljrekommendation på mjölkterminer.
[box]SEB Veckobrev Jordbruksprodukter är producerat av SEB Merchant Banking och publiceras i samarbete och med tillstånd på Råvarumarknaden.se[/box]
Disclaimer
The information in this document has been compiled by SEB Merchant Banking, a division within Skandinaviska Enskilda Banken AB (publ) (“SEB”).
Opinions contained in this report represent the bank’s present opinion only and are subject to change without notice. All information contained in this report has been compiled in good faith from sources believed to be reliable. However, no representation or warranty, expressed or implied, is made with respect to the completeness or accuracy of its contents and the information is not to be relied upon as authoritative. Anyone considering taking actions based upon the content of this document is urged to base his or her investment decisions upon such investigations as he or she deems necessary. This document is being provided as information only, and no specific actions are being solicited as a result of it; to the extent permitted by law, no liability whatsoever is accepted for any direct or consequential loss arising from use of this document or its contents.
About SEB
SEB is a public company incorporated in Stockholm, Sweden, with limited liability. It is a participant at major Nordic and other European Regulated Markets and Multilateral Trading Facilities (as well as some non-European equivalent markets) for trading in financial instruments, such as markets operated by NASDAQ OMX, NYSE Euronext, London Stock Exchange, Deutsche Börse, Swiss Exchanges, Turquoise and Chi-X. SEB is authorized and regulated by Finansinspektionen in Sweden; it is authorized and subject to limited regulation by the Financial Services Authority for the conduct of designated investment business in the UK, and is subject to the provisions of relevant regulators in all other jurisdictions where SEB conducts operations. SEB Merchant Banking. All rights reserved.

Parts of the Brent crude curve dipping into the high $50ies/b. Brent crude fell 2.3% over the week to Friday. It closed the week at $61.29/b, a slight gain on the day, but also traded to a low of $60.14/b that same day and just barely avoided trading into the $50ies/b. This morning it is risk-on in equities which seems to help industrial metals a little higher. But no such luck for oil. It is down 0.8% at $60.8/b. This week looks set for Brent crude to dip its feet in the $50ies/b. The Brent 3mth contract actually traded into the high $50ies/b on Friday.

The front-end backwardation has been on a weakening foot and is now about to fully disappear. The lowest point of the crude oil curve has also moved steadily lower and lower and its discount to the 5yr contract is now $6.8/b. A solid contango. The Brent 3mth contract did actually dip into the $50ies/b intraday on Friday when it traded to a low point of $59.93/b.
More weakness to come as lots of oil at sea comes to ports. Mid-East OPEC countries have boosted exports along with lower post summer consumption and higher production. The result is highly visibly in oil at sea which increased by 17 mb to 1,311 mb over the week to Sunday. Up 185 mb since mid-August. On its way to discharge at a port somewhere over the coming month or two.
Don’t forget that the oil market path ahead is all down to OPEC+. Remember that what is playing out in the oil market now is all by design by OPEC+. The group has decided that the unwind of the voluntary cuts is what it wants to do. In a combination of meeting demand from consumers as well as taking back market share. But we need to remember that how this plays out going forward is all at the mercy of what OPEC+ decides to do. It will halt the unwinding at some point. It will revert to cuts instead of unwind at some point.
A few months with Brent at $55/b and 40-50 US shale oil rigs kicked out may be what is needed. We think OPEC+ needs to see the exit of another 40-50 drilling rigs in the US shale oil patches to set US shale oil production on a path to of a 1 mb/d year on year decline Dec-25 to Dec-26. We are not there yet. But a 2-3 months period with Brent crude averaging $55/b would probably do it.
Oil on water increased 17 mb over the week to Sunday while oil in transit increased by 23 mb. So less oil was standing still. More was moving.

Crude oil floating storage (stationary more than 7 days). Down 11 mb over week to Sunday

The lowest point of the Brent crude oil curve versus the 5yr contract. Weakest so far this year.

Crude oil 1mth to 3mth time-spreads. Dubai held out strongly through summer, but then that center of strength fell apart in late September and has been leading weakness in crude curves lower since then.

Rebounding along with most markets. But concerns over solidity of Gaza peace may also contribute. Brent crude fell 0.8% yesterday to $61.91/b and its lowest close since May this year. This morning it is bouncing up 0.9% to $62.5/b along with a softer USD amid positive sentiment with both equities and industrial metals moving higher. Concerns that the peace in Gaza may be less solid than what one might hope for also yields some support to Brent. Bets on tech stocks are rebounding, defying fears of trade war. Money moving back into markets. Gold continues upwards its strong trend and a softer dollar helps it higher today as well.
US crude & products probably rose 5.6 mb last week (API) versus a normal seasonal decline of 2.4 mb. The US API last night partial and thus indicative data for US oil inventories. Their data indicates that US crude stocks rose 7.4 mb last week, gasoline stocks rose 3.0 mb while Distillate stocks fell 4.8 mb. Altogether an increase in commercial crude and product stocks of 5.6 mb. Commercial US crude and product stocks normally decline by 2.4 mb this time of year. So seasonally adjusted the US inventories rose 8 mb last week according to the indicative numbers by the API. That is a lot. Also, the counter seasonal trend of rising stocks versus normally declining stocks this time of year looks on a solid pace of continuation. If the API is correct then total US crude and product stocks would stand 41 mb higher than one year ago and 6 mb higher than the 2015-19 average. And if we combine this with our knowledge of a sharp increase in production and exports by OPEC(+) and a large increase in oil at sea, then the current trend in US oil inventories looks set to continue. So higher stocks and lower crude oil prices until OPEC(+) switch to cuts. Actual US oil inventory data today at 18:00 CET.
US commercial crude and product stocks rising to 1293 mb in week 41 if last nights indicative numbers from API are correct.

Crude oil soon coming to a port near you. OPEC has lifted production sharply higher this autumn. At the same time demand for oil in the Middle-East has fallen as we have moved out of summer heat and crude oil burn for power for air-conditioning. The Middle-East oil producers have thus been able to lift exports higher on both accounts. Crude oil and condensates on water has shot up by 177 mb since mid-August. This oil is now on its way to ports around the world. And when they arrive, it will likely help to lift stocks onshore higher. That is probably when we will lose the last bit of front-end backwardation the the crude oil curves. That will help to drive the front-month Brent crude oil price down to the $60/b line and revisit the high $50ies/b. Then the eyes will be all back on OPEC+ when they meet in early November and then again in early December.
Crude oil and condensates at sea have moved straight up by 177 mb since mid-August as OPEC(+) has produced more, consumed less and exported more.

When it starts to move lower it moves rather quickly. Gaza, China, IEA. Brent crude is down 2.1% today to $62/b after having traded as high as $66.58/b last Thursday and above $70/b in late September. The sell-off follows the truce/peace in Gaze, a flareup in US-China trade and yet another bearish oil outlook from the IEA.
A lasting peace in Gaze could drive crude oil at sea to onshore stocks. A lasting peace in Gaza would probably calm down the Houthis and thus allow more normal shipments of crude oil to sail through the Suez Canal, the Red Sea and out through the Bab-el-Mandeb Strait. Crude oil at sea has risen from 48 mb in April to now 91 mb versus a pre-Covid normal of about 50-60 mb. The rise to 91 mb is probably the result of crude sailing around Africa to be shot to pieces by the Houthis. If sailings were to normalize through the Suez Canal, then it could free up some 40 mb in transit at sea moving onshore into stocks.
The US-China trade conflict is of course bearish for demand if it continues.
Bearish IEA yet again. Getting closer to 2026. Credibility rises. We expect OPEC to cut end of 2025. The bearish monthly report from the IEA is what it is, but the closer we get to 2026, the more likely the IEA is of being ball-park right in its outlook. In its monthly report today the IEA estimates that the need for crude oil from OPEC in 2026 will be 25.4 mb/d versus production by the group in September of 29.1 mb/d. The group thus needs to do some serious cutting at the end of 2025 if it wants to keep the market balanced and avoid inventories from skyrocketing. Given that IEA is correct that is. We do however expect OPEC to implement cuts to avoid a large increase in inventories in Q1-26. The group will probably revert to cuts either at its early December meeting when they discuss production for January or in early January when they discuss production for February. The oil price will likely head yet lower until the group reverts to cuts.
Dubai: The Mid-East anchor dragging crude oil lower. Surplus emerging in Mid-East pricing. Crude oil prices held surprisingly strong all through the summer. A sign and a key source of that strength came from the strength in the front-end backwardation of the Dubai crude oil curve. It held out strong from mid-June and all until late September with an average 1-3mth time-spread premium of $1.8/b from mid-June to end of September. The 1-3mth time-spreads for Brent and WTI however were in steady deterioration from late June while their flat prices probably were held up by the strength coming from the Persian Gulf. Then in late September the strength in the Dubai curve suddenly collapsed. Since the start of October it has been weaker than both the Brent and the WTI curves. The Dubai 1-3mth time-spread now only stands at $0.25/b. The Middle East is now exporting more as it is producing more and also consuming less following elevated summer crude burn for power (Aircon) etc.
The only bear-element missing is a sudden and solid rise in OECD stocks. The only thing that is missing for the bear-case everyone have been waiting for is a solid, visible rise in OECD stocks in general and US oil stocks specifically. So watch out for US API indications tomorrow and official US oil inventories on Thursday.
No sign of any kind of fire-sale of oil from Saudi Arabia yet. To what we can see, Saudi Arabia is not at all struggling to sell its oil. It only lowered its Official Selling Prices (OSPs) to Asia marginally for November. A surplus market + Saudi determination to sell its oil to the market would normally lead to a sharp lowering of Saudi OSPs to Asia. Not yet at least and not for November.
The 5yr contract close to fixed at $68/b. Of importance with respect to how far down oil can/will go. When the oil market moves into a surplus then the spot price starts to trade in a large discount to the 5yr contract. Typically $10-15/b below the 5yr contract on average in bear-years (2009, 2015, 2016, 2020). But the 5yr contract is usually pulled lower as well thus making this approach a moving target. But the 5yr contract price has now been rock solidly been pegged to $68/b since 2022. And in the 2022 bull-year (Brent spot average $99/b), the 5yr contract only went to $72/b on average. If we assume that the same goes for the downside and that 2026 is a bear-year then the 5yr goes to $64/b while the spot is trading at a $10-15/b discount to that. That would imply an average spot price next year of $49-54/b. But that is if OPEC doesn’t revert to cuts and instead keeps production flowing. We think OPEC(+) will trim/cut production as needed into 2026 to prevent a huge build-up in global oil stocks and a crash in prices. But for now we are still heading lower. Into the $50ies/b.


Gruvbolaget Boliden överträffade analytikernas förväntningar

Australien och USA investerar 8,5 miljarder USD för försörjningskedja av kritiska mineraler
Brent crude set to dip its feet into the high $50ies/b this week

Vad guldets uppgång egentligen betyder för världen

Spotpriset på guld över 4300 USD och silver över 54 USD

OPEC+ missar produktionsmål, stöder oljepriserna

Goldman Sachs höjer prognosen för guld, tror priset når 4900 USD

Ett samtal om guld, olja, fjärrvärme och förnybar energi

Blykalla och amerikanska Oklo inleder ett samarbete
Guld nära 4000 USD och silver 50 USD, därför kan de fortsätta stiga
-
 Nyheter4 veckor sedan
OPEC+ missar produktionsmål, stöder oljepriserna
-
 Nyheter2 veckor sedan
Goldman Sachs höjer prognosen för guld, tror priset når 4900 USD
-
 Nyheter4 veckor sedan
Ett samtal om guld, olja, fjärrvärme och förnybar energi
-
 Nyheter3 veckor sedan
Blykalla och amerikanska Oklo inleder ett samarbete
-
 Nyheter3 veckor sedan
Guld nära 4000 USD och silver 50 USD, därför kan de fortsätta stiga
-
Analys4 veckor sedan
Are Ukraine’s attacks on Russian energy infrastructure working?
-

 Nyheter4 veckor sedan
Guldpriset uppe på nya höjder, nu 3750 USD
-
Nyheter3 veckor sedan
Ett samtal om guld, olja, koppar och stål