

Analys
SEB Jordbruksprodukter, 17 juni 2013


 Det amerikanska jordbruksdepartementet publicerade juni månads WASDE-rapport i onsdags och den tolkades som negativ för vete, majs och sojabönor av marknaden. För vete var den inte nödvändigtvis negativ, men med enorm ny skörd av majs är det svårt att se att terminerna på vete skulle stiga.
Regnen i Europa ökar utbudet av vete av sämre kvalitet, dvs av Matif-kvalitet. Detta kan förklara att Matif har fallit mer än priset på vete i Chicago.
Ett nytt La Niña har kommit upp på prognoskartan. Hur detta utvecklar sig återstår att ha koll på. Den har potential att ställa till med en del skada, framförallt för norra halvklotets skörd av majs och sojabönor. Den kommer lite för sent för att skada höstvetet.
Den 28 juni är det dags för plantings-rapport från USDA.
Nästa vecka kommer veckobrevet inte ut på måndag som vanligt, utan förmodligen på tisdag.
Odlingsväder
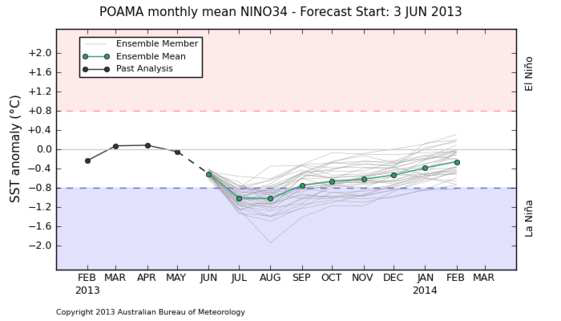
Vi tycker det är viktigast att upplysa om att ett La Niña helt oväntat kommit in i ensemble-prognosen från Australiens meteorologiska byrå. Detta har potential att ställa till med torka igen i USA och Ryssland senare i år.
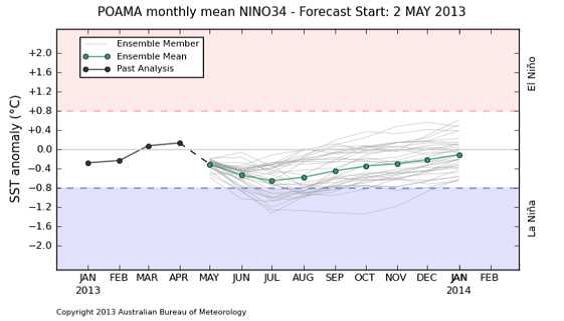
Som vi ser höll sig prognosen säkert över La Niña-gränsen för en månad sedan. I den senaste prognosen, som vi ser nedan, prognosticeras nu La Niña-förhållanden under juli och augusti.
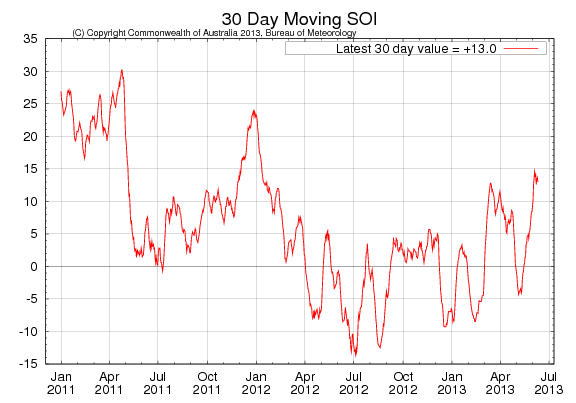
Faktum är att Southern Oscillation Index, har stigit väldigt raskt de senaste tio dagarna. SOI ligger nu på +13. Ett index över 8 indikerar La Niña-förhållanden och brukar hänga ihop med väder som är typiskt för La Niña.
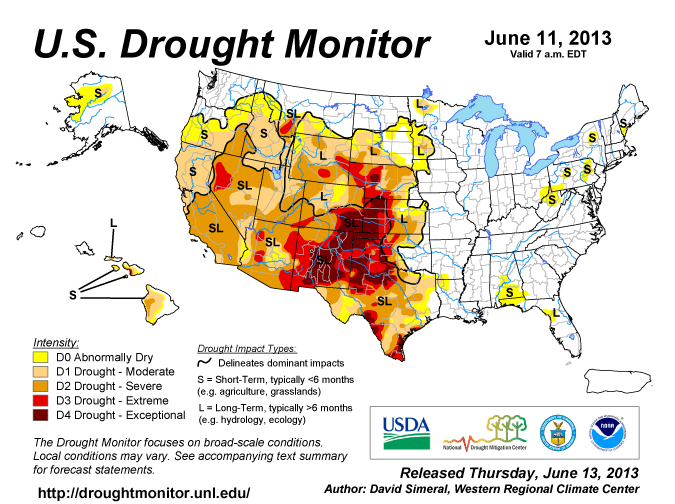
I US Drought Monitor har torkan avtagit ytterligare, som vi ser i kartbilden nedan.
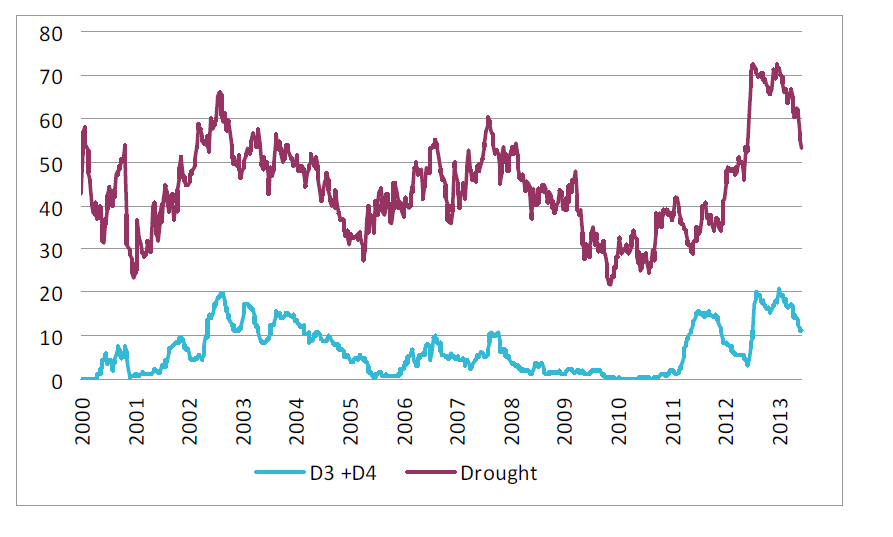
Andelen av USA:s yta som är påverkad av torka och de två mest extrema kategorierna av torka har minskat dramatiskt, som vi ser i nedanstående diagram.
Odlingsvädret i USA är alltså på väg att bli mycket bättre, men den gryende La Niña:n bör man hålla koll på för det framtida vädret.
Vete
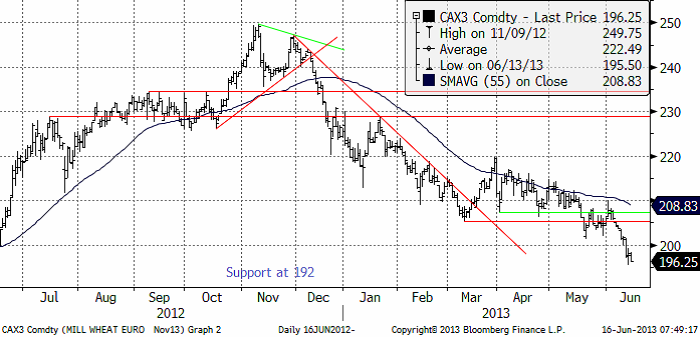
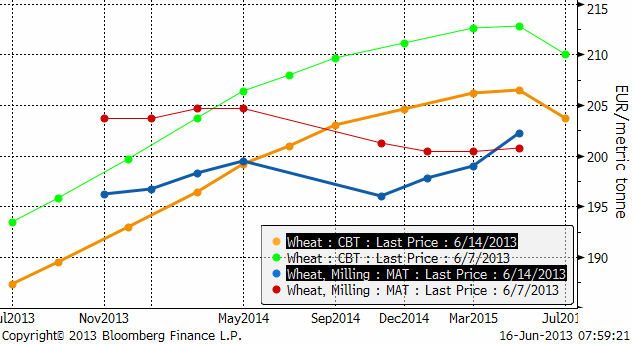
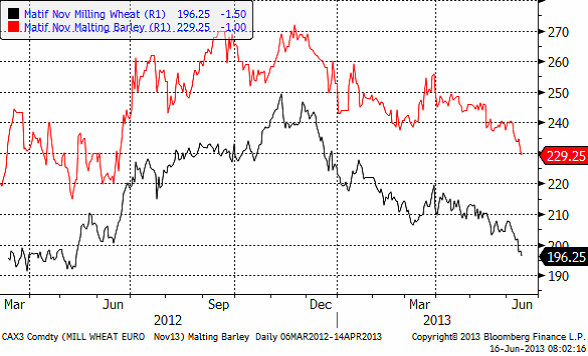
Priset på novemberterminen på Matif föll i veckan som gick till 196.25 euro per ton. Tekniskt stöd finns på 192, men det är ett gammalt stöd och de jämna siffrorna 195 och 190 kanske attraherar fler limiterade köpordrar, som kan få prisfallet att stanna till där och kanske rekylera. WASDE-rapporten tolkades som negativ, men det är bara på håret att det blir en lagerökning i världen, när det gäller vete. För majs är det en annan femma, men för vete är det inte fullt så negativt. Dessutom, som vi såg ovan, håller det på att utveckla sig till ett La Niña igen, vilket skulle kunna skada majs- och sojaskörden på norra halvklotet. Australien gynnas dock av mer nederbörd, som brukar hänga ihop med La Niña där.
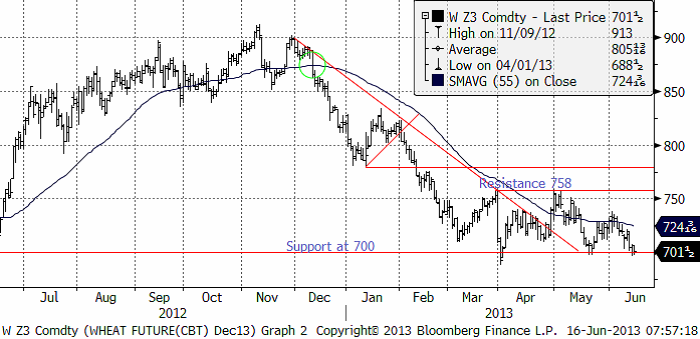
Decemberkontraktet på CBOT stängde i fredags på 701.50 cent per bushel. Det är precis ovanför det starka stödet på 700 cent. Skulle det brytas, t ex i veckan som kommer, signaleras ytterligare nedgång i terminspriset.
Nedan ser vi förändringen i terminskurvorna fredag till fredag. Chicago har sjunkit lika mycket för alla terminslöptider. Matif däremot noterar en uppgång i priset på terminer med löptid efter november 2014. Det innebär att Matif-kurvan nu uppvisar contango, vilket är ovanligt för den europeiska marknaden.
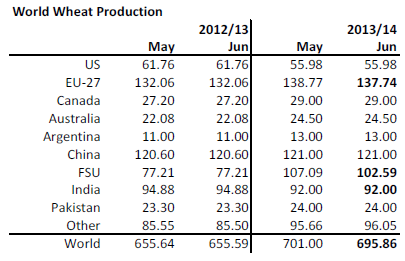
I onsdags presenterade det amerikanska jordbruksdepartementet World Agricultural Supply and Demand Estimates för juni. De sänkte produktionsestimatet i Europa och i före detta Sovjetunionen. Dessa sänkningar var väntade. Den ryska skörden sänktes med 2 mt, eller 3.6% sedan förra månaden. Detta är ändå 16.3 mt mer än förra året. USDA räknar med att ryssarna skördar 24.7 mha jämfört med 21.3 mha förra året. Förra året drabbades Ryssland av svår torka. USDA räknar med att hektarskörden för vete totalt blir 2.19 ton per hektar. Ungefär hälften av Rysslands vete är höstsått och den ger en skörd över genomsnittet. Vårsått vete ger lägre. 2.19 ton per hektar är 21% högre än förra året och 2% högre än genomsnittet de senaste fem åren. Vårsådden är klar nu eller är nästan klar.
Södra och norra Kaukasus har varit och är fortfarande mycket varmare än normalt med sämre skörd än normalt. Å andra sidan skriver USDA att förhållandena i Volga-regionen är utmärkta.
USDA sänkte också EU:s veteskörd till 137.74 beroende på nederbörden i östra Europa och i Italien. Översvämningarna av floderna räknar man med inte ha påverkat jordbruksmark, utan mer stadsbebyggelse längs floderna. Sedan rapporten har läget dock förvärrats på Balkan. Mer regn betyder mindre av bra brödkvalitet och mer av sämre kvalitet. En av anledningarna till prisfallet på Matif, är att leveransbar kvalitet är på gränsen till fodervete och att utbudet av detta alltså väntas öka på grund av vädret.
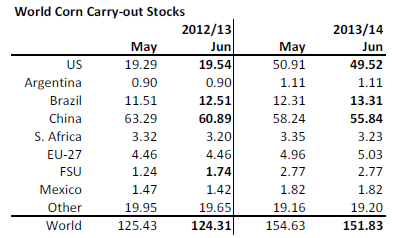
Den lägre produktionen återspeglar sig direkt i lägre estimerade utgående lager.
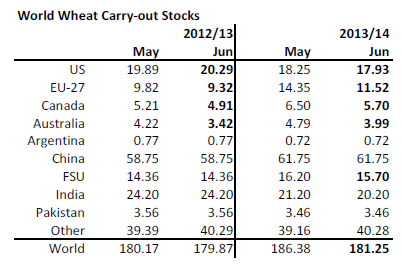
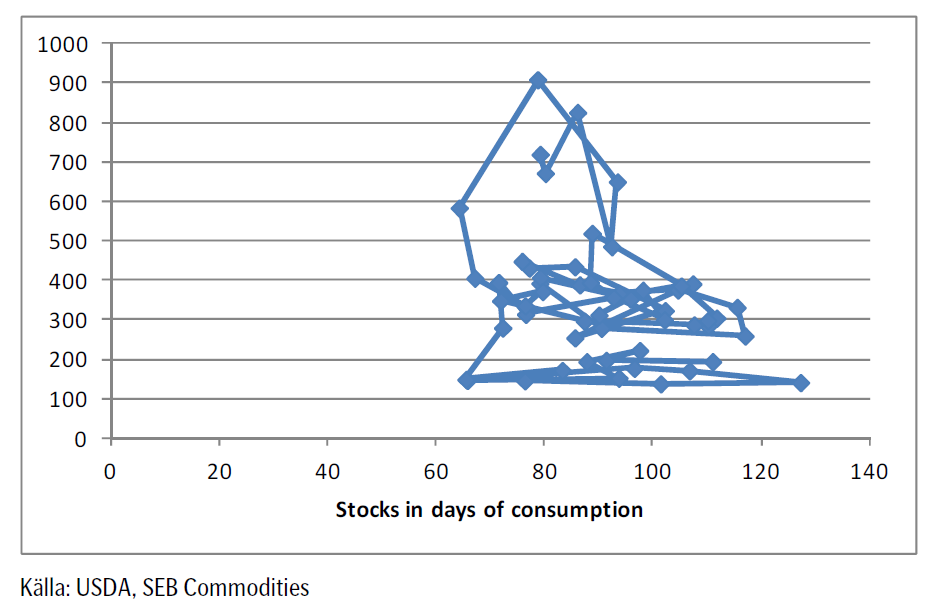
Det är nu i princip samma utgående lager estimerat som förra året – alltså ingen lagerökning. Som vi ser av diagrammet nedan, med utgående lager varje juni månad sedan 1960 och priset per cent per bushel på yaxeln, är vi nästan på samma ställe i diagrammet som för ett år sedan. Priset är lite högre och lagren är något lite lägre än de estimerades till för ett år sedan. Av relationen kan man dock se, att priset skulle kunna vara något lite lägre, för den här lagernivån. Därav prisfallet som följde på rapporten i onsdags.
Måndagens Crop Ratings hade minskat till 1% till 31% good / excellent. 5% var skördat i måndags för en vecka sedan. De första resultaten var inget vidare, men det var inte heller väntat. Normalt skulle skörden av höstvete ha nått till 16% klart.
ABARE (Australien) rapporterade ett skördeestimat som var högre än tidigare, på 25.4 mt. USDA ligger som vi såg ovan på 24.5 mt.
Den stora skörden i Ryssland är glädjande, men ryska statliga lager kommer att fyllas på först av allt.
Utbudet av spannmål, framförallt då majs, kommer att öka stort. Regnen i Europa ökar utbudet av den dåliga Matif-kvaliteten och det gör att vi ligger kvar med säljrekommendation på detta, trots att priset kommit ner så pass att det går att motivera ”neutral” rekommendation på dessa priser också.
Maltkorn
Maltkornet föll i veckan som gick i samklang med vetet på Matif och noterade en nedgång med lite drygt 10 euro per ton till 229.25 euro per ton.
Majs
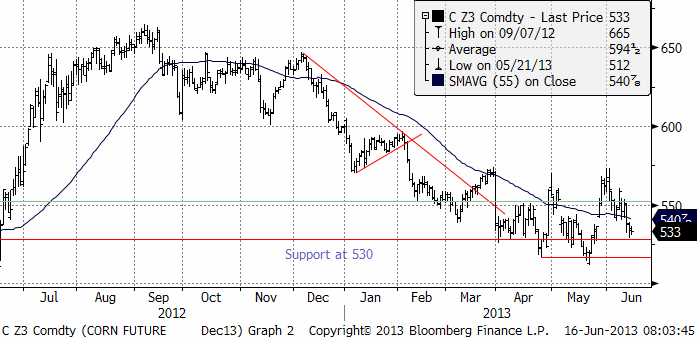
Majspriset (december 2013) föll i veckan som gick och stängde på 533 cent per bushel (56 pund). Det är precis ovanför det tekniska stödet på 530 cent. Tekniskt ser bilden ut som mer ”sidledes” rörelse är att vänta, men prisfallet kan också få en fortsättning, beroende på hur veckans nyhetsflöde utvecklar sig.
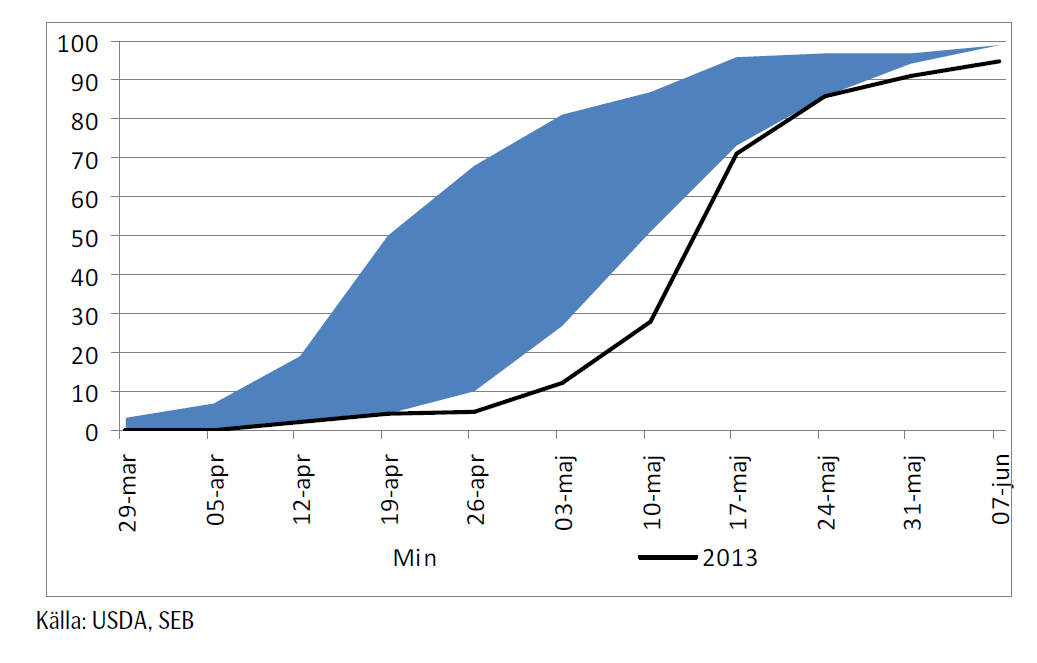
Till förra helgen hade amerikanska lantbrukare lyckats ta sig till 95% sått. Crop condition är 63% i good eller excellent-kategori. Nedan ser vi årets sista diagram på såddens fortskridande i USA.
USDA höjer skörden 2012/13 (i år) i Brasilien till 77 mt. Det har kommit gynnsam nederbörd för den viktigare andra skörden, safrinha, som odlas efter sojabönor, men USDA skriver att man har samma hektarskördeestimat som i maj. Däremot har man höjt arealen med 200,000 hektar till 15.8 mha.
På grund av den sena sådden i USA sänker man skördeestimatet för 2013/14 till 355.74 mt.
På global basis väntas skörden öka med 107 mt från förra året, trots en sänkning av estimatet från förra månaden på totalt 3.4 mt.
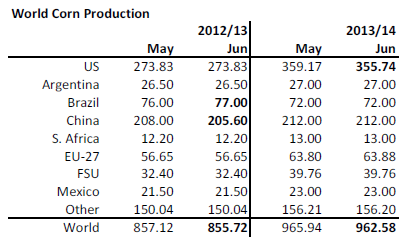
Utgående lager 2012/13 sänktes 1 mt på global basis, beroende på den lägre skörden.
Nedan ser vi relationen mellan lager (på x-axeln) och pris. Varje punkt är läget i juni varje år sedan år 1960. Läget just nu ligger precis mitt emellan 700 cent och 400 cent. Man kan alltså motivera både ett mycket högre pris och ett mycket lägre. Vilket det blir beror på hur odlingsvädret utvecklar sig fram till skörd.
En viktig rapport är också Plantings-rapporten som USDA publicerar den 28 juni.
Vi har dock redan noterat att USDA har höjt konsumtionsetimatet för 2013/14 så mycket att det inte är rimligt att tro att de kommer att besannas. USDA har alltså en hel del ”luft” att ta ur siffrorna, med högre utgående lager som följd.
Slutsatsen är att vi behåller vår säljrekommendation på majs.
Sojabönor
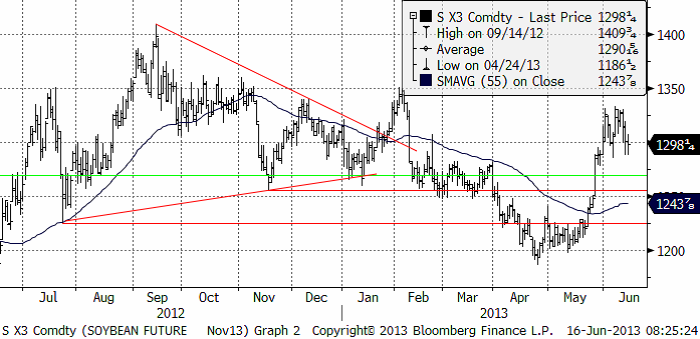
Sojabönornas prisuppgång stannade av och WASDE-rapporten från USDA fick marknaden på fall i onsdags. En rekyl ned mot 1250 skulle kunna vara förestående.
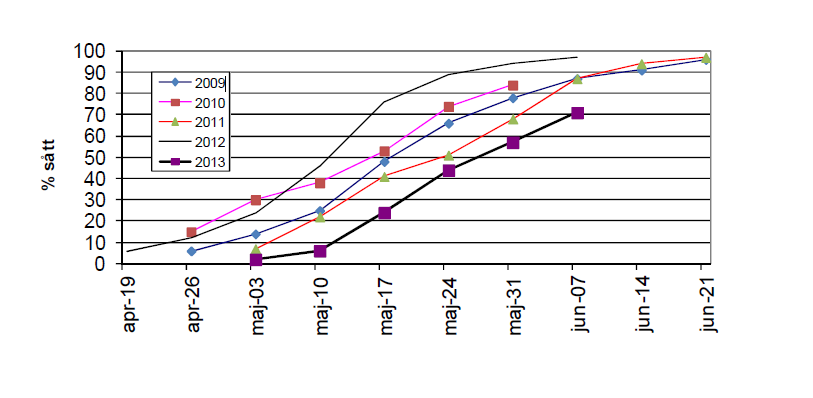
Sådden av sojabönor hade i måndagens rapport ökat från 57% til 71% färdigt. Nedan ser vi såddens utveckling i jämförelse med tidigare år.
USDA sänkte skördeestimatet för Brasilien med 1.5 mt för innevarande år. Det beror på förluster i nordöstra Brasilen, som har varit den torraste delen av landet. Trots sänkningen är väntas Brasiliens skörd av sojabönor i år bli 15.5 mt eller 23% högre än förra året. Brasiliens skördearbete är nu klart, förutom för den andra skörden i delstaten Paraná.
USDA gjorde ingen justering alls av estimatet för USA:s produktion.
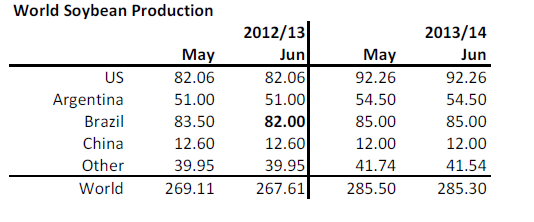
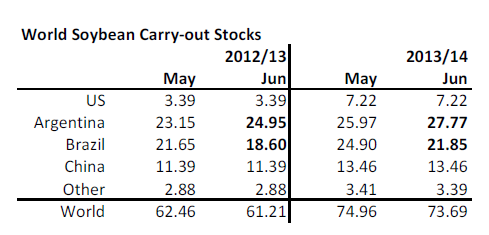
På grund av sänkningen för årets skörd i Brasilien, sänkte USDA ingående lager i 2013/14 och eftersom man inte gjorde några större förändringar för konsumtionen heller på global basis, resulterade detta i lägre utgående lager.
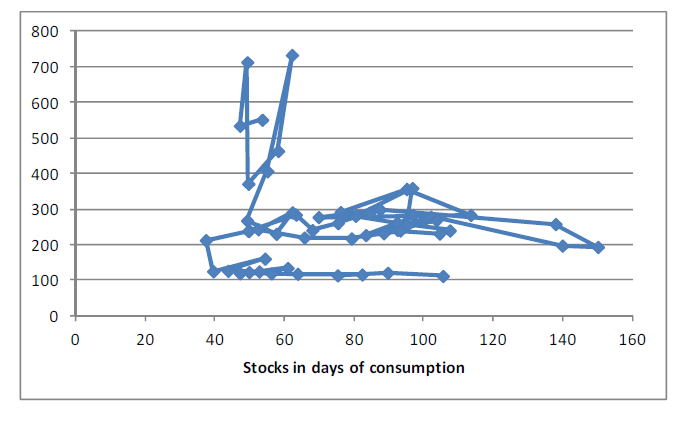
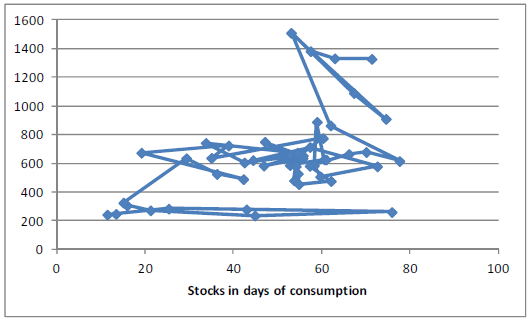
Nedan ser vi relationen per juni för utgående lager och pris i historiskt perspektiv. Vi ser att ett pris på strax under 1400 cent per bushel och ett utgående lager på över 70 dagar, är ett abnormt högt pris. Ett pris kring 1000 cent vore mer i linje med den historiska relationen.
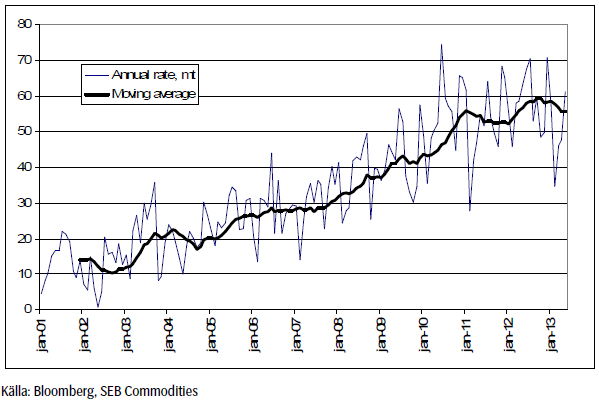
En anledning till lageruppbyggnaden är att Brasilien svarat på det höga priset och producerat mycket mer sojabönor. En annan anledning är att kinas glupande aptit efter mer, har mättats. Nedan ser vi importstatistik på månadsbasis. Månadssiffrorna är omräknade till årstakt. Vi ser också ett glidande årsmedelvärde. Bilden visar att efterfrågeökningen har planat ut.
Slutsatsen är att vi behåller och upprepar vår säljrekommendation på sojabönor.
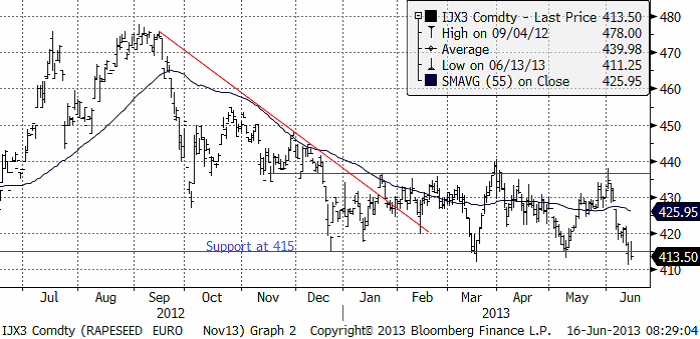
Raps
Rapspriset (November 2013) bröt genom stödet på 415 euro i torsdags och trots fyndköpare stängde fredagens handel även under, på 413.50 euro per ton. Nästa viktiga tekniska stöd finns först nere på 380 euro.
USDA rapporterade i onsdags estimat även för produktionen av europeiskt rapsfrö. De väntar sig en skörd om 19.7 mt för 2013/14. Det är en sänkning från förra månaden med 0.3 mt, men en ökning från förra året med 0.6 mt eller 3.3%. Man väntar sig att skörden blir 0.2 mt lägre än genomsnittet för de senaste fem åren. Sänkningen från förra månadens produktionsestimat motiveras med lägre areal och försämrat odlingsväder. De senaste översvämningarna i södra Tyskland väntas dock inte påverka negativt, då översvämningarna drabbat floddalarna och inte jordbruksmark.
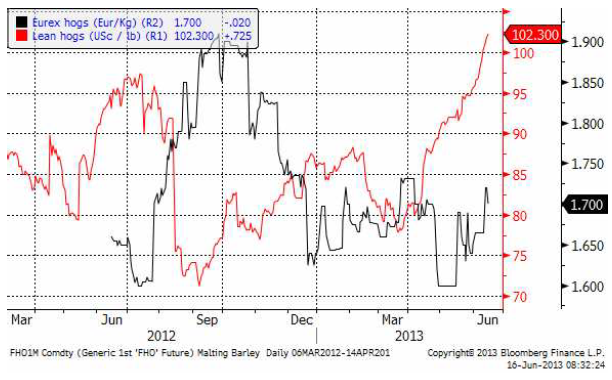
Gris
Lean hogs har fortsatt att ha en ”bull market”. Från förra veckans stängning på 91.125 cent per pund, har priset stigit upp till 102.30 cent.
De tyska grisarna har hängt på och gått från 1.665 euro per kilo till 1.70 euro per kilo.
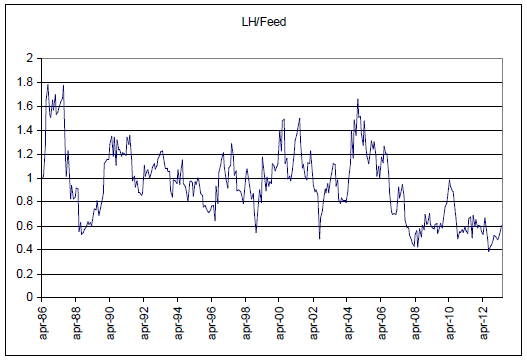
Stigande priser på gris, där uppgången leds av den amerikanska marknaden med Europa i släptåg samtidigt som foderpriserna är på fall, leder till förbättrade marginaler i grisproduktionen. Nedan ser vi det historiska förhållandet mellan foder och grispris (lean hogs). Kurvan visar utvecklingen i kvoten sedan april 1986. Fodersammansättningen här är beräknad med 80% majs och 20% sojamjöl. Vi ser att råvaruboomen orsakad av Kinas stigande efterfrågan, främst handlat om spannmål och soja. Boomen har försämrat lönsamheten för grisbönder, men detta kan nu vara påväg att reverseras.
Den rapport från OECD & FAO som publicerades i veckan och som refereras av Jordbruksverket, drar samma slutsatser, som jag här har hävdat den senaste tiden. En avmattning av råvaruboomen i det numera ganska välmående Kina, leder till sämre lönsamhet inom spannmålsodlingen i Europa och (därmed) högre lönsamhet i kött- och troligtvis också i mjölkproduktion.
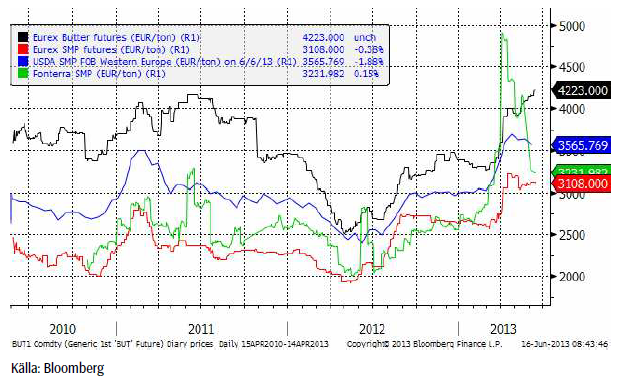
Mjölk
Eurex terminer på mjölk har gått upp från 4155 till 4223 euro per ton. Eurex terminer på SMP har gått ner från 3120 euro per ton till 3108. Sammantaget innebär detta en liten uppgång i priset på mjölk i euro. Euron har däremot försvagats ganska kraftigt mot kronan, vilket innebär att priset i svenska kronor gått ner.
Ett nytt La Niña innebär en återkomst för nederbörden till Australien och Nya Zeeland, vilket gynnar mjölkproduktionen, som till stor del är baserad på bete.
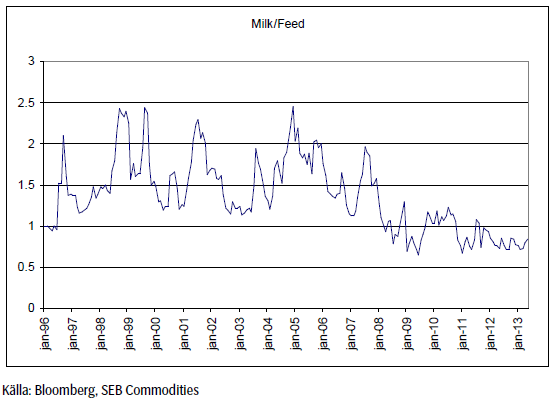
Liksom fallet är med griskött, har fallet i relationen mellan mjölkpris och foderkostnad (80% majs, 20% sojamjöl) legat på en dålig nivå sedan 2008. Om mjölkpriset fortsätter hålla sig och spannmålspriset fortsätter att falla, kommer detta att leda till förbättringar i lönsamheten.
[box]SEB Veckobrev Jordbruksprodukter är producerat av SEB Merchant Banking och publiceras i samarbete och med tillstånd på Råvarumarknaden.se[/box]
Disclaimer
The information in this document has been compiled by SEB Merchant Banking, a division within Skandinaviska Enskilda Banken AB (publ) (“SEB”).
Opinions contained in this report represent the bank’s present opinion only and are subject to change without notice. All information contained in this report has been compiled in good faith from sources believed to be reliable. However, no representation or warranty, expressed or implied, is made with respect to the completeness or accuracy of its contents and the information is not to be relied upon as authoritative. Anyone considering taking actions based upon the content of this document is urged to base his or her investment decisions upon such investigations as he or she deems necessary. This document is being provided as information only, and no specific actions are being solicited as a result of it; to the extent permitted by law, no liability whatsoever is accepted for any direct or consequential loss arising from use of this document or its contents.
About SEB
SEB is a public company incorporated in Stockholm, Sweden, with limited liability. It is a participant at major Nordic and other European Regulated Markets and Multilateral Trading Facilities (as well as some non-European equivalent markets) for trading in financial instruments, such as markets operated by NASDAQ OMX, NYSE Euronext, London Stock Exchange, Deutsche Börse, Swiss Exchanges, Turquoise and Chi-X. SEB is authorized and regulated by Finansinspektionen in Sweden; it is authorized and subject to limited regulation by the Financial Services Authority for the conduct of designated investment business in the UK, and is subject to the provisions of relevant regulators in all other jurisdictions where SEB conducts operations. SEB Merchant Banking. All rights reserved.

Market is starting to take US/Iran headlines with a pinch of salt. Brent crude rose $2.8/b yesterday to an official close of $112.1/b. But after that it traded as low as $108.05/b before ending late night at around $109.7/b. Through the day it traded in a range of $106.87 – 112.72/b amid a flurry of news or rumors from Iran and the US. ”US temporary sanctions during negotiations” (falls alarm). ”We will bomb Iran” (not anyhow),… etc. While the market is still fluctuating to this kind of news flow, it is starting to take such headlines with a pinch of salt.

We’ll see. Maybe, maybe not. The Brent M1 contract is trading at $110.2/b this morning which very close to the average ticks through yesterday of $110.4/b.
Trump with bearish, verbal intervention whenever Brent trades above $110/b it seems. What seems to be a pattern is that Trump states something like ”very good negotiations going on with Iran”, ”New leaders in Iran are great,..”, ”Great progress in negotiations,…”, ”Deal in sight,..” etc whenever the Brent M1 contract trades above $110/b. An effort to cool the market. These hot air verbal interventions from Trump used to have a heavy bearish impact on prices, but they now seems to have less and less effect unless they are backed by reality.
As far as we can see there has been no real progress in the negotiations between the US and Iran with both sides still standing by their previous demands.
Iran is getting stronger while the cease fire lasts making a return to war for Trump yet harder. Iran is naturally in constant preparation for a return to war given Trump’s steady threats of bombing Iran again. Iran is naturally doing what ever is possible to prepare for a return to war. And every day the cease fire lasts it is better prepared. This naturally makes it more and more difficult and dangerous for the US to return to warring activity versus Iran as the consequences for energy infrastructure in the Persian Gulf will be more and more severe the longer the cease fire lasts. Israel seems to see it this way as well. That the war is not won and that current frozen state of a cease fire gives Iran opportunity to rebuild military and politically.
Global inventories are drawing down day by day. How much? In the meantime the Strait of Hormuz stays closed. There is varying measures and estimates of how much global inventories are drawing down. Our rough estimate, back of the envelope, is that global inventories are drawing down by at least some 10 mb/d or about 300 mb/d in a balance between loss of supply versus demand destruction. Other estimates we see are a monthly draw of 250-270 mb/d. The IEA only ’measured’ a draw in global observable stocks of 117 mb in April with oil on water rising 53 mb while on shore stocks fell 170 mb. But global stocks are hard to measure with large invisible, unmeasured stocks. As such a back of the envelope approach may be better.
Oil products is what the world is consuming. Oil product prices likely to rise while product stocks fall. Strategic Petroleum Reserves (SPR) are predominantly crude oil. Discharging oil from OECD SPR stocks, a sharp reduction in Chinese crude imports and a reduction in global refinery throughput of 6-7 mb/d has helped to keep crude oil markets satisfactorily supplied. But global inventories are drawing down none the less. And oil products is really what the world is consuming. So if global refinery throughput stays subdued, then demand will eventually have to match the supply of oil products. The likely path forward this summer is a steady draw down in jet fuel, diesel and gasoline. Higher prices for these. Then, if possible, higher refinery throughput and higher usage of crude in response to very profitable refinery margins. And lastly sharper draw in crude stocks and higher prices for these. But some 6 mb/d of oil products used to be exported through the Strait of Hormuz. And it may not be so easy to ramp up refinery activity across the world to compensate. Especially as Ukraine continues to damage Russian refineries as well as Russian crude production and export facilities.
Watch oil product stocks and prices as well as Brent calendar 2027. What to watch for this summer is thus oil product inventories falling and oil product premiums to crude rising. Another measure to watch is the Brent crude 2027 contract as it rises steadily day by day as the Strait of Hormuz stays closed and global oil inventories decline. The latter is close to the highest level since the start of the war and keeps rising.
The Brent M1 contract and the Brent 2027 prices and current price of jet fuel in Europe (ARA). All in USD/b

Our back of the envelope calculation of the global shortage created by the closure of the Strait of Hormuz. Note that 3.5 mb/d of discharge from SPR is also a draw. Note also that ’Forced demand loss’ of 2.5 mb/d is probably temporary and will fall back towards zero as logistics are sorted out leaving ’Price demand loss’ to do the job of balancing the market. Thus a shortfall of at least 9 mb/d created by the closure. More if SPR discharge is included and more if Forced demand loss recedes.

Brent is climbing higher. Front-month is at USD 106.3/bl this morning, close to a weekly high and a USD 9/bl jump from Mondays open. This is the move we flagged as a risk earlier in the week: the market shifting from ”a deal is around the corner” to ”this is going to take longer than we thought”.

Analyst Commodities, SEB
During April, rest-of-year Brent remained remarkably stable around USD 90/bl. A stability which rested on one single assumption: the SoH reopens around 1 May. That assumption is now slowly falling apart.
As we highlighted yesterday: every week of delay beyond 1 May adds (theoretically) ish USD 5/bl to the rest-of-year average, as global inventories draw 100 million barrels per week. i.e., a mid-May reopening implies rest-of-year Brent closer to USD 100/bl, and anything pushing into June or July takes us meaningfully higher.
What’s changed in the last 48 hours:
#1: The US military has formally warned that clearing suspected sea mines from SoH could take up to six months. That is a completely different timescale from what the financial market is pricing. Even a political deal tomorrow does not immediately reopen the strait.
#2: Trump has shifted his tone from urgency to ”strategic patience”. In yesterday’s press conference: ”Don’t rush me… I want a great deal.” The market is reading this as a president no longer feeling pressured by timelines, with the naval blockade running in the background.
#3: So far, the military activity is escalating, not de-escalating. Axios reports Iran is laying more mines in SoH. The US 3rd carrier strike group (USS George H.W. Bush) is arriving with two countermine vessels. Trump yesterday ordered the US Navy to destroy any Iranian boats caught laying mines. While CNN reports that the Pentagon is actively drawing up plans to strike Iranian SoH capabilities and individual Iranian military leaders if the ceasefire collapses. i.e., NOT a attitude consistent with an imminent deal!
Spot crude and product prices eased off the early-April highs on a combination of system rerouting and deal optimism. Both now weakening. Goldman estimates April Gulf output is reduced by 14.5 mbl/d, or 57% of pre-war supply, a number that keeps getting worse the longer this drags on.
Demand-side adaptation is ongoing: S. Korea has cut its Middle East crude dependence from 69% to 56% by pulling more from the Americas and Africa, and Japan is kicking off a second round of SPR releases from 1 May. But SPRs are finite.
Ref. to the negotiations, we should not bet on speed. The current Iranian leadership is dominated by genuine hardliners willing to absorb economic pain and run the clock to extract concessions. That is not a setup for a rapid resolution. US/Israeli media briefings keep framing the delay as ”internal Iranian divisions”, the reality is more complicated and points toward weeks and months, not days.
Our point is that the complexity is large, and higher prices have only just started (given a scenario where the negotiations drag out in time). The market spent April leaning on the USD 90/bl rest-of-year assumption; that case is diminishing by the hour. If ”early May reopening” is replaced by ”June, July or later” over the next week or two, both crude and products have meaningful room to reprice higher from here. There is a high risk being short energy and betting on any immediate political resolution(!).
Down on Friday. Up on Monday. The Brent June crude oil contract traded down 5.1% last week to a close of $90.38/b. It reached a high of $103.87/b last Monday and a low of $86.09/b on Friday as Iran announced that the Strait of Hormuz was fully open for transit. That quickly changed over the weekend as the US upheld its blockade of Iranian oil exports while Iran naturally responded by closing the SoH again. The US blew a hole in the engine room of the Iranian ship TOUSKA and took custody of the ship on Sunday. Brent crude is up 5.6% this morning to $95.4/b.
The cease-fire is expiring tomorrow. The US has said it will send a delegation for a second round of negotiations in Islamabad in Pakistan. But Iran has for now rejected a second round of talks as it views US demands as unrealistic and excessive while the US is also blocking the Strait of Hormuz.
While Brent is up 5% this morning, the financial market is still very optimistic that progress will be made. That talks will continue and that the SoH will fully open by the start of May which is consistent with a rest-of-year average Brent crude oil price of around $90/b with the market now trading that balance at around $88/b.
Financial optimism vs. physical deterioration. We have a divergence where the financial market is trading negotiations, improvements and resolution while at the same time the physical market is deteriorating day by day. Physical oil flows remain constrained by disrupted flows, longer voyage times and elevated freight and insurance costs.
Financial markets are betting that a US/Iranian resolution will save us in time from violent shortages down the road. But every day that the SoH remains closed is bringing us closer to a potentially very painful point of shortages and much higher prices.
The US blockade is also a weapon of leverage against its European and Asian allies. When Iran closed the SoH it held the world economy as a hostage against the US. The US blockade of the SoH is of course blocking Iranian oil exports. But it is also an action of disruption directed towards Europe and Asia. The US has called for the rest of the world to engaged in the war with Iran: ”If you want oil from the Persian Gulf, then go and get it”. A risk is that the US plays brinkmanship with the global oil market directed towards its European and Asian allies and maybe even towards China to force them to engage and take part. Maybe unthinkable. But unthinkable has become the norm with Trump in the White House.


Sommarväder skapar prisrally på elbörsen
Oil product price pain is set to rise as the Strait of Hormuz stays closed into summer

Solkraften pressar elpriserna dagtid

Michel Gubel ger sin syn på oljemarknaden