

Analys
SEB Jordbruksprodukter, 17 februari 2014


 WASDE-rapporten har vi redan gått igenom separat tidigare i veckan. Den gav inte marknaden information som ändrar den tidigare bilden. Om något var den positiv för vete men varken-eller för majs och soja.
Mjölkmarknaden var lite starkare i veckan med prisuppgångar på såväl terminer på SMP som smör på Eurex.
Grispriset i USA fortsätter att stiga, eftersom PED-virusets spridning forsätter att öka och inte nått kulmen än. Priserna i Europa, som påverkas av Rysslands importstopp, fortsätter att vara låga, på samma nivå som veckan innan, vid 1.50 euro per Kg.
I veckan kommer USDA:s Outlook conference.
Nya EU-regler
Sedan i torsdags ska alla OTC-terminstransaktioner inom EU rapporteras till ett centralt transaktionsregister. SEB Commodities ombesörjer detta utan kostnad för sina kunders transaktioner med SEB. SEB har också en särskild tjänst där kunder kan få hjälp med hela sin rapportering av börshandlade terminer och optioner såväl som OTC, som de handlat med vilken mäklare eller bank som helst, alltså inte bara med SEB. Rapporteringskravet följer av EU-reglerna i EMIR. Den som är intresserad av att läsa mer om EMIR kan göra det på Finansinspektionens hemsida, eller på ESMA:s hemsida. ESMA är EU:s centrala finansinspektion.
EU har redan beslutat att ersätta EMIR med MiFIR / MiFID2, som beräknas träda i kraft om strax under 3 års tid. MiFID2:s regler är tyvärr baserade på den politiskt motiverade (medvetna) missuppfattningen att det var spekulation som skapade råvaruboomens höga priser på framförallt mat år 2008. EU kommissionen har av allt att döma betalat ut enorma summor till bistånds- och miljöorganisationer för att torgföra den uppfattningen, som står i bjärt kontrast till en överväldigande majoritet av vetenskapliga studier av orsakssambanden.
Vi som studerar råvarumarknaden ser att MiFID2-reglerna kommer att innebära högre transaktionskostnader för prissäkring inom lantbrukssektorn, mycket sämre möjligheter att prissäkra bort risk som beror på rörligt pris, och därmed högre kapitalkostnader inom jordbruket. Högre kostnader inom EU:s lantbruk innebär utslagning av finansiellt svagare producenter och handelsföretag, mindre produktion och därmed högre priser på mat. Det innebär också att marknadens aktörer kommer att söka substitut, såväl till EU-baserade råvarubörser som till de instrument-typer som omfattas av MiFID2. Bland annat omfattas inte ”fysiska” leveranskontrakt om de syftar till prissäkring.
En missuppfattning att EMIR innebär att terminer och optioner blir ”olagliga” att handla fick spridning i veckan som gick. Tolkningen stämmer inte. Däremot innebär EMIR-reglerna en rapporteringsplikt, som i sig innebär en ökad kostnad för prissäkring för marknadens aktörer som helhet. EMIR skapades för att på EU-nivå få bättre information om derivatmarknaden för att bättre kunna bedöma den risk för spridning av bankkonkurser som bilaterala derivatavtal skulle kunna utgöra en spridningsväg för, och därmed ett hot mot hela det finansiella systemet inom EU. För råvarumarknaden är EMIR onödig, eftersom råvarutransaktioner aldrig har och aldrig kommer att kunna innebära ett hot mot EU-ländernas finansiella stabilitet, men Europaparlamentet, Rådet och Kommissionen har fattat det här beslutet ändå.
Odlingsväder
Det har varit väldigt kallt i USA, som bekant. Det har också varit torrt i Brasiliens östra och centrala delar, men regnen rör sig norrut och nådde Sao Paulo i torsdags. Det är egentligen bara de kaffeodlande delstarterna Minas Gerais och Espirito Santo som varit riktigt torr och dit bör regnen nå inom kort om de inte nått dit redan. Mato Grosso har klarat sig väl och skörden av soja har kommit så långt att risken för skador är över.
Vete
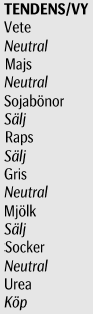
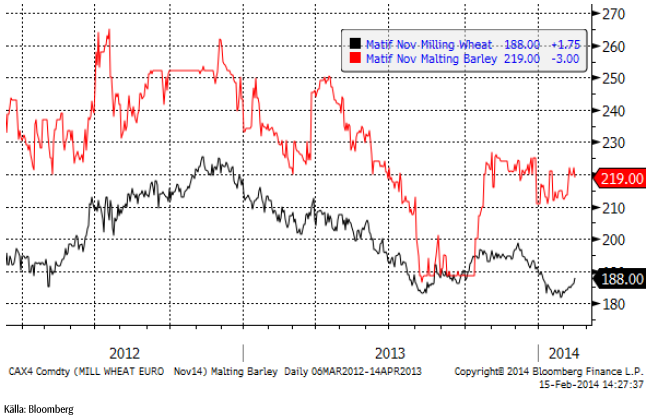
Matifs novemberkontrakt har fortsatt stiga och stängde i fredags på 188 euro per ton. Vid 190 euro borde ett batteri av säljordrar vänta, så vi tror att uppgången kommer att stöta på patrull. Kanske blir det en vecka med konsolidering eller kanske en begynnande rekyl nedåt.
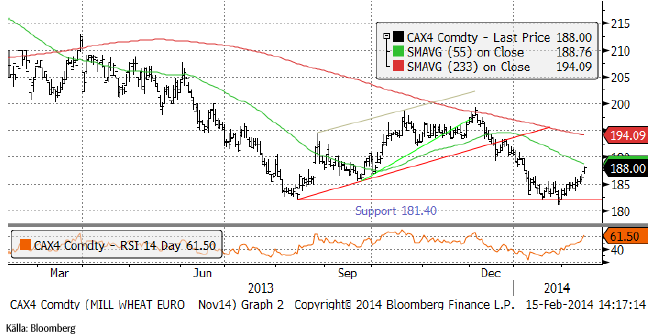
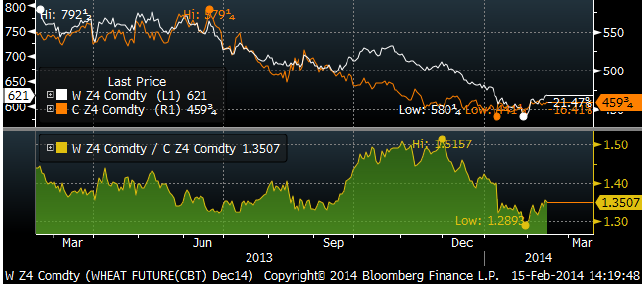
Nedanför ser vi Chicagovetet (Dec 14), som stängde fredagen på 621 cent. Uppgången sker från låg nivå och känns inte övertygande.
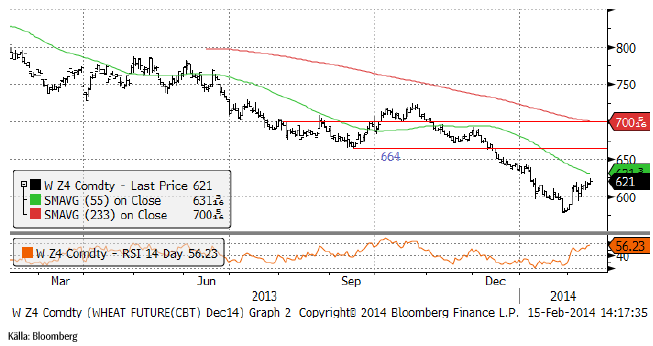
Nedan ser vi terminskurvorna för Chicagovete och Matif, båda uttryckte i euro per ton. Backwardation har ökat på båda sidor av Atlanten.
Förra veckan visade vi att vetekontrakten för decemberleverans i Chicago var rekordbilliga i förhållande till majs för decemberleverans. Kvoten mellan priserna (vete / majs) var då 1.29. Vi förutsåg korrekt att priset på vete var ”billigt”. I fredags hade kvoten gått upp till 1.35. Vetet har alltså stigit 6% i förhållande till majs. Nu ser inte relationen fullt så avvikande ut längre. På 1.35 är den fortfarande låg, men inte så låg att den motiverar en position längre.
USDA gick i veckan ut och sade att Indien inte kommer att exportera något vete alls i år. I fredags publicerade dock Indiens jordbruksdepartement en prognos för årets skörd, som börjar snart. Landets produktion väntas öka till 95.6 mt från 93.5 mt förra året. Risproduktionen väntas också öka med 1 mt till 106.2 mt.
Det var betydligt lugnare i veckan hos köparländerna i Mellanöstern och i Nordafrika. Jordanien köpte 100 kt. Det har skett en ”burnout”, där köparländerna redan har köpt vad de skulle. Man kan tänka sig att det krävs en extra realisation på vete för att de ska lockas att komma tillbaka som köpare, vilket gör att den tekniska stödnivån på 180 euro per ton är svagare nu än tidigare. Vi har skrivit om detta tidigare.
Strategie Grains sänkte sin prognos för veteskörden i EU-28 i år med 0.3 mt till 137.5 mt. Strategie Grains menar att övervintringen i de baltiska länderna varit dålig och att arealen i Polen är mindre än väntat. Strategie Grains har högre estimat än USDA, som tidigare i veckan angav en produktion på 142.87 mt. Förra årets skörd (i höstas) låg enligt USDA på 133.88 mt, så årets skörd ser alltså ut att bli ca 10 mt högre än förra året.
Australiensiska ABARE höjde skördeestimatet i veckan med 800 kt till 27 mt.
Black Earth Farming med 230,000 ha under odling vinstvarnade i veckan pga lägre skörd än väntat avseende bland annat vete.
Vi tror att prisuppgången stannar av i veckan som kommer och fortsätter med neutral rekommendation.
Maltkorn
November 2014 – kontraktet på maltkorn håller sig stabilt vid 220 euro per ton.
Majs
Tekniskt har majs bildat en triangelformation och utbrott från den ger antingen en teknisk köpsignal (om uppåt) eller säljsignal (om nedåt).
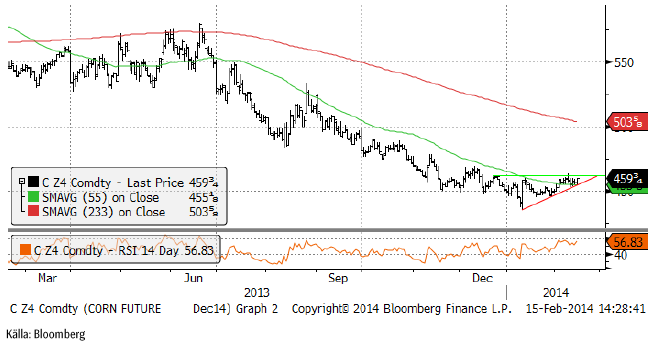
WASDE-rapporten gav inga indikationer alls om priset var lågt eller högt. Men man kan kanske med den som vägledning se vad som hänt sedan dess. USDA sänkte den Argentinska skörden med 1 mt till 24 mt på den torka som ägde rum i julas. Man behöll skörden för Brasilien på 70 mt, men i veckan kom CONAB med sitt första estimat för den andra, lilla skörden ”safrinha”. De estimerar den till 42.8 mt, vilket gör att den totala skörden sammanlagt summerar till 75.5 mt. Det är 5.5 mt mindre än förra året, men 5.5 mt mer än USDA estimerar. Samtidigt som detta signelarar att globala utgående lager blir större än USDA väntat sig vad gäller majs, signalerar det också att den mark som inte odlats majs på i Brasilien, använts till något annat, förmodligen då sojabönor. Slutsatsen av denna nya information är negativ för majs och negativ för sojabönor.
Efter att ha haft en köprekommendation tycker vi nu, dels med tanke på den tekniska bilden och dels med tanke på en ytterligare uppjustering av global produktion från Brasilien, att det är bäst att inte ha någon position alls, i vart fall inte en köpt.
Sojabönor
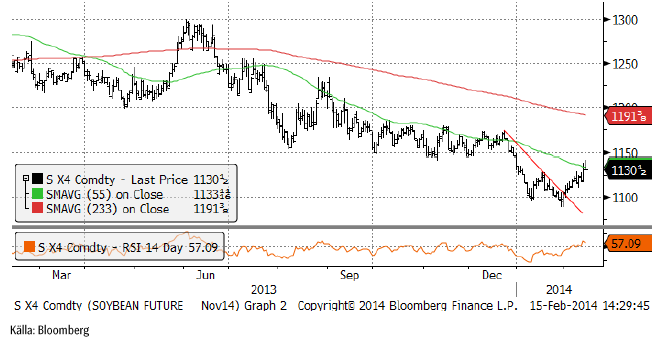
Sojabönorna handlades upp i veckan på såväl stark export från USA som hög ”crush” i USA. CONAB justerade också ner skörden i Brasilien. Trots detta har tiden i praktiken runnit ut för skador på den Brasilianska skörden. 12% är redan skördat och takten accelererar nu enligt känt mönster. Tekniskt har priset kommit upp till ”gamla bottennoteringar” från perioden augusti till december. Det gör att 1150 nu är ett starkt motstånd. Man kan vänta sig att priset får problem att gå högre och att vi istället kan få en förlängning på fredagens svaga stängning.
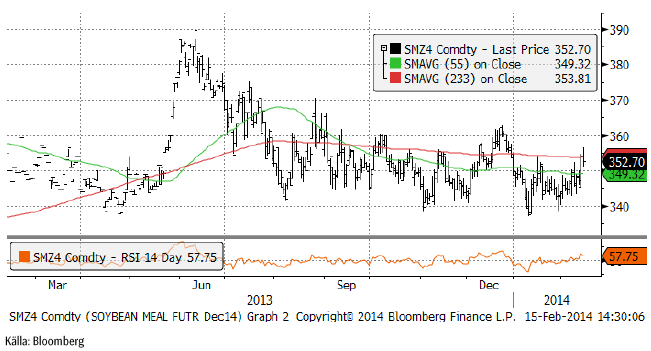
Sojamjölet håller sig kvar i intervallet 340 – 360 dollar per short ton. Nu är priset i den övre delen av intervallet, vilket säkerligen lockar fram säljare.
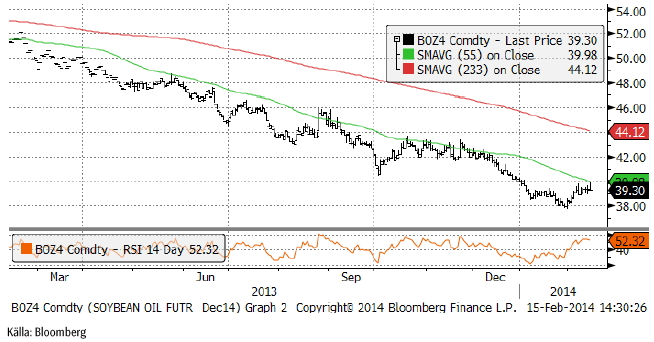
Sojaoljan testade återigen 40 dollar, men även den här gången var det säljarna som vann. Det är ett negativt tecken.
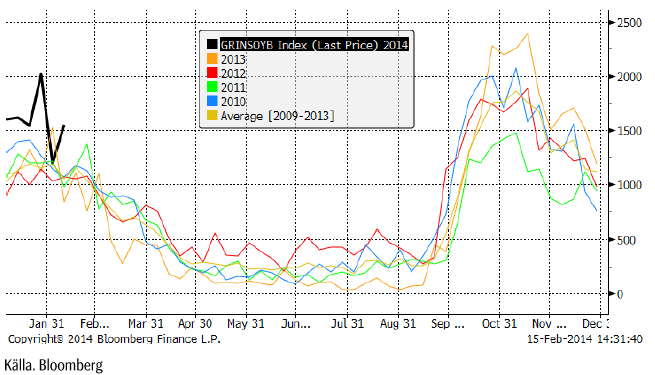
Exportstatistiken (inspections) kom in högre än veckan innan och ligger på en nivå som är helt ohållbar.
I torsdags rapporterade USDA att Kina avbeställt 265,000 ton sojabönor från USA. Kina har istället köpt sojabönor från Brasilien, där skörden accelererar. Antalet fartyg som lastas eller väntar på att lastas i brasilianska hamnar föll till 63 i onsdags, ner från 94 den 7 februari. Kinas import nådde nytt rekord i januari (liksom det gjorde för en hel rad råvaror).
Vi fortsätter med säljrekommendation på sojabönor.
Raps
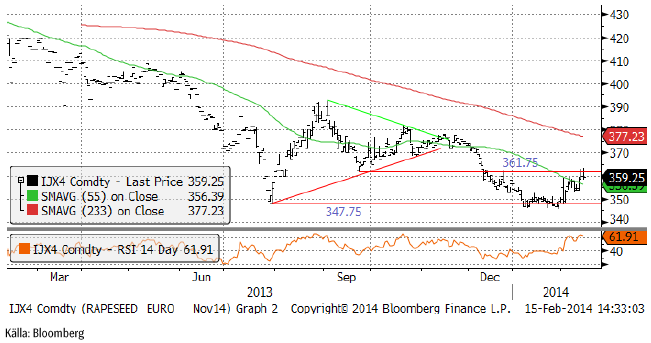
November 2014-kontraktet på raps fortsatte att följa Chicago och inte Winnipeg. Priset verkar dock inte vilja gå över 361.75 euro per ton och såldes på kraftigt vid försök att handla upp priset över den nivån såväl i torsdags som i fredags. Vi har de senaste månaderna sett att det finns kraftfulla aktörer i marknaden för rapsfrö, som kan bestämma sig för att köpa eller sälja på en viss nivå och då går priset inte genom deras ordrar som verkar kunna svälja hur mycket som helst. Om det är en sådan säljare som bestämt sig för att sälja vid ca 361.75, är det svårt att tro att priset ska över den nivån.
Prisfallet på canola i Winnipeg tog ny fart i veckan som gick. Skillnaden i pris för novemberleverans (efter ny skörd) är nu 70 euro eller nästan 24%. Med tanke på att det är lång, mycket lång tid, till november, förefaller det här vara en helt orimlig prisskillnad. Den som kan, borde sälja raps och köpa canola. Skillnaden ökade naturligtvis även mot sojabönor i Chicago.
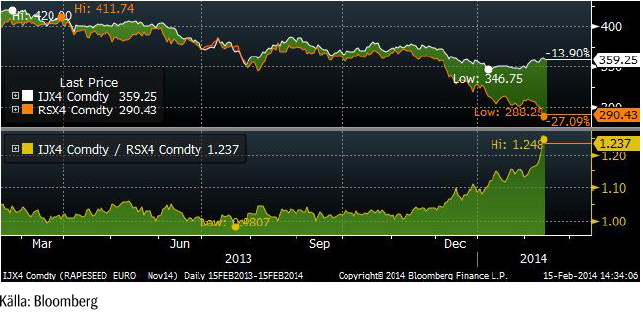
Vi fortsätter med säljrekommendation och upprepar den!
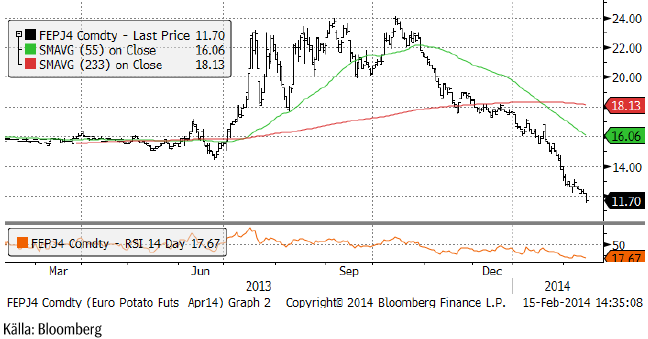
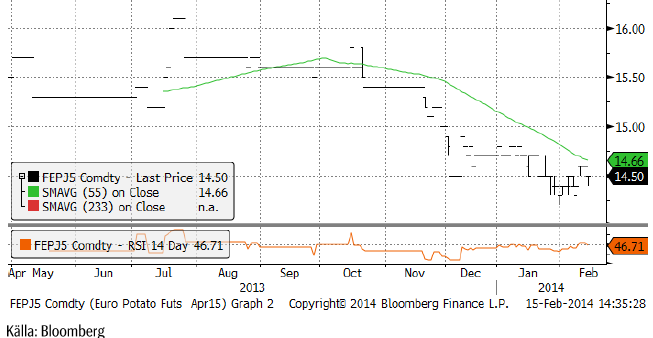
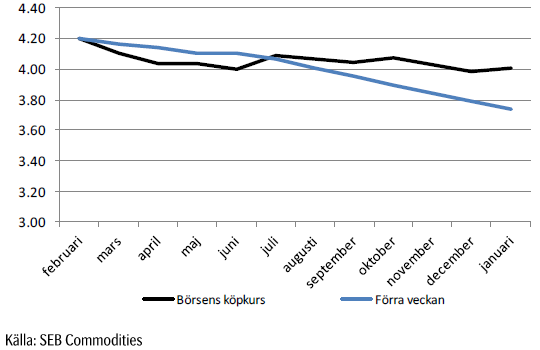
Potatis
Potatis av gammal skörd har halverats sedan oktober och föll i fredags ner till 11.70 euro per 100 Kg.
Kontraktet för den kommande skörden börjar nu handlas allt mer. Nedan ser vi kurdiagrammet för april 2015-kontraktet. Det handlas nu 10 eurocent högre än förra veckan, på 14.50 istället för 14.40.
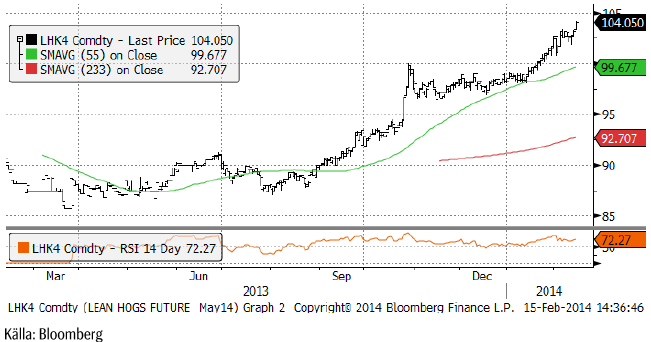
Gris
Lean hogs maj-kontrakt steg från förra veckans 103.9 till 104.05 cent i fredags. Orsaken är att PED-virusets spridning fortfarande ökar. Veckan som slutade den 26 januari, rapporterade AASV 265 nya fall av PED. I augusti och september låg nivån på 32 nya fall per vecka. Det är därför som de längre kontrakten för sommarmånaderna fortsätter att handlas upp i pris. USDA sänkte sitt estimat för fläskproduktionen i år från 23.6 miljarder pund till 23.4 i veckan. Efterfrågan är fortsatt hög i USA och USDA sänkte också export-estimatet med 0.8%.
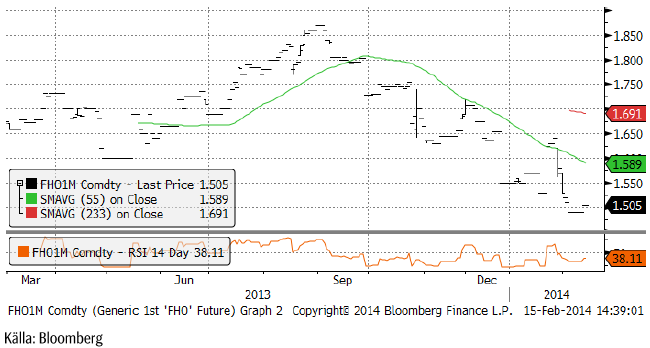
Spotkontraktet på EUREX Hogs har legat still på 1.50 euro i veckan som gått. Priset har rasat successivt sedan toppen i augusti / september på drygt 1.85 euro per Kg.
Mjölk
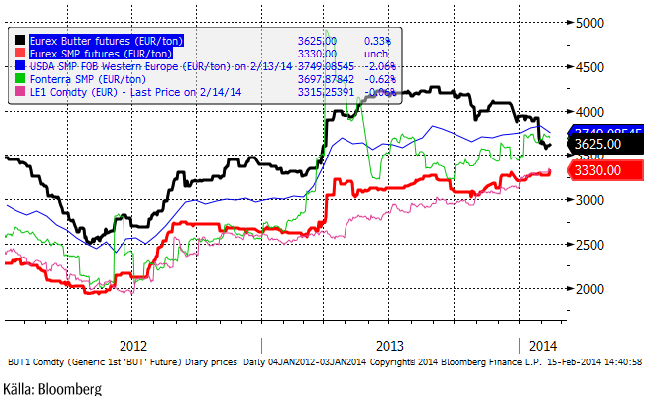
Prisfallet på smör tog en paus förra veckan och en liten prisuppgång noterades. Samtidigt steg spotkontraktet på SMP till en ny rekordnotering, 3330 euro per ton. Sammantaget innebär det en prisuppgång på mjölkråvara, basis smör och SMP.
Nedan ser vi prisutvecklingen på Eurex smör och pulver (de feta linjerna), samt på USDA:s notering av SMP (FOB Västeuropa), Chicagopriset i euro per ton, liksom Fonterras pris i diagrammet.
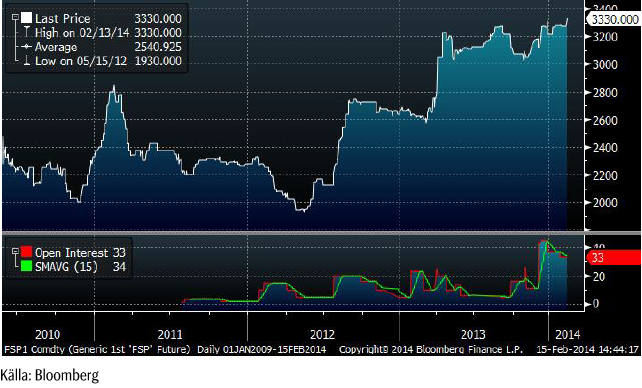
Nedan ser vi prisutvecklingen på spotkontraktet på SMP (det vid var tid kortaste till förfall) på Eurex i euro per ton. Historiken sträcker sig tillbaka till sommaren 2010 när Eurex startade sin handel i SMP.
Det svenska avräkningspriset, där källan är Arla, är något lägre, som vi ser i diagrammet nedan. Det betyder att skillnaden mellan pulver+smör och mjölkråvara fortsätter att vara stor. Med den eftersläpning vi vet att den svenska noteringen har, kan man förvänta sig att det svenska priset kommer att gå upp och / eller att Eurex-priset kommer att gå ner. Det borde vara ett bra tillfälle att sälja terminer om man är mjölkproducent.
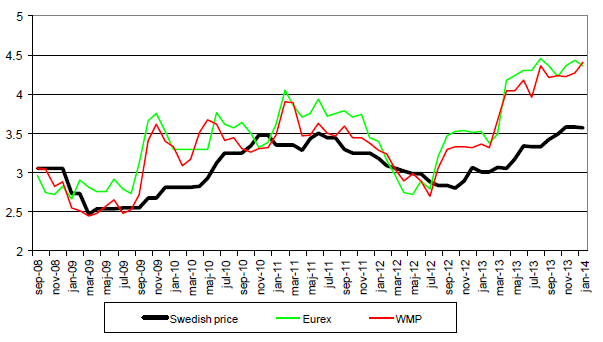
Nedan ser vi terminspriserna man får i svenska kronor från terminspriserna på SMP och smör på Eurex, omräknat till kronor per kilo mjölkråvara. Notera att hela den här prisnivån alltid ska ligga över avräkningspriset på mjölkråvara med ca 50 öre, som är en uppskattning av kostnaden för att förädla mjölkråvara till SMP och smör.
Som vi ser är genomsnittspriset som det är möjligt att säkra in över 4 kr både de närmaste sex månaderna och för det närmaste året.
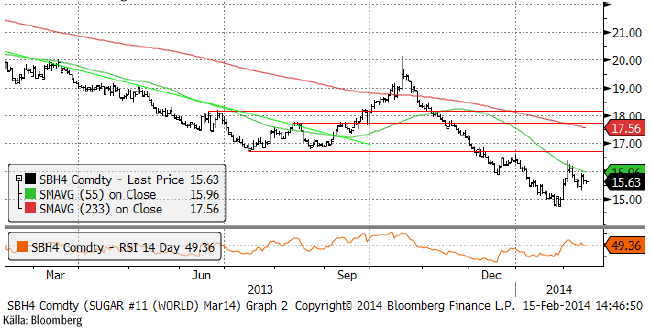
Socker
Marskontraktet på råsocker har fortsatt att rekylera, samtidigt som aktörer i Brasilien sagt att det blivit permanenta skador på växande sockerrör pga torkan. Indien gjorde slag i saken och införde exportstöd, i strid med WTO-reglerna och trots protester från Thailand och Brasilien. I fredags publicerade Indiens jordbruksdepartement en prognos för årets skörd. Landets produktion av sockerrör (inte detsamma som socker) väntas öka till från 341.2 mt till 345.9 mt.
Det är svårt att säga om den här rekylen nedåt kommer att följas av ytterligare ett kliv uppåt, men det skulle inte förvåna om det gör det.
Vi är dock hellre köpta kaffe än socker.
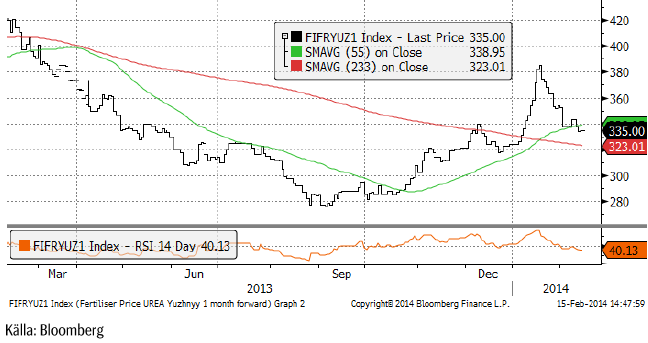
Gödsel
Urean fortsatte att rekylera tillbaka, men är alltjämt i stigande trend och bör få stöd på de här nivåerna.
[box]SEB Veckobrev Jordbruksprodukter är producerat av SEB Commodities Sales desk och publiceras i samarbete och med tillstånd på Råvarumarknaden.se[/box]
Detta marknadsföringsmaterial, framtaget av SEB’s Commodities Sales desk, har upprättats enbart i informationssyfte.
Även om innehållet är baserat på källor som SEB bedömt som tillförlitliga ansvarar SEB inte för fel eller brister i informationen. Den utgör inte oberoende, objektiv investeringsanalys och skyddas därför inte av de bestämmelser som SEB har infört för att förebygga potentiella intressekonflikter. Yttranden från SEB’s Commodities Sales desk kan vara oförenliga med tidigare publicerat material från SEB, då den senare hänvisas uppmanas du att läsa den fullständiga rapporten innan någon åtgärd vidtas.
Dokumentationen utgör inte någon investeringsrådgivning och tillhandahålls till dig utan hänsyn till dina investeringsmål. Du uppmanas att självständigt bedöma och komplettera uppgifterna i denna dokumentation och att basera dina investeringsbeslut på material som bedöms erforderligt. Alla framåtblickande uttalanden, åsikter och förväntningar är föremål för risker, osäkerheter och andra faktorer och kan orsaka att det faktiska resultatet avviker väsentligt från det förväntade. Historisk avkastning är ingen garanti för framtida resultat. Detta dokument utgör inte ett erbjudande att teckna några värdepapper eller andra finansiella instrument. SEB svarar inte för förlust eller skada – direkt eller indirekt, eller av vad slag det vara må – som kan uppkomma till följd av användandet av detta material eller dess innehåll.
Observera att det kan förekomma att SEB, dess ledamöter, dess anställda eller dess moder- och/eller dotterbolag vid olika tillfällen innehar, har innehaft eller kommer att inneha aktier, positioner, rådgivningsuppdrag i samband med corporate finance-transaktioner, investment- eller merchantbankinguppdrag och/eller lån i de bolag/finansiella instrument som nämns i materialet.
Materialet är avsett för mottagaren, all spridning, distribuering mångfaldigande eller annan användning av detta meddelande får inte ske utan SEB:s medgivande. Oaktat detta får SEB tillåta omfördelning av materialet till utvald tredje part i enlighet med gällande avtal. Materialet får inte spridas till fysiska eller juridiska personer som är medborgare eller har hemvist i ett land där sådan spridning är otillåten enligt tillämplig lag eller annan bestämmelse.
Skandinaviska Enskilda Banken AB (publ) är ett [publikt] aktiebolag och står under tillsyn av Finansinspektionen samt de lokala finansiella tillsynsmyndigheter i varje jurisdiktionen där SEB har filial eller dotterbolag.

Brent is climbing higher. Front-month is at USD 106.3/bl this morning, close to a weekly high and a USD 9/bl jump from Mondays open. This is the move we flagged as a risk earlier in the week: the market shifting from ”a deal is around the corner” to ”this is going to take longer than we thought”.

Analyst Commodities, SEB
During April, rest-of-year Brent remained remarkably stable around USD 90/bl. A stability which rested on one single assumption: the SoH reopens around 1 May. That assumption is now slowly falling apart.
As we highlighted yesterday: every week of delay beyond 1 May adds (theoretically) ish USD 5/bl to the rest-of-year average, as global inventories draw 100 million barrels per week. i.e., a mid-May reopening implies rest-of-year Brent closer to USD 100/bl, and anything pushing into June or July takes us meaningfully higher.
What’s changed in the last 48 hours:
#1: The US military has formally warned that clearing suspected sea mines from SoH could take up to six months. That is a completely different timescale from what the financial market is pricing. Even a political deal tomorrow does not immediately reopen the strait.
#2: Trump has shifted his tone from urgency to ”strategic patience”. In yesterday’s press conference: ”Don’t rush me… I want a great deal.” The market is reading this as a president no longer feeling pressured by timelines, with the naval blockade running in the background.
#3: So far, the military activity is escalating, not de-escalating. Axios reports Iran is laying more mines in SoH. The US 3rd carrier strike group (USS George H.W. Bush) is arriving with two countermine vessels. Trump yesterday ordered the US Navy to destroy any Iranian boats caught laying mines. While CNN reports that the Pentagon is actively drawing up plans to strike Iranian SoH capabilities and individual Iranian military leaders if the ceasefire collapses. i.e., NOT a attitude consistent with an imminent deal!
Spot crude and product prices eased off the early-April highs on a combination of system rerouting and deal optimism. Both now weakening. Goldman estimates April Gulf output is reduced by 14.5 mbl/d, or 57% of pre-war supply, a number that keeps getting worse the longer this drags on.
Demand-side adaptation is ongoing: S. Korea has cut its Middle East crude dependence from 69% to 56% by pulling more from the Americas and Africa, and Japan is kicking off a second round of SPR releases from 1 May. But SPRs are finite.
Ref. to the negotiations, we should not bet on speed. The current Iranian leadership is dominated by genuine hardliners willing to absorb economic pain and run the clock to extract concessions. That is not a setup for a rapid resolution. US/Israeli media briefings keep framing the delay as ”internal Iranian divisions”, the reality is more complicated and points toward weeks and months, not days.
Our point is that the complexity is large, and higher prices have only just started (given a scenario where the negotiations drag out in time). The market spent April leaning on the USD 90/bl rest-of-year assumption; that case is diminishing by the hour. If ”early May reopening” is replaced by ”June, July or later” over the next week or two, both crude and products have meaningful room to reprice higher from here. There is a high risk being short energy and betting on any immediate political resolution(!).
Down on Friday. Up on Monday. The Brent June crude oil contract traded down 5.1% last week to a close of $90.38/b. It reached a high of $103.87/b last Monday and a low of $86.09/b on Friday as Iran announced that the Strait of Hormuz was fully open for transit. That quickly changed over the weekend as the US upheld its blockade of Iranian oil exports while Iran naturally responded by closing the SoH again. The US blew a hole in the engine room of the Iranian ship TOUSKA and took custody of the ship on Sunday. Brent crude is up 5.6% this morning to $95.4/b.

The cease-fire is expiring tomorrow. The US has said it will send a delegation for a second round of negotiations in Islamabad in Pakistan. But Iran has for now rejected a second round of talks as it views US demands as unrealistic and excessive while the US is also blocking the Strait of Hormuz.
While Brent is up 5% this morning, the financial market is still very optimistic that progress will be made. That talks will continue and that the SoH will fully open by the start of May which is consistent with a rest-of-year average Brent crude oil price of around $90/b with the market now trading that balance at around $88/b.
Financial optimism vs. physical deterioration. We have a divergence where the financial market is trading negotiations, improvements and resolution while at the same time the physical market is deteriorating day by day. Physical oil flows remain constrained by disrupted flows, longer voyage times and elevated freight and insurance costs.
Financial markets are betting that a US/Iranian resolution will save us in time from violent shortages down the road. But every day that the SoH remains closed is bringing us closer to a potentially very painful point of shortages and much higher prices.
The US blockade is also a weapon of leverage against its European and Asian allies. When Iran closed the SoH it held the world economy as a hostage against the US. The US blockade of the SoH is of course blocking Iranian oil exports. But it is also an action of disruption directed towards Europe and Asia. The US has called for the rest of the world to engaged in the war with Iran: ”If you want oil from the Persian Gulf, then go and get it”. A risk is that the US plays brinkmanship with the global oil market directed towards its European and Asian allies and maybe even towards China to force them to engage and take part. Maybe unthinkable. But unthinkable has become the norm with Trump in the White House.
Wild moves yesterday. Brent crude traded to a high of $114.43/b and a low of $96.0/b and closed at $99.94/b yesterday.
US – Iran negotiations ongoing or not? What a day. Donald Trump announced that good talks were ongoing between Iran and the US and that the 48 hour deadline before bombing Iranian power plants and energy infrastructure was postponed by five days subject to success of ongoing meetings. Iranian media meanwhile stated that no meetings were ongoing at all.
Today we are scratching our heads trying to figure out what yesterday was all about.
Friends and family playing the market? Was it just Trump and his friends and family who were playing with oil and equity markets with $580m and $1.46bn in bets being placed by someone in oil and equity markets just 15 minutes before Trump’s announcement?
Was Trump pulling a TACO as he reached his political and economic pain point: Brent at $112/b, US Gas at $4/gal, SPX below 200dma and US 10yr above 4.4%?
Different Iranian factions with Trump talking with one of them? Are there real negotiations going on but with the US talking to one faction in Iran while another, the hardliners, are not involved and are denying any such negotiations going on?
Extending the ultimatum to attack and invade Kharg island next weekend? Or, is the five day delay of the deadline a tactical decision to allow US amphibious assault ships and marines to arrive in the Gulf in the upcoming weekend while US and Israeli continues to degrade Iranian military targets till then. And then next weekend a move by the US/Israel to attack and conquer for example the Kharg island?
We do not really know which it is or maybe a combination of these.
We did get some kind of TACO ydy. But markets have been waiting for some kind of TACO to happen and yesterday we got some kind of TACO. And Brent crude is now trading at $101.5/b as a result rather than at $112-114/b as it did no the high yesterday.
But what really matters in our view is the political situation on the ground in Iran. Will hardliners continue to hold power or will a more pragmatic faction gain power?
If the hardliners remain in power then oil pain should extend all the way to US midterm elections. The hardliners were apparently still in charge as of last week. Iran immediately retaliated and damaged LNG infrastructure in Qatar after Israel hit Iranian South Pars. The SoH was still closed and all messages coming out of Iran indicated defiance. Hardliners continues in power has a huge consequence for oil prices going forward. The regime has played its ’oil-weapon’ (closing or chocking the Strait of Hormuz). It is using it to achieve political goals. Deterrence: it needs to be so politically and economically expensive to attack Iran that it won’t happen again in the future. Or at least that the US/Israel thinks 10-times over before they attack again. The highest Brent crude oil closing price since the start of the war is $112.19/b last Friday. In comparison the 20-year inflation adjusted Brent price is $103/b. So Brent crude last Friday at $112.19/b isn’t a shockingly high price. And it is still far below the nominal high of $148/b from 2008 which is $220/b if inflation adjusted. So once in a lifetime Iran activates its most powerful weapon. The oil weapon. It needs to show the power of this weapon and it needs to reap political gains. Getting Brent to $112/b and intraday high of $119.5/b (9 March) isn’t a display of the power of that weapon. And it is not a deterrence against future attacks.
So if the hardliners remain in power in Iran, then the SoH will likely remain chocked all the way to US midterm elections and Brent crude will at a minimum go above the historical nominal high of $148/b from 2008.
Thus the outlook for the oil price for the rest of the year doesn’t depend all that much of whether Trump pulls a TACO or not. Stops bombing or not. It depends more on who is in charge in Iran. If it is the hardliners, then deterrence against future attacks via chocking of the SoH and high oil prices is the likely line of action. It is impacting the world but the Iranian ’oil-weapon’ is directed towards the US president and the the US midterm elections.
If a pragmatic faction gets to power in Iran, then a very prosperous future is possible. However, if power is shifting towards a more pragmatic faction in Iran then a completely different direction could evolve. Such a faction could possibly be open for cooperation with the US and the GCC and possibly put its issues versus Israel aside. Then the prosperity we have seen evolving in Dubai could be a possible future also for Iran.
So far it looks like the hardliners are fully in charge. As far as we can see, the hardliners are still fully in control in Iran. That points towards continued chocking of the SoH and oil prices ticking higher as global inventories (the oil market buffers) are drawn lower. And not just for a few more weeks, but possibly all the way to the US midterm elections.


Solkraften pressar elpriserna dagtid

Michel Gubel ger sin syn på oljemarknaden

Svag vårflod dubblar elpriserna
Brent crude up USD 9/bl on the week… ”deal around the corner” narrative fades
Market Still Betting on Timely Resolution, But Each Day Raises Shortage Risk
Market Still Betting on Timely Resolution, But Each Day Raises Shortage Risk
Brent crude up USD 9/bl on the week… ”deal around the corner” narrative fades
Michel Gubel ger sin syn på oljemarknaden
Solkraften pressar elpriserna dagtid
Svag vårflod dubblar elpriserna
-
Analys3 veckor sedan
Market Still Betting on Timely Resolution, But Each Day Raises Shortage Risk
-
Analys3 veckor sedan
Brent crude up USD 9/bl on the week… ”deal around the corner” narrative fades
-
 Nyheter2 veckor sedan
Michel Gubel ger sin syn på oljemarknaden
-
 Nyheter2 veckor sedan
Solkraften pressar elpriserna dagtid
-
Nyheter2 veckor sedan
Svag vårflod dubblar elpriserna