

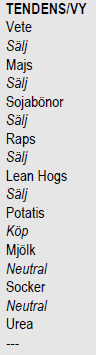
Analys
SEB Jordbruksprodukter, 15 september 2014


 WASDE-rapporten och FAO/AMIS rapport innehöll som väntat uppjusteringar av global produktion av spannmål och oljeväxter. Uppjusteringen av konsumtionen pga det lägre priset, var mindre än produktionsökningen, därför att befolkningarna i EU och Kina är försiktigare pga den lägre ekonomiska tillväxten, som i sin tur åtminstone för EU delvis beror på den ökade geopolitiska risken. För EU har priserna på mjölk och griskött rasat i spåren av Rysslands importembargo, vilket gör att foderkonsumtionen hålls tillbaka.
Rapporterna var solitt negativa för prisutvecklingen och vi behåller säljrekommendationerna från förra veckan. I otatismarknaden kan dock en vändning uppåt ha inträffat efter en längre tids prisnedgång.
Odlingsväder
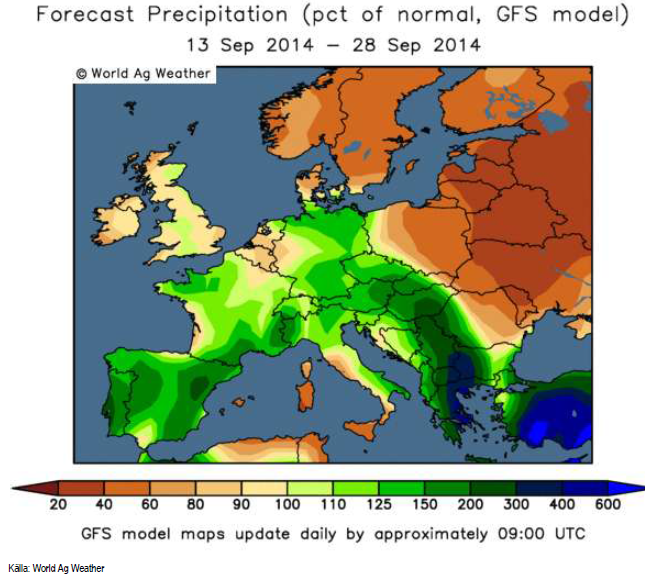
Den senaste 2-veckorprognosen med GFS-modellen för Europa visar återigen blötare väder över Spanien, Frankrike och Tyskland. Förra veckans prognos om torrt väder över Norden och Östeuropa har blivit ännu mer kompakt torr i den senaste prognosen.
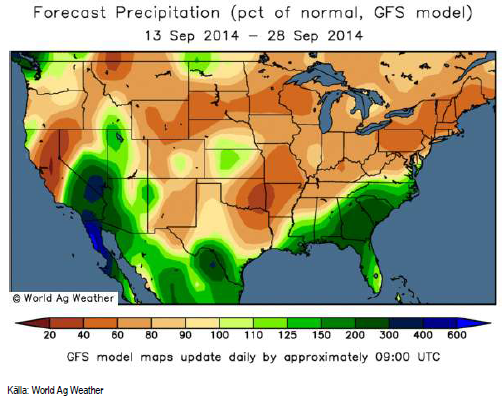
Prognoskartan för nederbörden i USA ser om något ännu torrare ut än förra veckan.
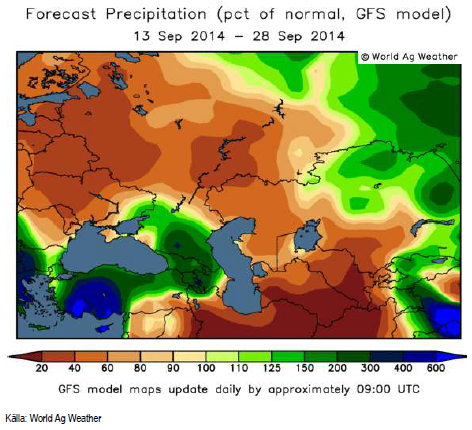
Prognosen för Ryssland och Ukraina som var åt det blöta hållet förra veckan är nu återigen solitt torr.
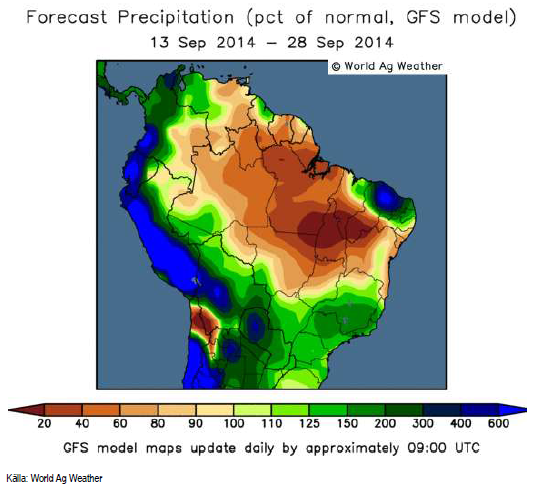
I Brasilien ser väderleksprognosen ut som förra veckan. Torkan i centrala Brasilien väntas avta. Regnen över norra Argentina har rört sig norrut och kommer att ge blötare väder över SP och MG, vilket bland annat sänker priset på socker och kaffe.
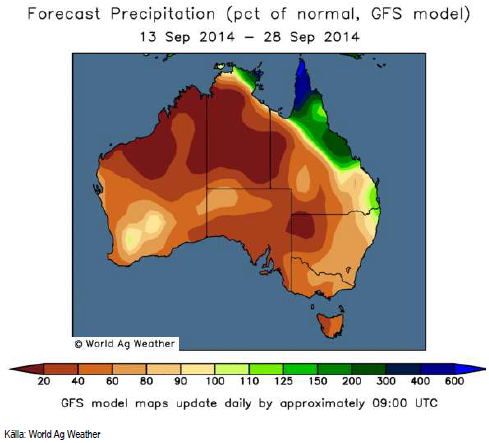
Indiens monsun blir återigen lite mindre aktiv de kommande två veckorna. Australien, som vi ser prognoskartan för nedan väntas få väsentligt mindre nederbörd de kommande två veckorna. Den senaste tiden har det varit torrt i Australien, vilket bland annat fått USDA att justera ner estimatet för veteproduktionen (se nedan).
Vete
Förra veckan noterade vi att såväl vetet som majsen brutit sina tekniska stöd och sedan rekylerat upp till stödet igen – en klassisk och mycket säker säljsignal. Matifs novembertermin har sedan dess fallit med 5% och börjar närma sig bottennoteringar.
När det gäller Matif, eller NYSE Euronext Paris kvarnvetekontrakt finns mer än fundamenta som kan påverka priset, men som ännu inte gjort det. Förra veckan redogjorde jag inledningsvis om börsens integritet.
Den här veckan kom information om att Senalias silo är full och tills vidare inte tar emot leveranser. Vi får väl anta att samma sak i praktiken gäller Socomac-silon. Samtidigt har det framkommit att det går att leverera vete på Matif-kontraktet med falltal 170, dvs ett fodervete. Du kan alltså inte som terminssäljare leverera in och du kan inte som terminsköpare ta leverans utan att ta vetet från silon. Som terminsköpare måste du ställa in dig på att ta leverans av fodervete (falltal 170) och ta vetet därifrån. Fodervete handlas i Frankrike till 130 – 140 euro per ton. Detta är antagligen en ”rätt” prisnivå för Matifkontraktet. Det är något märkligt att skillnaden mellan LIFFEkontraktet som är fodervete och Matif fortsätter att vidgas.
Utöver detta, finns en annan indikator på värdet av Matif-kontraktet (visavi andra veteterminskontrakt) och det är om importländer accepterar franskt kvarnvete, som kvarnvete.
I onsdags gick Algeriets tender av stapeln. De har tidigare alltid köpt 70% franskt vete. Av allt att döma, har Algeriet inte köpt franskt vete. Det är negativt för priset på franskt kvarnvete.
På måndag tillkännages Saudiarabiens tender, där budgivningen gick in i torsdags.
Man kan säga så här att om Algeriet och Saudiarabien accepterat franskt vete, så betyder det att Matif stiger. Om de inte gjort det, så borde Matif falla.
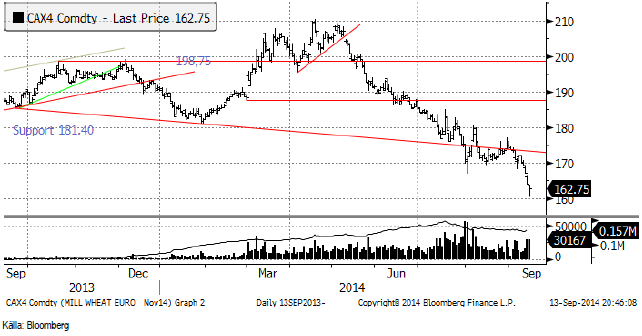
Matifs novemberkontrakt fortsatte inledningsvis på veckan det prisfall som inleddes i slutet av augusti, men fann stöd strax under 170 euro och handlades i fredags upp till 172 vid stängning klockan 18:30.
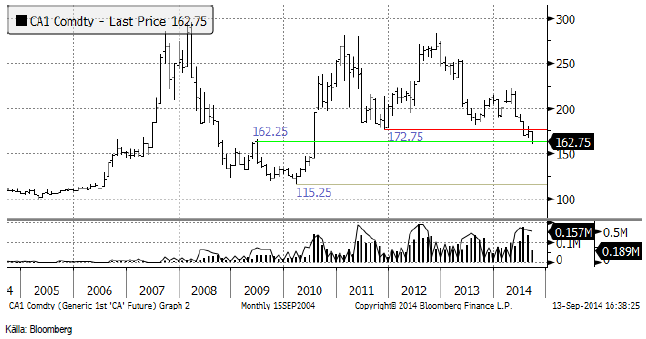
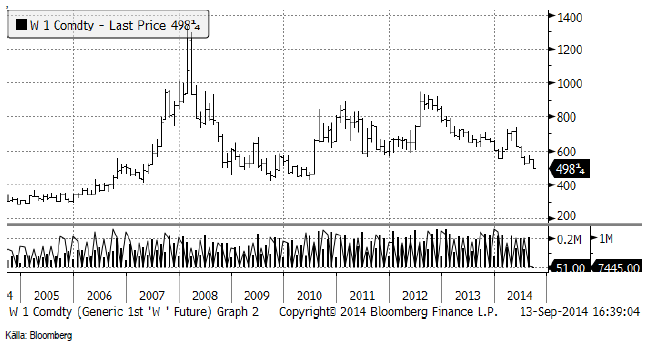
I nedanstående diagram ser vi hur Matifs ”spotkontrakt” utvecklat sig de senaste tio åren. Som vi ser finns stöd på 162.25 och därunder på 115.25 euro. Man kanske ska komma ihåg att 101 euro inte längre är ett golv för vetepriset inom EU.
Chicagovetet (december) bröt det tekniska stödet på 542 cent under veckan, föll lite till och har sedan rekylerat upp mot stödet igen. Priset på 535.25 cent i fredags erbjuder ett säljtillfälle. Tekniskt stöd finns på lite drygt 400 cent.
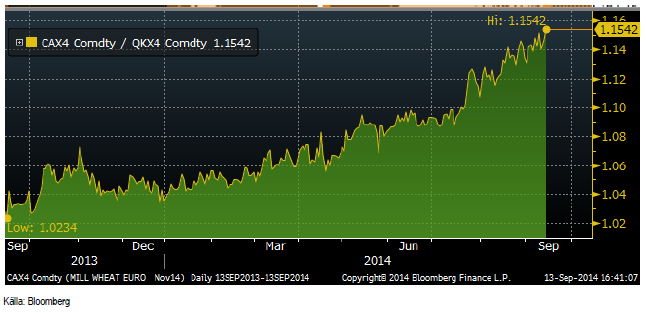
Matifs novemberkontrakt har blivit dyrare i förhållande till det engelska fodervetekontraktet. Förra veckan var skillnaden 14.6% och nu är den som vi ser 15.4%.
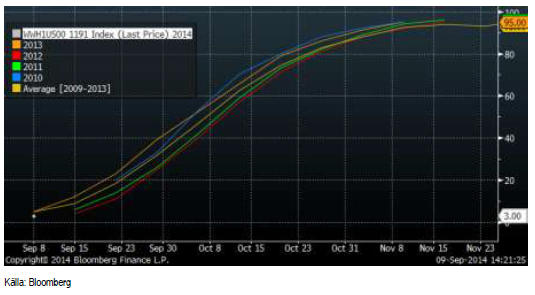
Sådden av höstvete har kommit igång i USA. Den 7 september var 3% sått. Innan månaden är slut ska 33% vara sått, om det sker i normal takt.
Det kom flera rapporter i veckan som gick. I tisdags (9 september) publicerade det franska jordbruksdepartementet, FranceAgriMer en uppdatering av produktionsestimaten för landet. Skörden av majs höjdes till 16.37 mt från 15.44 mt (förra året 15.03). Soft wheat höjdes till 37.53 mt från 37.3 (36.87 förra året). Korn sänktes däremot ffrån 11.65 till 11.56 mt (10.32 förra året).
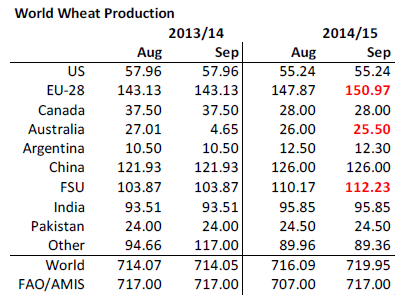
I torsdags kom både USDA med sin WASDE och FAO/AMIS med sin septemberrapport. USDA justerar upp produktionen i EU-28 med 3 mt och i FSU med 2 mt. De justerar ner Australiens produktion med 0.5 mt (till att börja med) eftersom det är torrt där. Global produktion justeras upp till 720 mt, vilket är ett rekord.
FAO/AMIS justerar upp global produktion med 10 mt.
Precis som väntat justerar USDA upp foderefterfrågan eftersom priset är lägre. Men som väntat justeras inte konsumtionen upp lika mycket som produktionen, även om det är ett rekord vad gäller konsumtionen. Utgående lager justeras upp för EU-28 särskilt mycket.
FAO/AMIS är inne på samma linje, utgående lager justeras upp med 8 mt.
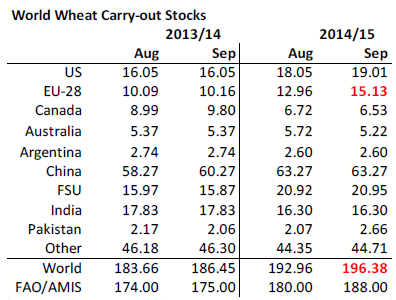
Det är väl uppenbart att detta är en rapport som är negativ för prisutvecklingen.
Non-commercials i CFTC:s rapport har sålt 12000 kontrakt och är nu nettosålda 78000 kontrakt.
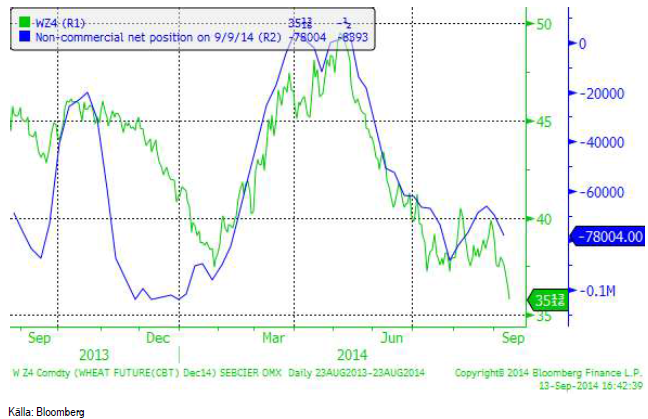
Vi tror inte att botten är nådd och rekommenderar fortsatt sälj på vete.
Majs
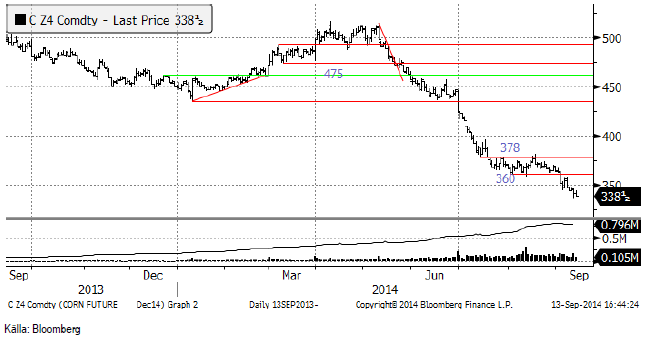
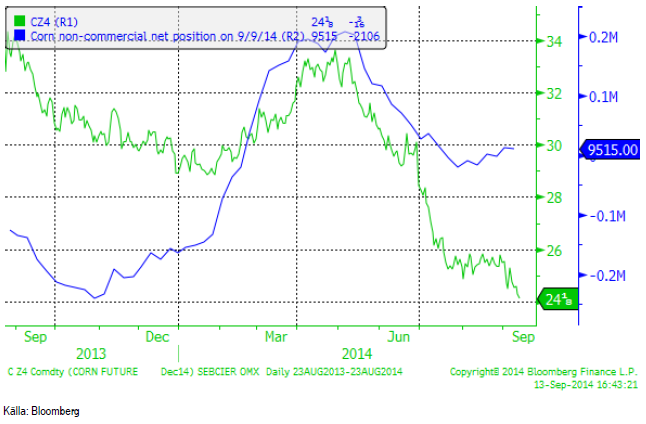
Decemberkontraktet CZ4, som erbjöd ett klassiskt tillfälle att gå kort för en vecka sedan, har fallit med 5% sedan dess. 338 cent är inte någon teknisk nivå där en vändning kommer att ske. 300 cent är mer sannolikt som en sådan nivå.
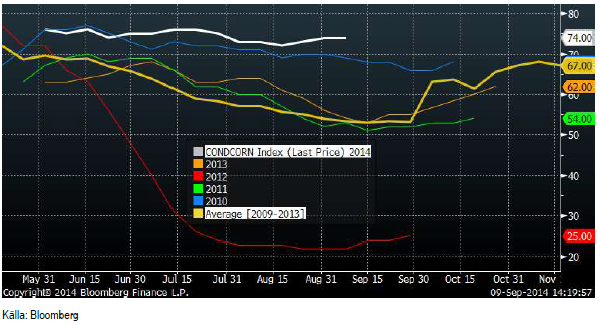
Crop condition låg oförändrat på höga 74% good/excellent i måndags.
USDA höjer som väntat produktionen för USA genom att yield justeras upp till 171.7 bu/acre. Detta ter sig fortfarande lågt i jämförelse med var privata estimat ligger. På global basis justeras dock produktionen ner i Kina och i Ryssland och Ukraina, eftersom det varit torrt där, vilket vi också kunnat se av nederbördskartorna tidigare. På global basis justeras ändå produktionen upp med 2 mt till rekordhöga 987.50 mt.
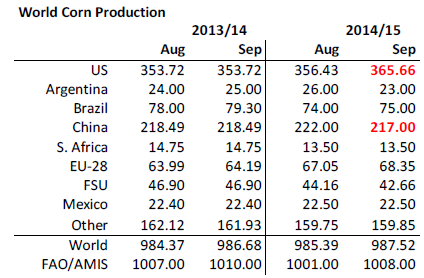
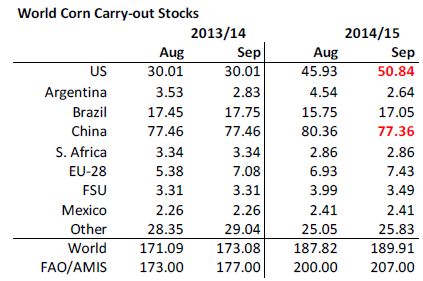
Utgående lager väntas öka i USA, framförallt. På global basis ökar utgående lager med 2 mt till 189.91 mt. FAO/AMIS är ännu mer frimodiga och justerar upp utgående lager till 207 mt (+7 mt).
USDA sänker priset vid ”farm gate” till 320 till 380 cent. Detta är antagligen lite högt.
Non-commercials köpte ytterligare några kontrakt i veckan, men är i princip ”neutral” i ett historiskt perspektiv.
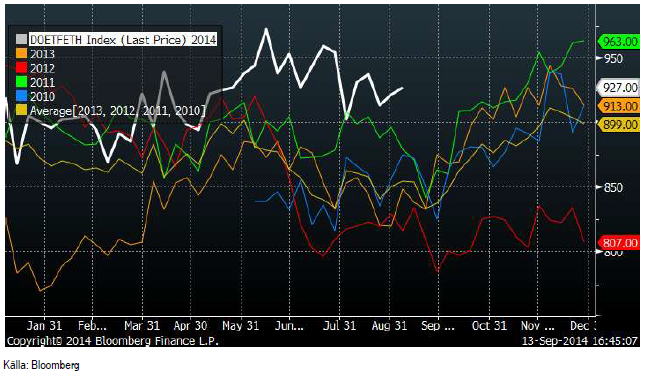
DOE rapporterade i veckan som gick att etanolproduktionen i USA ökade med ytterligare 6000 fat till 927,000 fat per dag. Oljepriset föll ganska kraftigt i veckan som gick.
Vi fortsätter med säljrekommendation.
Sojabönor
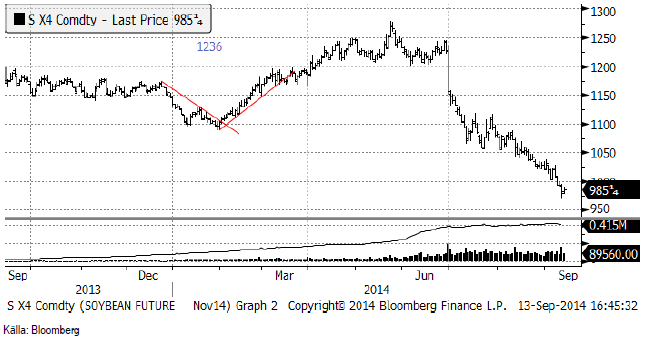
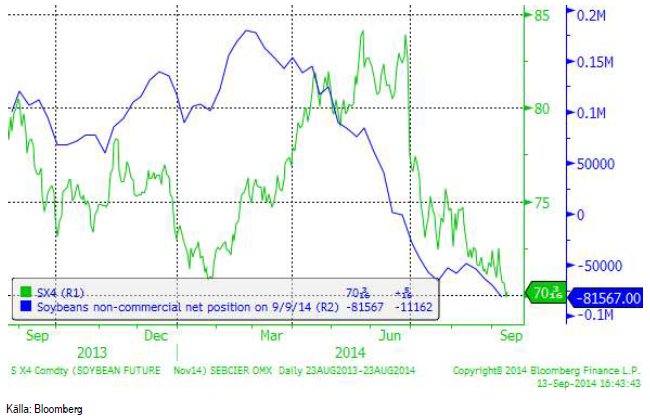
Sojabönorna (SX4) fortsatte falla i veckan som gick, men det var sojamjölet som agerade sänke, medan sojaoljan steg.
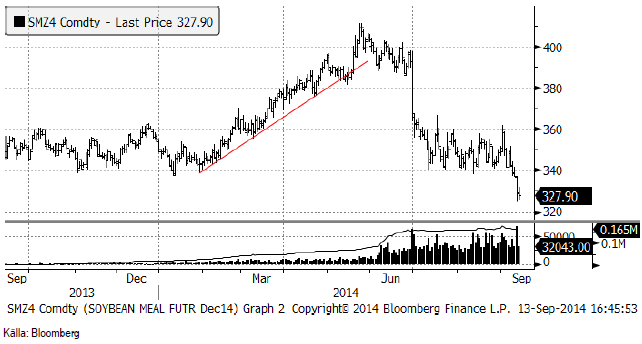
Sojamjölet bröt alltså det starka tekniska stödet vid 340 dollar per short ton i tisdags och föll sedan kraftigt, i synnerhet efter WASDE-rapporten i torsdags. I fredags skedde en viss konsolidering och det är möjligt att veckan börjar med en rekyl uppåt, mot utbrottsnivån vid 340 dollar. Om detta sker är det ett säljtillfälle, på samma sätt som rekylen uppåt i vete och majs var det förra veckan.
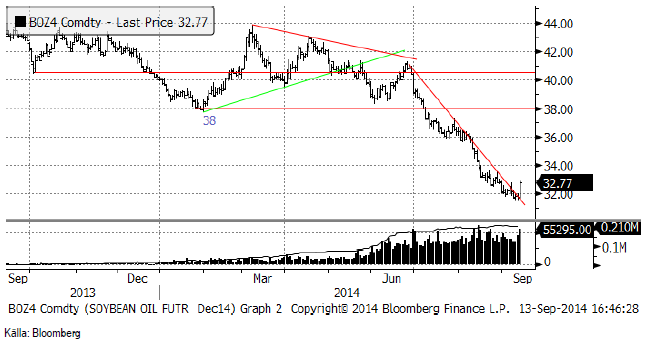
När sojamjölet faller mer än sojabönorna måste sojaoljan stiga. Annars går inte ekvationen ihop. Detta är också vad som hände, men först i fredags. Sojaoljan bröt motståndet för den fallande pristrenden. Detta är en köpsignal för sojaoljan. Uppgången skedde dessutom på mycket högre omsättning i marknaden, vilket är ett tecken på att rörelsen är åt rätt håll – uppåt.
Crop condition för sojabönor låg oförändrat på höga 72% good/excellent i måndagens rapport.
USDA höjer produktionen i USA pga högre yield från 104 till 106.50 ton. Även Brasiliens produktion höjs med 3 mt till 94 mt. På global basis höjs produktionen från 304.7 till 311.1 mt.
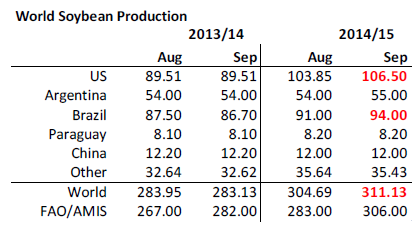
Utgående balans höjs med 4.6 mt från 85.6 till 90.2. Högre lager väntas i stort sett i alla länder. FAO/AMIS går ännu längre och höjer utgående lager med 11 mt till 42 mt.
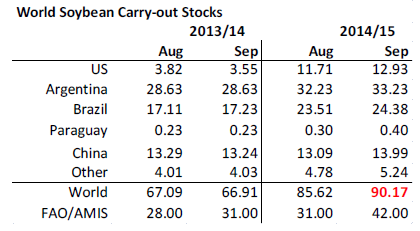
USDA skriver att de sänkt det genomsnittliga priset som bonden i USA får betalt till mellan 9 och 11 dollar per bushel.
Non-commmercials sålde återigen terminer enligt fredagens rapport, som visar ställningen per i tisdags. De är nu sålda netto 81,567 kontrakt. Det är den mest negativa positionen de senaste åren.
Vi behåller säljrekommendationen för sojabönor och för sojamjöl. Vi tror att sojaoljan kan ha funnit sin botten.
Raps
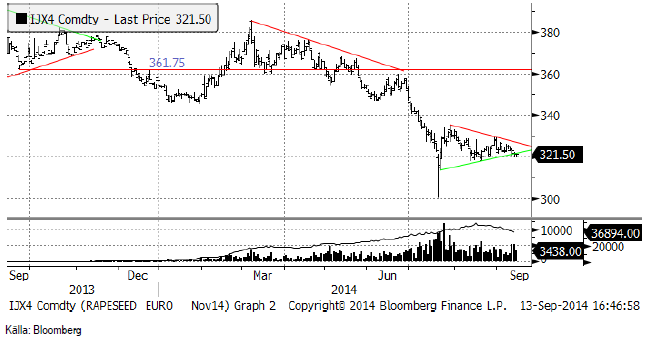
Novemberkontraktet på raps har bildat en teknisk triangelformation i kursdiagrammet, som bröts på nedsidan i veckan. Det är en stark säljsignal.
FranceAgriMer, som rapporterade i tisdags höjde estimatet för Frankrikes skörd av raps från 5.53 mt till 5.57 mt (förra året 4.37 mt).
Strategie Grains höjer sitt estimat för EU:s produktion av raps 2014/15 med 300 000 ton till rekordhöga 23.2 mt. Ökningen är ett resultat av årets gynnsamma odlingsförhållanden med rapporter från fält som bekräftar en mycket god avkastning under senare delen av sommaren.
Vi tror att priset fallet till 300 euro i första hand. och behåller säljrekommendationen på rapsfröterminer.
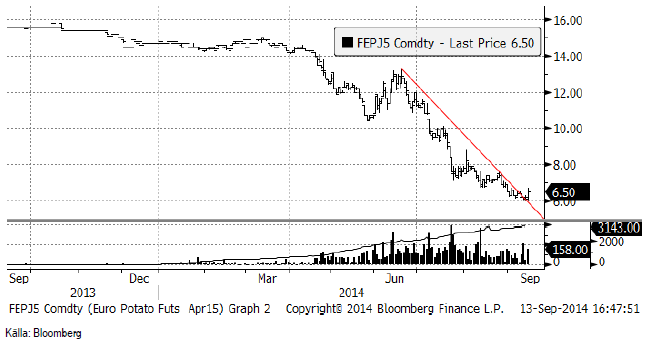
Potatis
Potatispriset vände upp i fredags och bröt trenden för den fallande pristrenden. Från 6 euro per deciton avancerade priset till 6.50 i fredags. Det är ett tydligt tecken på att vi förmodligen sett botten på priset för den här gången. Motstånd finns på 8 euro.
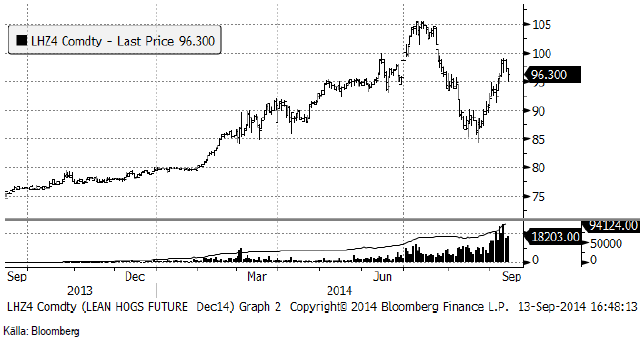
Gris
Lean hogs decemberkontrakt steg initialt under veckan, men vände sedan nedåt under torsdagen och föll ganska kraftigt under fredagen. Det är troligt att rekylen fortsätter nedåt de kommande veckorna.
Oktoberkontraktet på EUREX Hogs ligger kvar på samma pris som förra veckan, 1.60 euro per Kg.
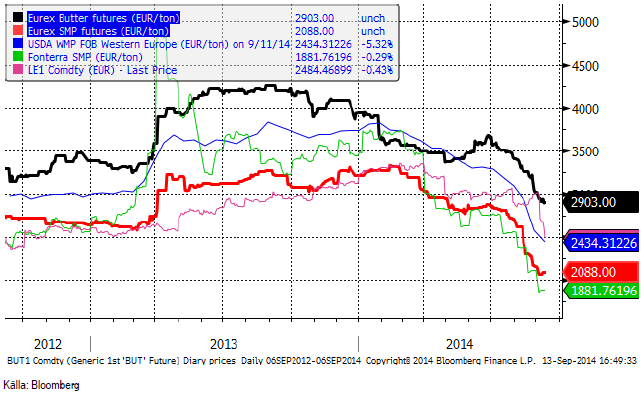
Mjölk
Som vi ser av diagrammet nedan pekar alla priskurvor brant nedåt. SMP-terminerna på Eurex rekylerade uppåt något, medan smörpriset fortsatte falla.
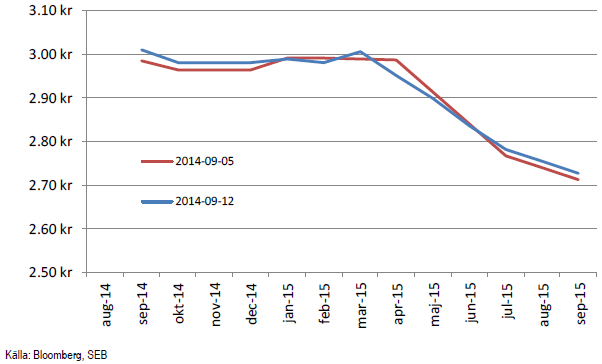
Nedan ser vi terminspriserna för mjölkråvara basis köpkurserna på terminerna för smör och SMP på EUREX, omräknat till kronor per kilo. Terminspriserna i kronor per kilo är för kortare löptider något högre, vilket till stor del beror på att kronan har sjunkit mot euron sedan förra veckan.
Socker
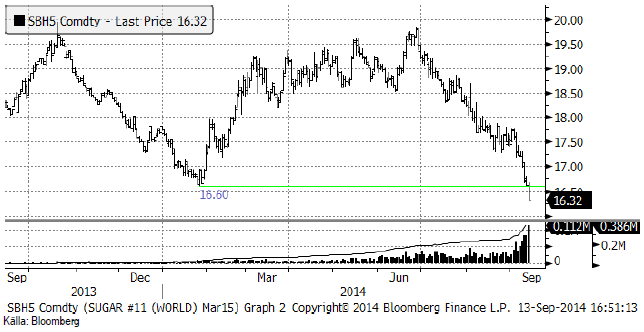
Priset på socker fortsatte falla i veckan. Kontraktet för leverans i mars nästa år föll ner till 16.32 cent och passerade därmed rakt igenom det tekniska stödet på 16.60 från den botten som noterades i början av året.
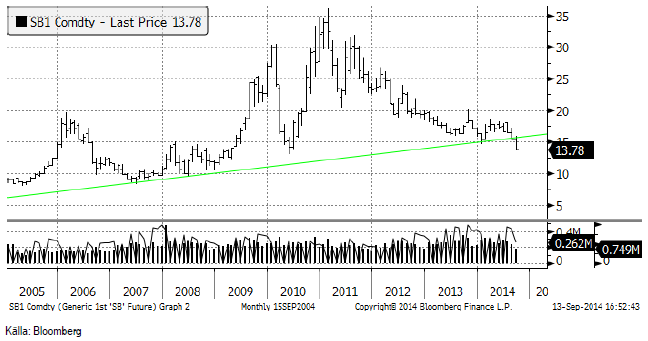
Nedan ser i prisutvecklingen för spotkontraktet de senaste tio åren. Den uppåtgående trenden från tidigt 00-tal bröts i veckan som gick. Det, om något, är ett tecken på att ”råvaruboomen” är över.
[box]SEB Veckobrev Jordbruksprodukter är producerat av SEB Commodities Sales desk och publiceras i samarbete och med tillstånd på Råvarumarknaden.se[/box]
Detta marknadsföringsmaterial, framtaget av SEB’s Commodities Sales desk, har upprättats enbart i informationssyfte.
Även om innehållet är baserat på källor som SEB bedömt som tillförlitliga ansvarar SEB inte för fel eller brister i informationen. Den utgör inte oberoende, objektiv investeringsanalys och skyddas därför inte av de bestämmelser som SEB har infört för att förebygga potentiella intressekonflikter. Yttranden från SEB’s Commodities Sales desk kan vara oförenliga med tidigare publicerat material från SEB, då den senare hänvisas uppmanas du att läsa den fullständiga rapporten innan någon åtgärd vidtas.
Dokumentationen utgör inte någon investeringsrådgivning och tillhandahålls till dig utan hänsyn till dina investeringsmål. Du uppmanas att självständigt bedöma och komplettera uppgifterna i denna dokumentation och att basera dina investeringsbeslut på material som bedöms erforderligt. Alla framåtblickande uttalanden, åsikter och förväntningar är föremål för risker, osäkerheter och andra faktorer och kan orsaka att det faktiska resultatet avviker väsentligt från det förväntade. Historisk avkastning är ingen garanti för framtida resultat. Detta dokument utgör inte ett erbjudande att teckna några värdepapper eller andra finansiella instrument. SEB svarar inte för förlust eller skada – direkt eller indirekt, eller av vad slag det vara må – som kan uppkomma till följd av användandet av detta material eller dess innehåll.
Observera att det kan förekomma att SEB, dess ledamöter, dess anställda eller dess moder- och/eller dotterbolag vid olika tillfällen innehar, har innehaft eller kommer att inneha aktier, positioner, rådgivningsuppdrag i samband med corporate finance-transaktioner, investment- eller merchantbankinguppdrag och/eller lån i de bolag/finansiella instrument som nämns i materialet.
Materialet är avsett för mottagaren, all spridning, distribuering mångfaldigande eller annan användning av detta meddelande får inte ske utan SEB:s medgivande. Oaktat detta får SEB tillåta omfördelning av materialet till utvald tredje part i enlighet med gällande avtal. Materialet får inte spridas till fysiska eller juridiska personer som är medborgare eller har hemvist i ett land där sådan spridning är otillåten enligt tillämplig lag eller annan bestämmelse.
Skandinaviska Enskilda Banken AB (publ) är ett [publikt] aktiebolag och står under tillsyn av Finansinspektionen samt de lokala finansiella tillsynsmyndigheter i varje jurisdiktionen där SEB har filial eller dotterbolag.


The latest weekly report from the US DOE showed a substantial drawdown across key petroleum categories, adding more upside potential to the fundamental picture.

Commercial crude inventories (excl. SPR) fell by 5.8 million barrels, bringing total inventories down to 415.1 million barrels. Now sitting 11% below the five-year seasonal norm and placed in the lowest 2015-2022 range (see picture below).
Product inventories also tightened further last week. Gasoline inventories declined by 2.1 million barrels, with reductions seen in both finished gasoline and blending components. Current gasoline levels are about 3% below the five-year average for this time of year.
Among products, the most notable move came in diesel, where inventories dropped by almost 4.1 million barrels, deepening the deficit to around 20% below seasonal norms – continuing to underscore the persistent supply tightness in diesel markets.
The only area of inventory growth was in propane/propylene, which posted a significant 5.1-million-barrel build and now stands 9% above the five-year average.
Total commercial petroleum inventories (crude plus refined products) declined by 4.2 million barrels on the week, reinforcing the overall tightening of US crude and products.


A classic case of “buy the rumor, sell the news” played out in oil markets, as Brent crude has dropped sharply – down nearly USD 10 per barrel since yesterday evening – following Iran’s retaliatory strike on a U.S. air base in Qatar. The immediate reaction was: “That was it?” The strike followed a carefully calibrated, non-escalatory playbook, avoiding direct threats to energy infrastructure or disruption of shipping through the Strait of Hormuz – thus calming worst-case fears.
After Monday morning’s sharp spike to USD 81.4 per barrel, triggered by the U.S. bombing of Iranian nuclear facilities, oil prices drifted sideways in anticipation of a potential Iranian response. That response came with advance warning and caused limited physical damage. Early this morning, both the U.S. President and Iranian state media announced a ceasefire, effectively placing a lid on the immediate conflict risk – at least for now.
As a result, Brent crude has now fallen by a total of USD 12 from Monday’s peak, currently trading around USD 69 per barrel.
Looking beyond geopolitics, the market will now shift its focus to the upcoming OPEC+ meeting in early July. Saudi Arabia’s decision to increase output earlier this year – despite falling prices – has drawn renewed attention considering recent developments. Some suggest this was a response to U.S. pressure to offset potential Iranian supply losses.
However, consensus is that the move was driven more by internal OPEC+ dynamics. After years of curbing production to support prices, Riyadh had grown frustrated with quota-busting by several members (notably Kazakhstan). With Saudi Arabia cutting up to 2 million barrels per day – roughly 2% of global supply – returns were diminishing, and the risk of losing market share was rising. The production increase is widely seen as an effort to reassert leadership and restore discipline within the group.
That said, the FT recently stated that, the Saudis remain wary of past missteps. In 2018, Riyadh ramped up output at Trump’s request ahead of Iran sanctions, only to see prices collapse when the U.S. granted broad waivers – triggering oversupply. Officials have reportedly made it clear they don’t intend to repeat that mistake.
The recent visit by President Trump to Saudi Arabia, which included agreements on AI, defense, and nuclear cooperation, suggests a broader strategic alignment. This has fueled speculation about a quiet “pump-for-politics” deal behind recent production moves.
Looking ahead, oil prices have now retraced the entire rally sparked by the June 13 Israel–Iran escalation. This retreat provides more political and policy space for both the U.S. and Saudi Arabia. Specifically, it makes it easier for Riyadh to scale back its three recent production hikes of 411,000 barrels each, potentially returning to more moderate increases of 137,000 barrels for August and September.
In short: with no major loss of Iranian supply to the market, OPEC+ – led by Saudi Arabia – no longer needs to compensate for a disruption that hasn’t materialized, especially not to please the U.S. at the cost of its own market strategy. As the Saudis themselves have signaled, they are unlikely to repeat previous mistakes.
Conclusion: With Brent now in the high USD 60s, buying oil looks fundamentally justified. The geopolitical premium has deflated, but tensions between Israel and Iran remain unresolved – and the risk of missteps and renewed escalation still lingers. In fact, even this morning, reports have emerged of renewed missile fire despite the declared “truce.” The path forward may be calmer – but it is far from stable.
Analys
A muted price reaction. Market looks relaxed, but it is still on edge waiting for what Iran will do
Brent crossed the 80-line this morning but quickly fell back assigning limited probability for Iran choosing to close the Strait of Hormuz. Brent traded in a range of USD 70.56 – 79.04/b last week as the market fluctuated between ”Iran wants a deal” and ”US is about to attack Iran”. At the end of the week though, Donald Trump managed to convince markets (and probably also Iran) that he would make a decision within two weeks. I.e. no imminent attack. Previously when when he has talked about ”making a decision within two weeks” he has often ended up doing nothing in the end. The oil market relaxed as a result and the week ended at USD 77.01/b which is just USD 6/b above the year to date average of USD 71/b.

Brent jumped to USD 81.4/b this morning, the highest since mid-January, but then quickly fell back to a current price of USD 78.2/b which is only up 1.5% versus the close on Friday. As such the market is pricing a fairly low probability that Iran will actually close the Strait of Hormuz. Probably because it will hurt Iranian oil exports as well as the global oil market.
It was however all smoke and mirrors. Deception. The US attacked Iran on Saturday. The attack involved 125 warplanes, submarines and surface warships and 14 bunker buster bombs were dropped on Iranian nuclear sites including Fordow, Natanz and Isfahan. In response the Iranian Parliament voted in support of closing the Strait of Hormuz where some 17 mb of crude and products is transported to the global market every day plus significant volumes of LNG. This is however merely an advise to the Supreme leader Ayatollah Ali Khamenei and the Supreme National Security Council which sits with the final and actual decision.
No supply of oil is lost yet. It is about the risk of Iran closing the Strait of Hormuz or not. So far not a single drop of oil supply has been lost to the global market. The price at the moment is all about the assessed risk of loss of supply. Will Iran choose to choke of the Strait of Hormuz or not? That is the big question. It would be painful for US consumers, for Donald Trump’s voter base, for the global economy but also for Iran and its population which relies on oil exports and income from selling oil out of that Strait as well. As such it is not a no-brainer choice for Iran to close the Strait for oil exports. And looking at the il price this morning it is clear that the oil market doesn’t assign a very high probability of it happening. It is however probably well within the capability of Iran to close the Strait off with rockets, mines, air-drones and possibly sea-drones. Just look at how Ukraine has been able to control and damage the Russian Black Sea fleet.
What to do about the highly enriched uranium which has gone missing? While the US and Israel can celebrate their destruction of Iranian nuclear facilities they are also scratching their heads over what to do with the lost Iranian nuclear material. Iran had 408 kg of highly enriched uranium (IAEA). Almost weapons grade. Enough for some 10 nuclear warheads. It seems to have been transported out of Fordow before the attack this weekend.
The market is still on edge. USD 80-something/b seems sensible while we wait. The oil market reaction to this weekend’s events is very muted so far. The market is still on edge awaiting what Iran will do. Because Iran will do something. But what and when? An oil price of 80-something seems like a sensible level until something do happen.


Sommarvädret styr elpriset i Sverige

Samtal om flera delar av råvarumarknaden
Tightening fundamentals – bullish inventories from DOE

Jonas Lindvall är tillbaka med ett nytt oljebolag, Perthro, som ska börsnoteras

Oljan, guldet och marknadens oroande tystnad

Stor uppsida i Lappland Guldprospekterings aktie enligt analys

Brookfield ska bygga ett AI-datacenter på hela 750 MW i Strängnäs
Silverpriset släpar efter guldets utveckling, har mer uppsida

Tradingfirman XTX Markets bygger datacenter i finska Kajana för 1 miljard euro

Uppgången i oljepriset planade ut under helgen
-
 Nyheter3 veckor sedan
Stor uppsida i Lappland Guldprospekterings aktie enligt analys
-
 Nyheter4 veckor sedan
Brookfield ska bygga ett AI-datacenter på hela 750 MW i Strängnäs
-
 Nyheter3 veckor sedan
Silverpriset släpar efter guldets utveckling, har mer uppsida
-
 Nyheter4 veckor sedan
Tradingfirman XTX Markets bygger datacenter i finska Kajana för 1 miljard euro
-
 Nyheter2 veckor sedan
Uppgången i oljepriset planade ut under helgen
-

 Nyheter2 veckor sedan
Låga elpriser i sommar – men mellersta Sverige får en ökning
-
Analys2 veckor sedan
Very relaxed at USD 75/b. Risk barometer will likely fluctuate to higher levels with Brent into the 80ies or higher coming 2-3 weeks
-

 Nyheter1 vecka sedan
Mahvie Minerals växlar spår – satsar fullt ut på guld