

Analys
SEB – Råvarukommentarer, 15 september 2014

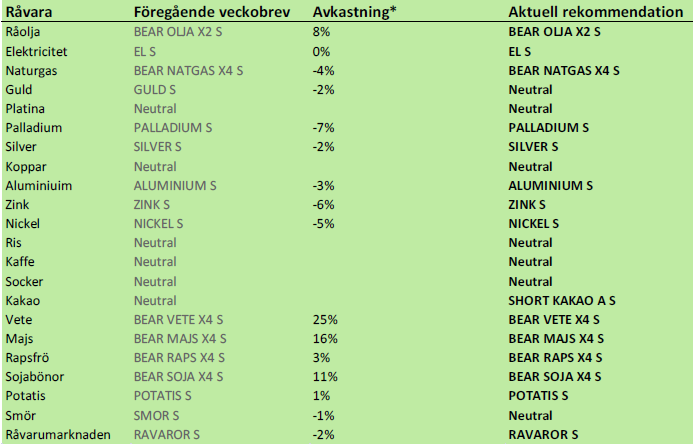
Rekommendationer
Råolja – Brent
OPECs strategi är att hålla oljepriset på en nivå där ökningen av global efterfrågan på olja kan mättas med en ökning av produktionen av olja utanför OPEC. OPEC kan fortsätta att producera på nuvarande nivå i många år, utan allt för stora investeringar.
Oljepriset ska alltså enligt OPEC balansera på den nivå där break-even ligger utanför OPEC. OPEC själva producerar på i genomsnitt 20 dollar per fat, utan tillväxt. Det finns många olika produktionskostnader utanför OPEC, inte minst beroende på olika höga produktionsskatter. Om global ökning av oljeefterfrågan är hög, måste priset vara högre, för att stimulera produktionstillväxt utanför OPEC. Om global efterfrågetillväxt är låg, så behöver stimulansen utanför OPEC inte vara lika hög. Så här ser prognosen ut från OPEC:
(Non-OPEC supply growth) jämfört med (Global demand growth)
2013: +1.3 mb/d versus +1.2 mb/d
2014: +1.6 mb/d versus +0.9 mb/d
2015: +1.3 mb/d versus +1.2 mb/d
I dagens scenario av relativt svag global efterfrågeökning har vi alltså en situation där 100 dollar per fat ger en stark stimulans till produktionsökning utanför OPEC under 2014 med +1.6 mb/d. Samtidigt leder 100 dollar per fat till en svag konsumtionsökning på bara 0.9 mb/d under 2014, dvs OPEC:s del av kakan krymper med 0.7 mb/d under året.
100 dollar per fat är alltså för högt i år, enligt OPEC. OPEC kan dra ner produktionen för att upprätthålla 100 dollar per fat. Saudiarabien sänkte också helt följdriktigt produktionen med 400 kb/d i augusti. Detta skedde också samtidigt som Libyen kom tillbaka som producent med 7-800 kb/d i produktionstakt.
Så vad kommer OPEC att göra framöver? Saudiarabien kommer knappast att vilja ta på sig hela ransoneringsjobbet. De andra måste också komma in på banan. Ska man komma till förhandlingsbordet är det bäst att komma med så upp-pumpad produktion som möljigt, en hög nivå att förhandla ner ifrån. Således är det ogynnsamt även för Saudiarabien att dra ner allt för mycket.
Vid en svag global efterfrågesituation ska oljepriset vara 80 dollar per fat för att dämpa produktionstillväxten utanför OPEC. Denna sanning förändras dock snabbt, eftersom ”frackingtekniken” förbättras i så snabb takt, och för att stimulera global tillväxt i efterfrågan.
Om efterfrågan är stark ska priset vara 100 dollar per fat.
MENA-risken är fortsatt väldigt hög vad gäller utbudssidan. Libyens oljeproduktion kan försvinna med kort varsel lika fort som den tillkommit.
Raffinaderierna håller just nu på att ställa om till vinterproduktion och de kommer tillbaka till full kapacitet under den andra halvan av oktober. Då kan oljemarknaden stramas upp igen.
Irans premiärminister Rouhani måste få avtalet om kärnvapen/kärnkraft i hamn innan årets slut. Efter det kan det bli politiskt svårt att köra processen vidare.
Brent crude är nu på 98.7 dollar par fat, alltså bara 1.3 dollar under 100 dollar, som är den tydligt önskade nivån för OPEC. Strukturen i marknaden är emellertid markant annorlunda än den vi sett det senaste året. Det råder produktionsöverskott i marknaden och den är i starkt contango i början av terminskurvan. Notera också att priset har fallit samtidigt som dollarn har stärkts. Dollarförstärkningen motsvarar ett prisfall på 5 dollar per fat.
Det kom också en ny IEA-rapport i veckan. Den karaktäriserades av svag tillväxt i oljeefterfrågan. Svagheten är störst i EU och i Kina. Ökningen i efterfrågan under det andra kvartalet i år stannade på bara 0.5 mb/d mätt på årsbasis!
Samtidigt var non-OPEC-supply growth +1.6 mb/d. OPEC:s kaka krymper.
Detta beror på den tekniska revolution som fracking innebär, som har ersatt den gamla utbudskurvan med en helt ny. Lägg därtill att USA.s energipolitik med välvilja ser på när frackingtekniken ökar inhemsk produktion och sänker beroendet av MENA och OPEC. Med ett oberoende vad gäller olja slipper USA rycka ut för att stabilisera den kroniskt instabila MENA-regionen. Värdet av att slippa kostnaderna för att agera global polismakt är naturligtvis mycket, mycket stort. Väldigt många globala bråkmakare får sin finansiering från ett högt oljepris och fracking är det bästa, och ändå fredliga vapnet mot dessa. Det finns alltså även en säkerhetspolitisk anledning till att via fracking, ta knäcken på det höga oljepriset.
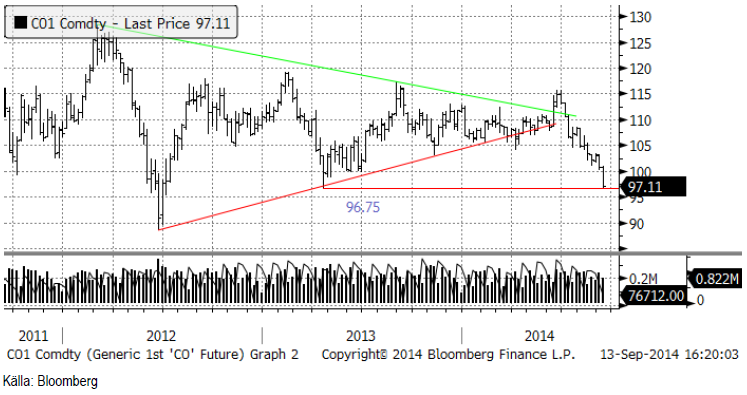
Nedan ser vi oljepriset i ett vecko-chart. Priset är nästan nere på 96.75, som är ett tekniskt stöd från botten under våren förra året. Under det stödet finns nästa stöd vid 90 dollar per fat.
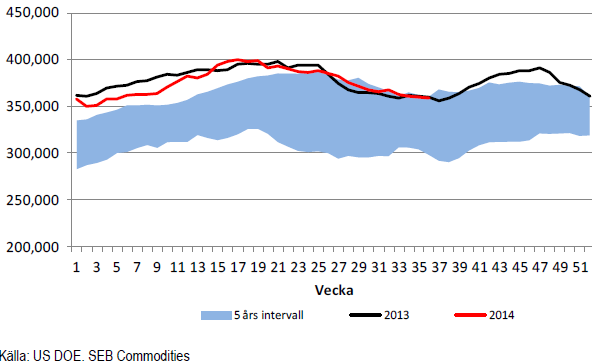
Råoljelagren i USA sjönk 1 mbbl till 358.6 mbbl.
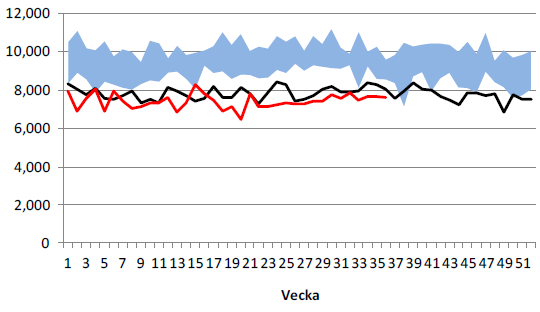
Importen av olja minskade marginellt i veckan till 7.621 miljoner fat.
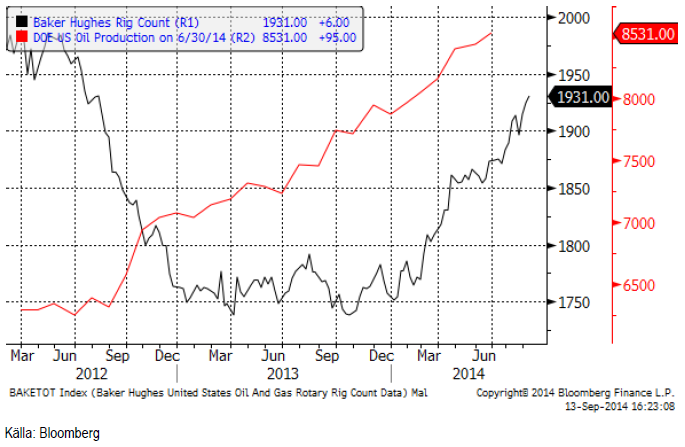
Nedan ser vi ett diagram på antalet oljeriggar i USA, enligt Baker Hughes statistik (svart) och USA:s oljeproduktion enligt US DOE på 8.357 mbpd. Antalet borr-riggar steg i veckan från 1925 till 1931.
Vi rekommenderar alltså på kort sikt en försiktig kortposition t ex med BEAR OLJA X2 S.
Elektricitet
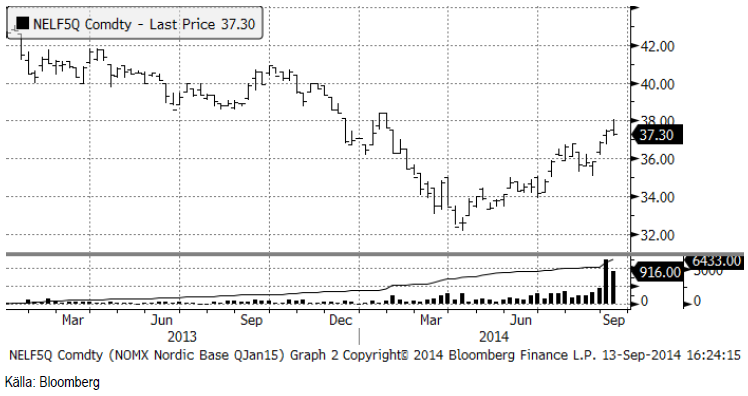
Certifikaten har nu bytt till att följa det första kvartalets kontrakt för år 2015. I veckochartet nedan ser vi att priset på det backade under förra veckan. Uppgången bromsas av att det finns ett tekniskt motstånd precis ovanför vid ca 38.5 euro per MWh.
Marknaden handlar nu lite sidledes, men vi tror det är större sannolikhet för en fortsatt prisuppgång, än att priset ska gå ner.
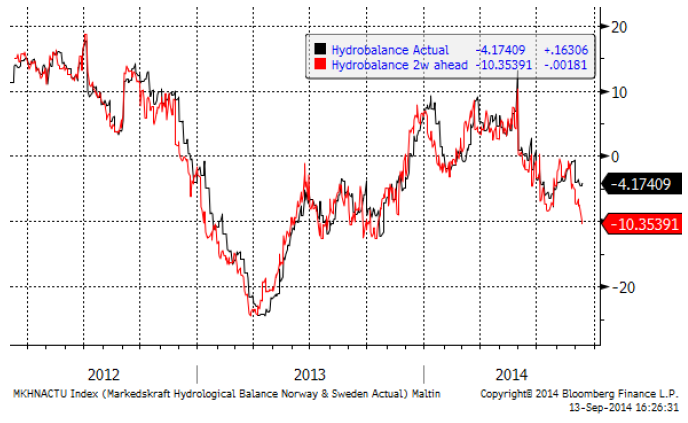
Hydrologisk balans har enligt 2-veckors prognosen försvagats. Från förra veckans underskott på -7.6 TWh har den sjunkit till ett underskott på 10.4 TWh.
Vi rekommenderar köp av EL S om priset kommer ner lite.
Naturgas
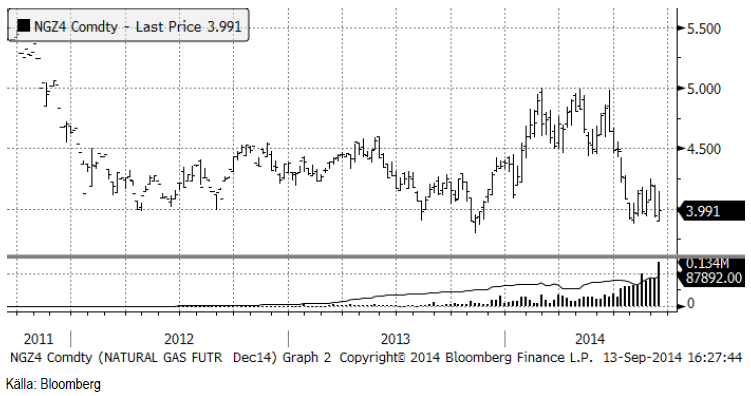
Naturgaspriset (decemberkontraktet) var ganska volatilt i veckan, men stängde bara marginellt över förra veckans stängningspris. Priset står och väger, men vi tror att det mest sannolika trots allt är att priset lämnar de senaste veckornas konsolideringsfas och sjunker ner mot 3.50. Vi håller fast vid vår investering i BEAR NATGAS X4 S.
Koppar
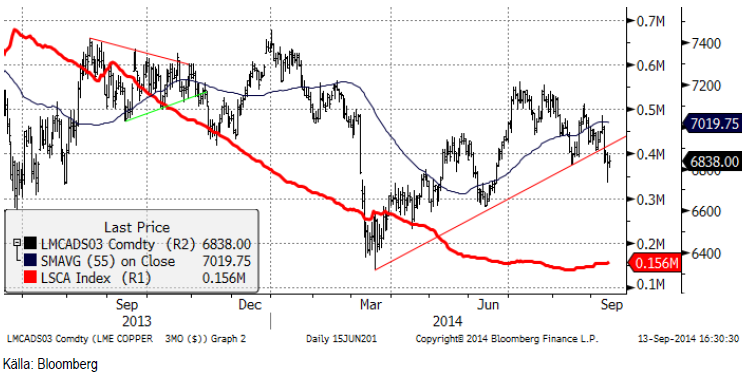
Den stigande pristrenden är bruten. Koppar är den udda medlemmen av LME-familjen. Vi är inte särskilt positiva, snarare något negativa i vår vy av prisutvecklingen framöver. Vi tror att prisutvecklingen det närmaste året blir mer eller mindre ”sideways”.
Ryssland tar bort sin exportskatt på 10% på koppar. Detta är inte någon nyhet, men i dagens sanktionsfixerade omvärld, kan det vara en viktig faktor. Det ger Ryska producenter ett incitament att exportera katoder till EU.
Importen till Kina visar en årsvis förändring på -12%. Det förklaras delvis av Qingdao-skandalen tidigare i år. Det är emellertid inte något som marknaden tycker om att se, eftersom Kina är så central för kopparmarknadens efterfrågan. Dessutom kom Grasberggruvans (Freeport McMoRan). koncentratexport igång igen i juli. Kopparmarknadens fundamentala balans försämras alltså från två håll.
Vi rekommenderar neutral position i koppar.
Aluminium
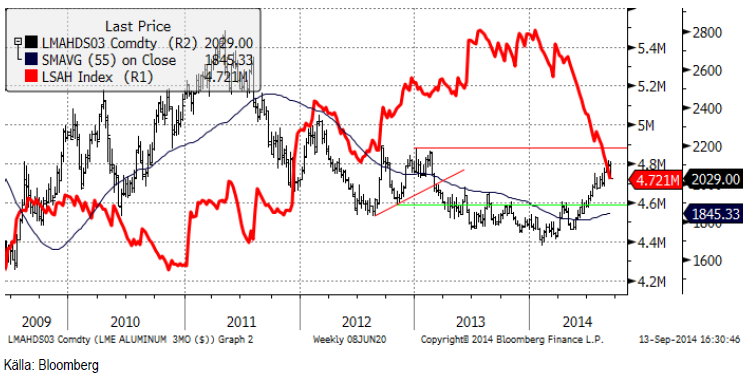
Vi tror att aluminiummarknaden kommer att röra sig ”sidledes” ett tag. Den branta uppåtgående pristrenden är bruten. Vi tycker att det är rimligt att det sker eftersom marknaden har varit något ”överhettad”. Den mest troliga utvecklingen är att priset nu fluktuerar inom intervallet 2000 – 2150 dollar. Det finns en möjlighet att utbudet ökar som svar på de lite högre priserna och det begränsar uppsidan. Å andra sidan är efterfrågan på aluminium relativt stark och borde bli ännu starkare när vi kommer in i det fjärde kvartalet, så nersidan borde vara begränsad i priset. Taktiskt, talar det för en strategi där man försöker köpa på nedgångar (mot 2000 dollar) och sälja på uppgångar (mot 2150).
Vi fortsätter alltså med köprekommendation på ALUMINIUM S.
Zink
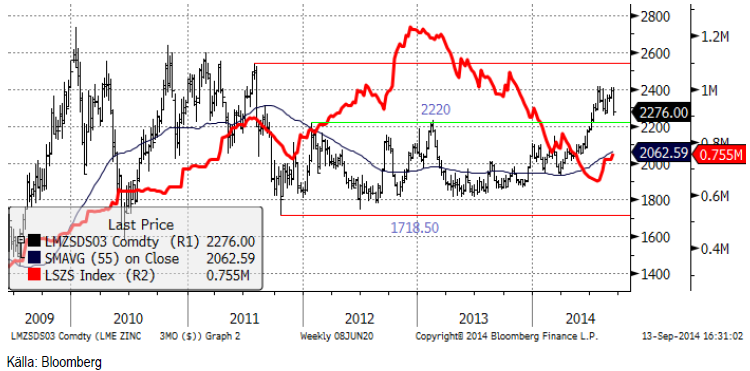
Zinkmarknaden är tillbaka på ruta ett. Zinkmarknaden har varit i en positiv pristrend sedan förra året. Detta är fundamentalt motiverat av successivt förbättrad balans. Den bästa källan och där detta syns tydligast finner man i the International Lead and Zinc Study Groups (ILZSG) rapporter. Vår rekommendation att öka på köpta positioner i zink vid rekylen nedåt i augusti till 2250 dollar visade sig rätt. Därifrån gick marknaden hela vägen upp till 2400 dollar på kort tid. Men på bara en vecka föll priset hela vägen tillbaka ner igen! Rapporter från marknaden antyder att många producenter tog tillfället i akt att prissäkra på de attraktiva höga nivåerna.
Tekniskt vände priset ner från tidigare motståndsnivåer. Det var inte konstigt att prisuppgången skulle stöta på patrull där. Rekylen nedåt inträffade samtidigt som andra marknader utvecklades svagt. Basmetaller, ädelmetaller, olja och hela jordbruksproduktsegmentet utvecklades svagt i veckan och det är inte bara en stark dollar som ligger bakom. Även om rekylen i zink kan vara oroväckande, anser vi att zinkmarknadens fundamentala situation med gradvis förbättring, gör zink till en av de mer köpvärda råvarorna och vi tycker att metallen är köpvärd på de här nuvarande nivåerna.
Vi rekommenderar köp av ZINK S.
Nickel
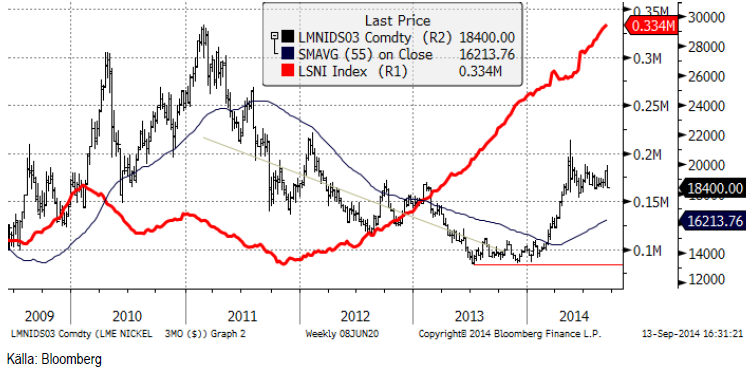
Vi skrev för en vecka sedan att vi tyckte att haussen upp mot 20,000 dollar var lite för tidig. Veckans högsta pris på 19,940 dollar per ton noterades direkt på morgonen i måndags. Marknaden orkade inte ta sig över motståndet från förra toppen, utan vände därefter direkt nedåt. Veckans lägsta pris noterades under asiatisk handel på fredag morgon, på 18320 dollar. Så marknaden är tillbaka på ruta ett. Priset är nere på samma nivå som förra rekylen nedåt bottnade ut på.
Reuters rapporterar att en Filippinsk politiker propagerar för att ett eventuellt exportförbud av malm från landet ska skjutas upp i fem år, för att ge industrin en möjlighet att bygga upp smältverkskapacitet inom landet. Så inget har egentligen förändrats. Det viktiga för nickelmarknaden är hur situationen i Indonesien förändras. Det mesta tyder på en gradvis förbättring i de fundamentala balanserna (mindre utbud, större efterfrågan). Som vi har påpekat förut, det är avgörande att detta också börjar visa sig i den viktigaste indikatorn av alla, i LME-lagret. För närvarande går det att med lite god vilja skönja en utplaning i lagerutvecklingen, men knappast någon klar trendförändring än.
Guld
Priset på guld, som bröt den tekniska triangelformationen för ett par veckor sedan, har fortsatt att rasa i pris. Vi rekommenderar såld position av guld i dollartermer.
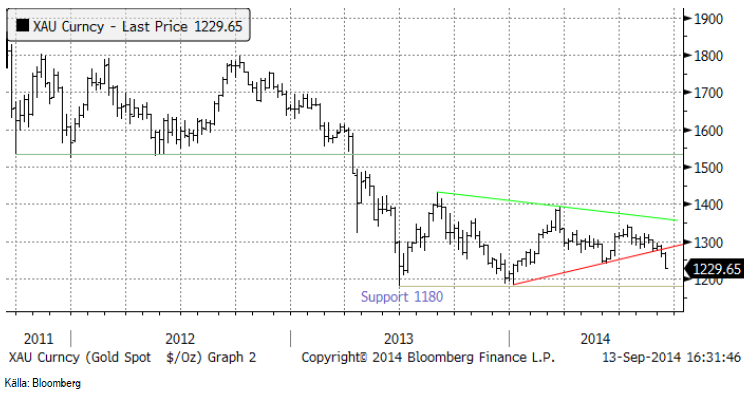
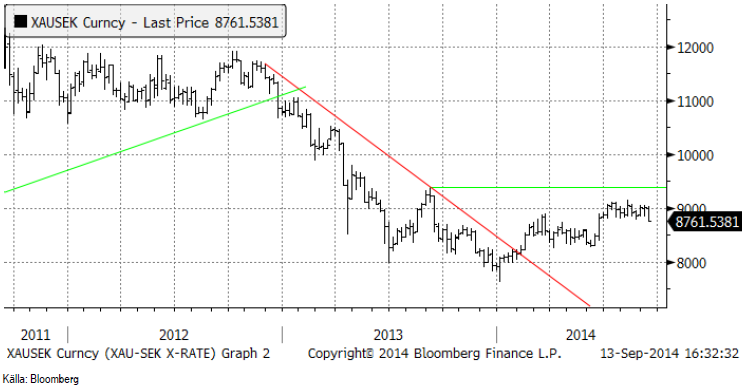
Chartet för guld i kronor (och i euro med för den delen) ser närmast ut som en omvänd head-and-shouldersformation, som alltså indikerar att stigande pris kan vara förestående. Vad detta kanske egentligen säger är att USD/SEK och USD/EUR kan vara köpvärd.
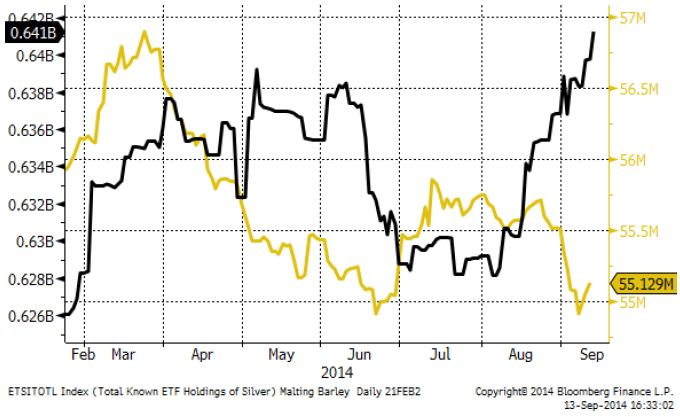
Det har fortsatt att vara inflöden i silver som investering. Även guld fick en släng av sleven i veckan som gick.
Vi rekommenderar sälj av guld i dollartermer. Eftersom GULD S är en investering i guld i kron-termer väljer vi att stanna vid neutral vy. Den som vill kanske kan köpa en BEAR GULD X4 S, som till största delen har en kort position i guld i dollartermer. Den är dock också köpt med hävstång 1 USD/SEK.
Silver
Silverpriset, i dollartermer, har brutit det tekniska stödet på 18.70 dollar per uns. Silverpriset stängde på 18.64 dollar i fredags. Vi har tidigare skrivit att stop-loss-nivån ligger vid ca 18.50. Det ser just nu inte särskilt ljust ut.
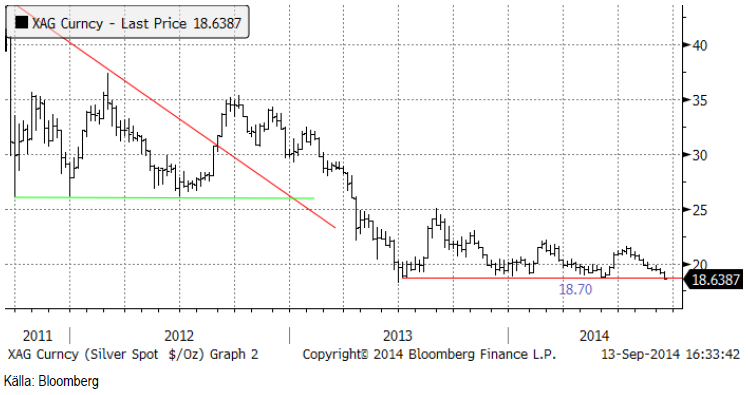
Silver är dock fortfarande ”billigt” i jämförelse med guld.
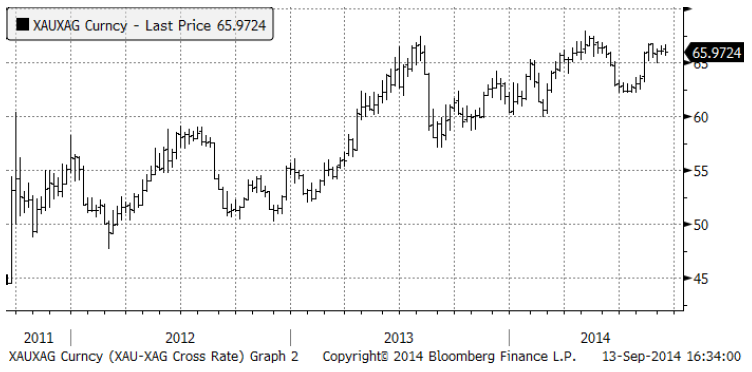
Vi rekommenderar fortfarande köp av silver, men stop-loss bör tas vid 18.50.
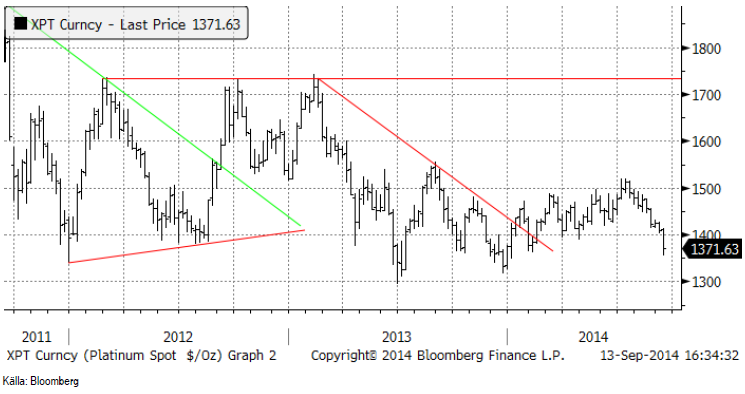
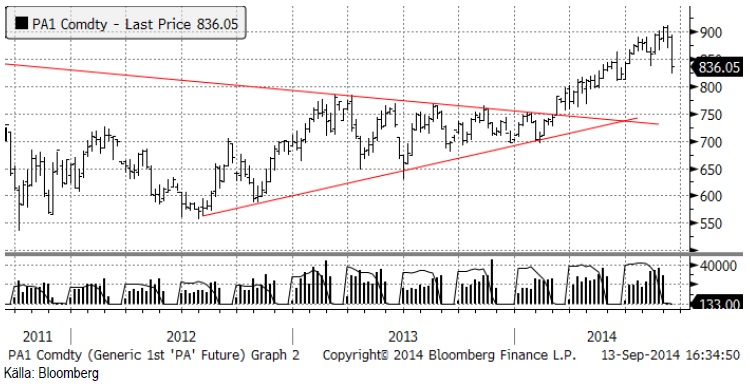
Platina & Palladium
Platinapriset passerade 1400 dollar och föll kraftigt i veckan som gick. Nästa stödnivå är 1300.
Palladium som förra veckan föll under 900 dollar, föll betydligt mycket mer i veckan som gick, ända ner till 836 dollar. Tekniskt stöd finns strax under den kursen.
Nedanför ser vi hur mycket metall som finns i börshandlade fonder för platina respektive palladium. Det har varit små utflöden i båda metallerna.
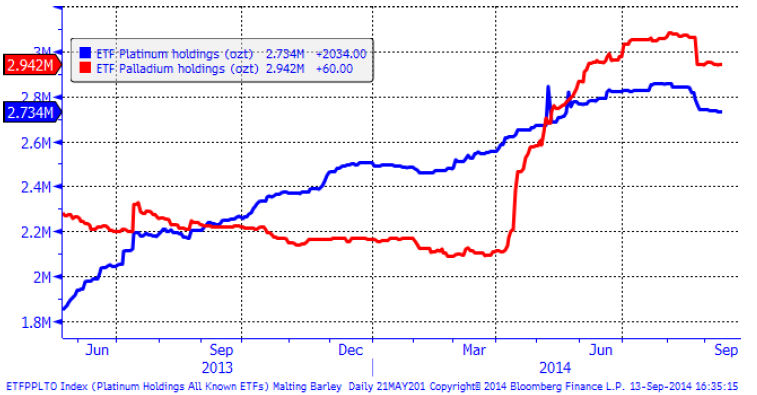
Vi fortsätter med neutrala vy på platina men rekommenderar en köpt position i palladium, helst om man kan köpa på en rekyl nära 800 dollar.
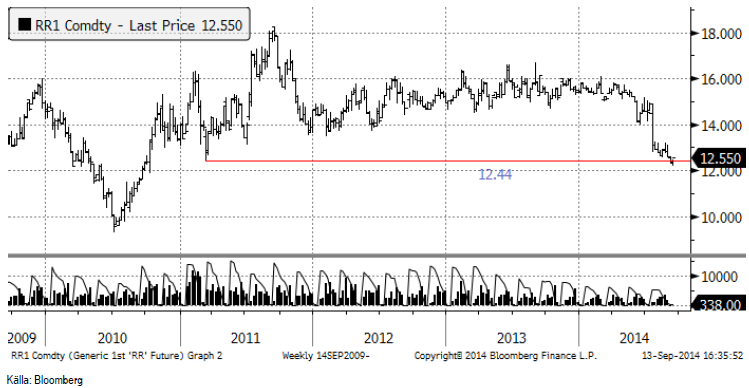
Ris
Priset på ris ligger kvar strax över det tekniska stödet på 12.44 dollar.
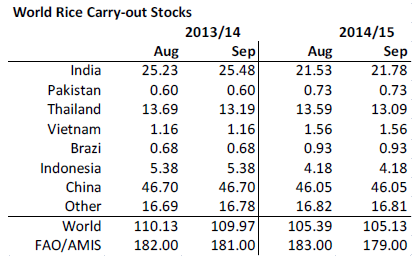
WASDE sänkte global produktion och det gjorde även FAO / AMIS.
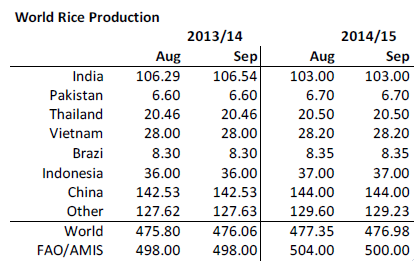
Utgående lager sänktes lika mycket. Både USDA och FAO sänker utgående lager lika mycket som produktionen minskar.
Vi fortsätter med neutral rekommendation.
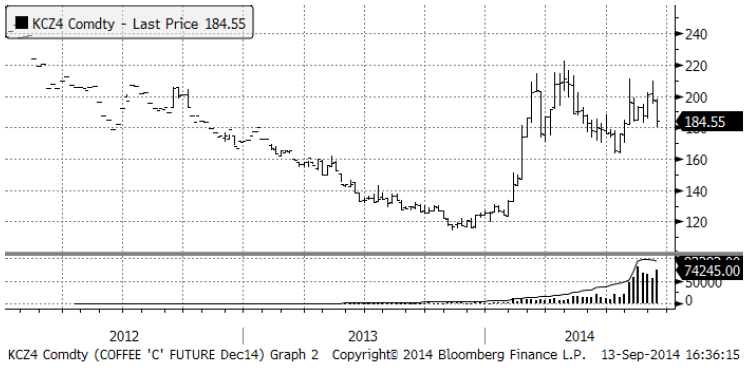
Kaffe
Regn över Minas Gerais gav prisfall på kaffet. 180 cent är ett visst tekniskt stöd. Vi ser väl inte någon trigger åt något håll. Sidledes rörelse tror vi kommer att fortsätta.
Vi rekommenderar neutral position i kaffe.
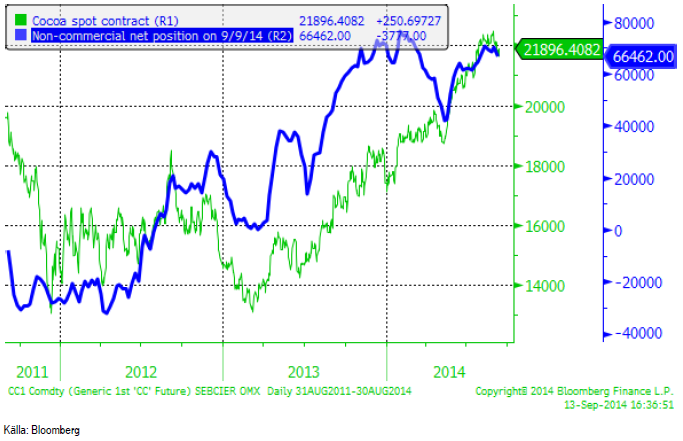
Kakao
Kakao har brutit uppgången och det är nu läge att ligga kort, t ex via ”SHORT KAKAO A S”.
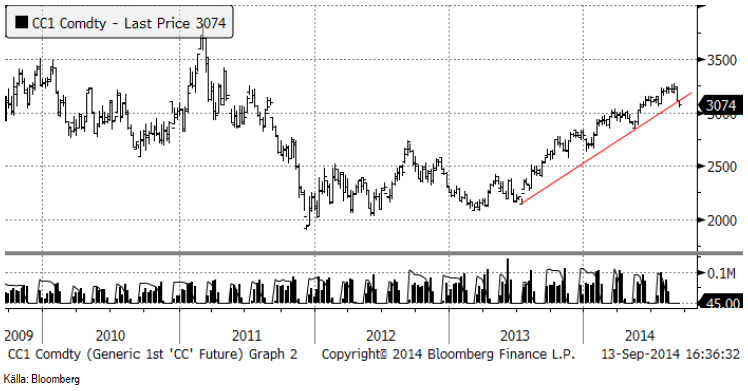
Spekulativ position ligger väldigt högt, historiskt sett. Det kan bli ”trångt i dörren” om trenden vänder nedåt.
För analyser av fler jordbruksråvaror se SEBs jordbruksanalysbrev.
[box]SEB Veckobrev Veckans råvarukommentar är producerat av SEB Merchant Banking och publiceras i samarbete och med tillstånd på Råvarumarknaden.se[/box]
Disclaimer
The information in this document has been compiled by SEB Merchant Banking, a division within Skandinaviska Enskilda Banken AB (publ) (“SEB”).
Opinions contained in this report represent the bank’s present opinion only and are subject to change without notice. All information contained in this report has been compiled in good faith from sources believed to be reliable. However, no representation or warranty, expressed or implied, is made with respect to the completeness or accuracy of its contents and the information is not to be relied upon as authoritative. Anyone considering taking actions based upon the content of this document is urged to base his or her investment decisions upon such investigations as he or she deems necessary. This document is being provided as information only, and no specific actions are being solicited as a result of it; to the extent permitted by law, no liability whatsoever is accepted for any direct or consequential loss arising from use of this document or its contents.
About SEB
SEB is a public company incorporated in Stockholm, Sweden, with limited liability. It is a participant at major Nordic and other European Regulated Markets and Multilateral Trading Facilities (as well as some non-European equivalent markets) for trading in financial instruments, such as markets operated by NASDAQ OMX, NYSE Euronext, London Stock Exchange, Deutsche Börse, Swiss Exchanges, Turquoise and Chi-X. SEB is authorized and regulated by Finansinspektionen in Sweden; it is authorized and subject to limited regulation by the Financial Services Authority for the conduct of designated investment business in the UK, and is subject to the provisions of relevant regulators in all other jurisdictions where SEB conducts operations. SEB Merchant Banking. All rights reserved.

Market is starting to take US/Iran headlines with a pinch of salt. Brent crude rose $2.8/b yesterday to an official close of $112.1/b. But after that it traded as low as $108.05/b before ending late night at around $109.7/b. Through the day it traded in a range of $106.87 – 112.72/b amid a flurry of news or rumors from Iran and the US. ”US temporary sanctions during negotiations” (falls alarm). ”We will bomb Iran” (not anyhow),… etc. While the market is still fluctuating to this kind of news flow, it is starting to take such headlines with a pinch of salt.

We’ll see. Maybe, maybe not. The Brent M1 contract is trading at $110.2/b this morning which very close to the average ticks through yesterday of $110.4/b.
Trump with bearish, verbal intervention whenever Brent trades above $110/b it seems. What seems to be a pattern is that Trump states something like ”very good negotiations going on with Iran”, ”New leaders in Iran are great,..”, ”Great progress in negotiations,…”, ”Deal in sight,..” etc whenever the Brent M1 contract trades above $110/b. An effort to cool the market. These hot air verbal interventions from Trump used to have a heavy bearish impact on prices, but they now seems to have less and less effect unless they are backed by reality.
As far as we can see there has been no real progress in the negotiations between the US and Iran with both sides still standing by their previous demands.
Iran is getting stronger while the cease fire lasts making a return to war for Trump yet harder. Iran is naturally in constant preparation for a return to war given Trump’s steady threats of bombing Iran again. Iran is naturally doing what ever is possible to prepare for a return to war. And every day the cease fire lasts it is better prepared. This naturally makes it more and more difficult and dangerous for the US to return to warring activity versus Iran as the consequences for energy infrastructure in the Persian Gulf will be more and more severe the longer the cease fire lasts. Israel seems to see it this way as well. That the war is not won and that current frozen state of a cease fire gives Iran opportunity to rebuild military and politically.
Global inventories are drawing down day by day. How much? In the meantime the Strait of Hormuz stays closed. There is varying measures and estimates of how much global inventories are drawing down. Our rough estimate, back of the envelope, is that global inventories are drawing down by at least some 10 mb/d or about 300 mb/d in a balance between loss of supply versus demand destruction. Other estimates we see are a monthly draw of 250-270 mb/d. The IEA only ’measured’ a draw in global observable stocks of 117 mb in April with oil on water rising 53 mb while on shore stocks fell 170 mb. But global stocks are hard to measure with large invisible, unmeasured stocks. As such a back of the envelope approach may be better.
Oil products is what the world is consuming. Oil product prices likely to rise while product stocks fall. Strategic Petroleum Reserves (SPR) are predominantly crude oil. Discharging oil from OECD SPR stocks, a sharp reduction in Chinese crude imports and a reduction in global refinery throughput of 6-7 mb/d has helped to keep crude oil markets satisfactorily supplied. But global inventories are drawing down none the less. And oil products is really what the world is consuming. So if global refinery throughput stays subdued, then demand will eventually have to match the supply of oil products. The likely path forward this summer is a steady draw down in jet fuel, diesel and gasoline. Higher prices for these. Then, if possible, higher refinery throughput and higher usage of crude in response to very profitable refinery margins. And lastly sharper draw in crude stocks and higher prices for these. But some 6 mb/d of oil products used to be exported through the Strait of Hormuz. And it may not be so easy to ramp up refinery activity across the world to compensate. Especially as Ukraine continues to damage Russian refineries as well as Russian crude production and export facilities.
Watch oil product stocks and prices as well as Brent calendar 2027. What to watch for this summer is thus oil product inventories falling and oil product premiums to crude rising. Another measure to watch is the Brent crude 2027 contract as it rises steadily day by day as the Strait of Hormuz stays closed and global oil inventories decline. The latter is close to the highest level since the start of the war and keeps rising.
The Brent M1 contract and the Brent 2027 prices and current price of jet fuel in Europe (ARA). All in USD/b

Our back of the envelope calculation of the global shortage created by the closure of the Strait of Hormuz. Note that 3.5 mb/d of discharge from SPR is also a draw. Note also that ’Forced demand loss’ of 2.5 mb/d is probably temporary and will fall back towards zero as logistics are sorted out leaving ’Price demand loss’ to do the job of balancing the market. Thus a shortfall of at least 9 mb/d created by the closure. More if SPR discharge is included and more if Forced demand loss recedes.

Brent is climbing higher. Front-month is at USD 106.3/bl this morning, close to a weekly high and a USD 9/bl jump from Mondays open. This is the move we flagged as a risk earlier in the week: the market shifting from ”a deal is around the corner” to ”this is going to take longer than we thought”.

Analyst Commodities, SEB
During April, rest-of-year Brent remained remarkably stable around USD 90/bl. A stability which rested on one single assumption: the SoH reopens around 1 May. That assumption is now slowly falling apart.
As we highlighted yesterday: every week of delay beyond 1 May adds (theoretically) ish USD 5/bl to the rest-of-year average, as global inventories draw 100 million barrels per week. i.e., a mid-May reopening implies rest-of-year Brent closer to USD 100/bl, and anything pushing into June or July takes us meaningfully higher.
What’s changed in the last 48 hours:
#1: The US military has formally warned that clearing suspected sea mines from SoH could take up to six months. That is a completely different timescale from what the financial market is pricing. Even a political deal tomorrow does not immediately reopen the strait.
#2: Trump has shifted his tone from urgency to ”strategic patience”. In yesterday’s press conference: ”Don’t rush me… I want a great deal.” The market is reading this as a president no longer feeling pressured by timelines, with the naval blockade running in the background.
#3: So far, the military activity is escalating, not de-escalating. Axios reports Iran is laying more mines in SoH. The US 3rd carrier strike group (USS George H.W. Bush) is arriving with two countermine vessels. Trump yesterday ordered the US Navy to destroy any Iranian boats caught laying mines. While CNN reports that the Pentagon is actively drawing up plans to strike Iranian SoH capabilities and individual Iranian military leaders if the ceasefire collapses. i.e., NOT a attitude consistent with an imminent deal!
Spot crude and product prices eased off the early-April highs on a combination of system rerouting and deal optimism. Both now weakening. Goldman estimates April Gulf output is reduced by 14.5 mbl/d, or 57% of pre-war supply, a number that keeps getting worse the longer this drags on.
Demand-side adaptation is ongoing: S. Korea has cut its Middle East crude dependence from 69% to 56% by pulling more from the Americas and Africa, and Japan is kicking off a second round of SPR releases from 1 May. But SPRs are finite.
Ref. to the negotiations, we should not bet on speed. The current Iranian leadership is dominated by genuine hardliners willing to absorb economic pain and run the clock to extract concessions. That is not a setup for a rapid resolution. US/Israeli media briefings keep framing the delay as ”internal Iranian divisions”, the reality is more complicated and points toward weeks and months, not days.
Our point is that the complexity is large, and higher prices have only just started (given a scenario where the negotiations drag out in time). The market spent April leaning on the USD 90/bl rest-of-year assumption; that case is diminishing by the hour. If ”early May reopening” is replaced by ”June, July or later” over the next week or two, both crude and products have meaningful room to reprice higher from here. There is a high risk being short energy and betting on any immediate political resolution(!).
Down on Friday. Up on Monday. The Brent June crude oil contract traded down 5.1% last week to a close of $90.38/b. It reached a high of $103.87/b last Monday and a low of $86.09/b on Friday as Iran announced that the Strait of Hormuz was fully open for transit. That quickly changed over the weekend as the US upheld its blockade of Iranian oil exports while Iran naturally responded by closing the SoH again. The US blew a hole in the engine room of the Iranian ship TOUSKA and took custody of the ship on Sunday. Brent crude is up 5.6% this morning to $95.4/b.
The cease-fire is expiring tomorrow. The US has said it will send a delegation for a second round of negotiations in Islamabad in Pakistan. But Iran has for now rejected a second round of talks as it views US demands as unrealistic and excessive while the US is also blocking the Strait of Hormuz.
While Brent is up 5% this morning, the financial market is still very optimistic that progress will be made. That talks will continue and that the SoH will fully open by the start of May which is consistent with a rest-of-year average Brent crude oil price of around $90/b with the market now trading that balance at around $88/b.
Financial optimism vs. physical deterioration. We have a divergence where the financial market is trading negotiations, improvements and resolution while at the same time the physical market is deteriorating day by day. Physical oil flows remain constrained by disrupted flows, longer voyage times and elevated freight and insurance costs.
Financial markets are betting that a US/Iranian resolution will save us in time from violent shortages down the road. But every day that the SoH remains closed is bringing us closer to a potentially very painful point of shortages and much higher prices.
The US blockade is also a weapon of leverage against its European and Asian allies. When Iran closed the SoH it held the world economy as a hostage against the US. The US blockade of the SoH is of course blocking Iranian oil exports. But it is also an action of disruption directed towards Europe and Asia. The US has called for the rest of the world to engaged in the war with Iran: ”If you want oil from the Persian Gulf, then go and get it”. A risk is that the US plays brinkmanship with the global oil market directed towards its European and Asian allies and maybe even towards China to force them to engage and take part. Maybe unthinkable. But unthinkable has become the norm with Trump in the White House.


Sommarväder skapar prisrally på elbörsen
Oil product price pain is set to rise as the Strait of Hormuz stays closed into summer

Solkraften pressar elpriserna dagtid

Michel Gubel ger sin syn på oljemarknaden