

Analys
Risk for OPEC dissapointment and a short term sell-off as all bets are on the long side

 Marked has placed all chips on the long side betting on an extension of OPEC/non-OPEC production cuts which officially ends in Q1-18. In general we do think that OPEC/non-OPEC will manage the market and hold back production if needed through 2018 in order to secure further gradual draw down of OECD inventories. However we also think that it would be better for OPEC/non-OPEC to make hard decissions on this in Feb/Mar getting as much data as possible before making that decission. That is also what the group has mostly consistengly communicated through the autumn. The market seems to expect and demand a firm decission right now this week. As such the market is rigged for dissapointment with a possible short term sell-off as all chips are on the long side.
On Thursday 30th OPEC and some non-OPEC producers will meet in Vienna to discuss whether to extend current production cuts or not.
The communication all through the autumn has been that they want to make this decission in February/March 2018 in order to have as much data on the table as possible before making the decission.
That makes a lot of sense since there is substantial dissagreement with respect to how much oil is needed from OPEC in 2018.
Somehow the market has geared it self up to an expectation that OPEC/non-OPEC needs to make a firm decission on this right now on Thursday. And further that the decission will be an extension of current cuts maintained all to the end of 2018.
As such it seems to us that there is a substantial risk that the market is setting it self up for a dissapointment this week. For us it makes much more sense for the group to make this call in Feb/Mar which is also what they mostly have been communicating all through the autumn.
The challenge for the group this is week may thus be all about managing the market’s expectations. How not to let the market down when it communicates that the decission will be taken in Feb/March.
And if there is a decission this week it is likely going to be a sign of intention: “If needed we’ll maintain cuts to the end of 2018”, or “We’ll maintain cuts to June 2018 and then make a new assessment”, or “We are all in agreement that we’ll extend cuts as long as needed in order to drive OECD inventories down to the 5 year average”.
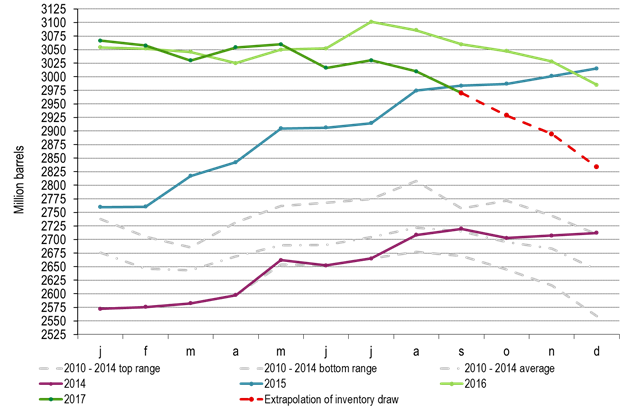
That is indeed a trickey reference. This is because for every month we move forward the 5 year average reference is rising. Since March 2017 the OECD inventories have declined some 0.7 mb/d when adjusting for seasonal trends (given by the 2010-2014 seasonal average profile). If we extend this decline rate on top of the seasonal trend (2010-2014) we actually almost get all the way down the 2013-2017 average profile.
As such one can say that in February when we get the OECD inventory data for December 2017 the goal of getting inventories down to the 5 year average (2013-2017) will have been achieved. The goal of getting OECD inventories down to the 5 year average is thus a trickey goal and a moving target.
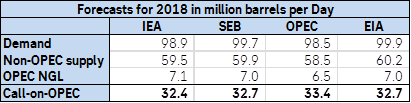
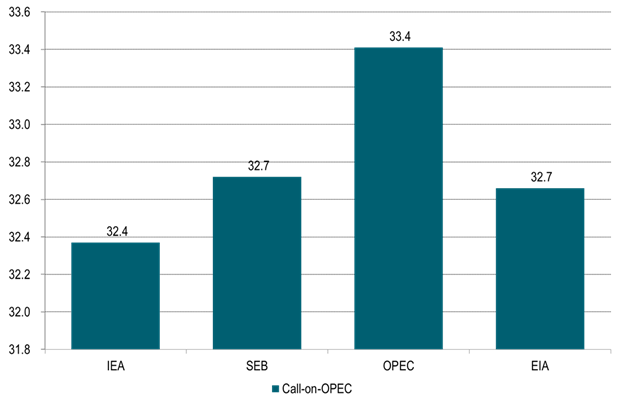
The big question though is what is really needed in order to secure a balanced oil market in 2018? There is a significant dissagreement on this. The IEA says that call-on-OPEC will be 32.4 mb/d in 2018. SEB’s estimate is 32.7 mb/d, the US EIA’s is 32.7 mb/d while OPEC’s own estimate is 33.4 mb/d. Variations on this comes down to projections for demand, US shale oil production and the level of OPEC’s NGL production in 2018.
The OECD draw down since March this year of 0.7 mb/d (adjusted for seasonallity) indicates an implied oil market deficit of 0.7 mb/d thrugh Q2 and Q3 this year during which OPEC produced 32.55 mb/d. However, if we assume that the OECD inventories only cover half or a third of global inventories then what we see of deficit implied by the draw down in the OECD inventories could actually be two or three times as much if there have been comparable draw downs in non-OECD inventories.
Thus beeing carefule about committing to further cuts now on Thursday seems kind of sensible with the aim of instead making that decission in Feb/Mar.
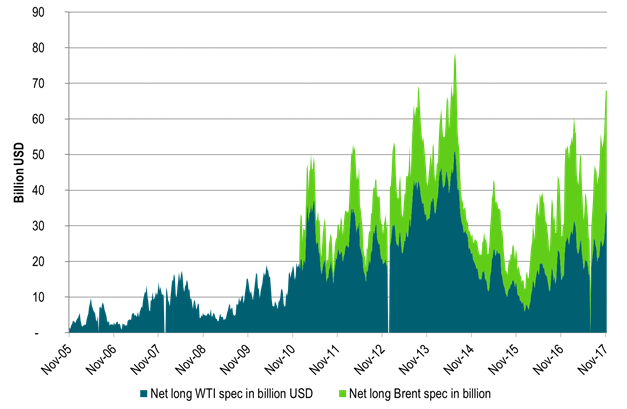
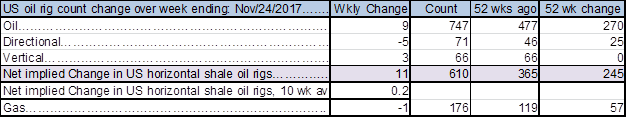
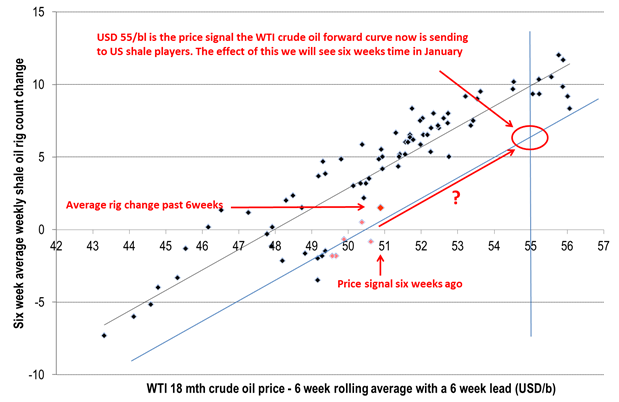
Market participants are seemingly all expecting OPEC/non-OPEC to make a firm and clear decission this Thursday for extending current cuts to Dec-2018. Net long speculative positions for Brent and WTI together are now very close to all time high. US oil rig count has started to rise again (+9 rigs last week). The decission to add these 9 rigs was probably taken some 6-8 weeks ago when the WTI forward price only stood at $51-52/b. Now that reference WTI price stands at $55/bl with a clear risk for a rise in rig count in the weeks to come. The outage of the 590 kbl/d Keystone pipeline due to an oil spill has reduced supply into Cushing Oklahoma by some 4 mbl/week. It has helped to reduce Chushing inventories and to drive also the WTI crude curve into backwardation. However, the Keystone pipline is likely to back in operation within a week or so.
Thus overall there is a fair chance that the market will be dissapointed on Thursday. That there will be no firm decission even though there will be firm support for further cuts if needed. And if OPEC/non-OPEC actually do make a firm decission to maintain cuts all to the end of 2018 then there may not be much upside price action since that decission is already so highly priced in already.
Thus buying a put option on the front month WTI contract with short time to expiry may be a good strattegy in the run-up to this week’s digital OPEC/non-OPEC decission risk on Thursday.
Our general stand on OPEC/non-OPEC cuts for 2018 is that further cuts are likely needed but also that if needed we expect OPEC/non-OPEC to manage the market in order to prevent inventories from rising back up.
Needed cuts will likely be of a magnitude which are perfectly manageable for the group. Why through away all they have acchieved in 2017 with inventory draw downs when they can hold back a little supply.
Ch1: OECD inventories with extrapolation to end of 2017 of the 0.7 mb/d draw down in Q2 and Q3 2017
Getting closer to the 2010-2014 average in December 2017
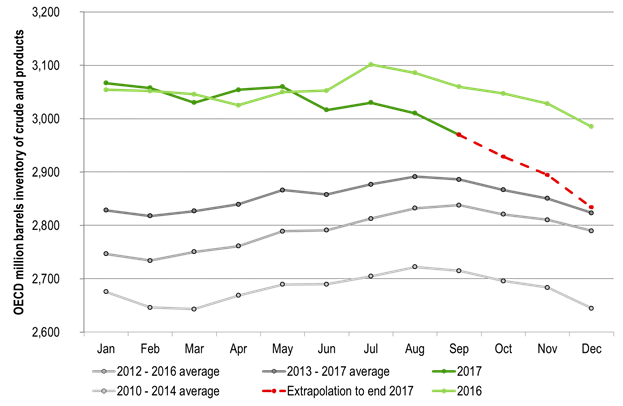
Ch2: OECD inventories. Which 5 year normal should you use? The 2013-2017?
If the latter then mission acomplished in December 2017, but we won’t know before February
Ch3: Call-on-OPEC 2018? – Big dissagreement!
Who knows OPEC NGL the best? Account for 0.6 mb/d difference to the IEA!
Ch4: Close to record USD allocation in net long speculative Brent crude oil positions
Makes it vulnerable to downside corrections and OPEC/non-OPEC dissapointments
Net long Brent crude oil speculative positions are now at the 3rd highest over the past 52 weeks
Ch5: US oil rig count has started to rise again
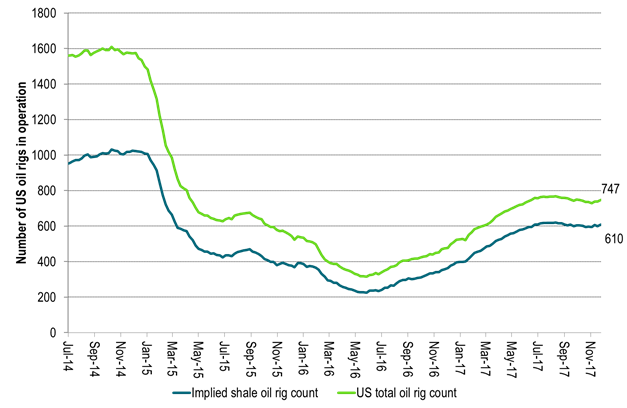
Ch6 The increas in rig count we see now came from price signals some 6-8 weeks ago
Since then the WTI curve price has moved from $51/bl to $55/bl.
The effect of the price rise over the past 6-8 weeks will be visible in terms of rig count over the coming 6-8 weeks
Ch7: Risk of rising rig count in the weeks to come
Could weight bearishly on the WTI crude oil price
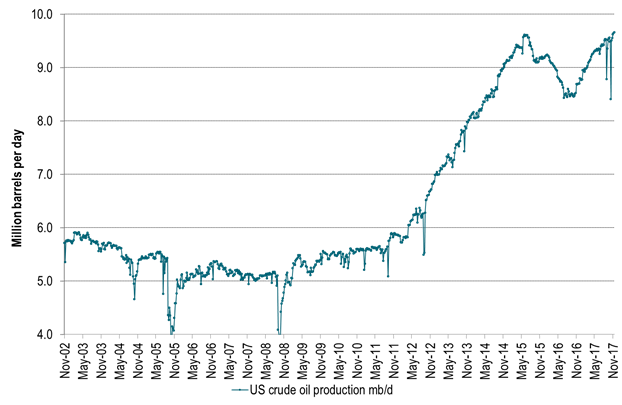
Ch8: While US crude oil production continues to rise
Will it rise 0.7 mb/d or 1.5 mb/d next year?
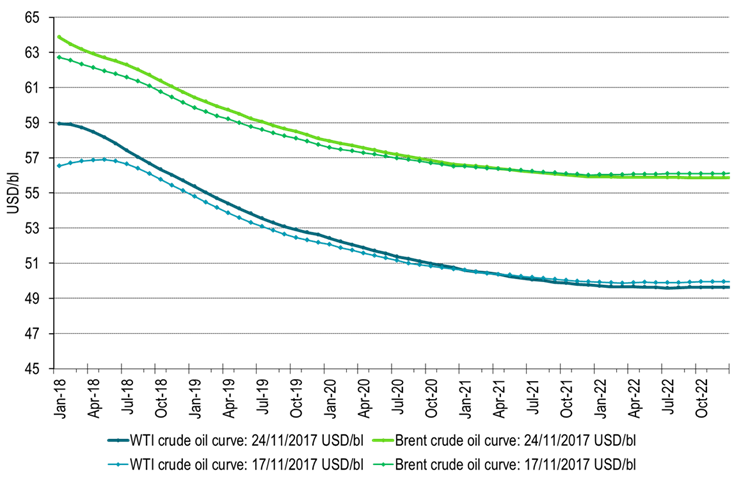
Ch9: WTI crude oil curve shifted into backwardation following the outage of the Keystone pipeline which feeds 590 kbl/d of Canadian oil into Chushing Oklahoma
The Keystone pipeline is likely going to be back on line within a week or so which could push the WTI curve back into contango again
Kind regards
Bjarne Schieldrop
Chief analyst, Commodities
SEB Markets
Merchant Banking

The latest weekly report from the US DOE showed a substantial drawdown across key petroleum categories, adding more upside potential to the fundamental picture.

Commercial crude inventories (excl. SPR) fell by 5.8 million barrels, bringing total inventories down to 415.1 million barrels. Now sitting 11% below the five-year seasonal norm and placed in the lowest 2015-2022 range (see picture below).
Product inventories also tightened further last week. Gasoline inventories declined by 2.1 million barrels, with reductions seen in both finished gasoline and blending components. Current gasoline levels are about 3% below the five-year average for this time of year.
Among products, the most notable move came in diesel, where inventories dropped by almost 4.1 million barrels, deepening the deficit to around 20% below seasonal norms – continuing to underscore the persistent supply tightness in diesel markets.
The only area of inventory growth was in propane/propylene, which posted a significant 5.1-million-barrel build and now stands 9% above the five-year average.
Total commercial petroleum inventories (crude plus refined products) declined by 4.2 million barrels on the week, reinforcing the overall tightening of US crude and products.


A classic case of “buy the rumor, sell the news” played out in oil markets, as Brent crude has dropped sharply – down nearly USD 10 per barrel since yesterday evening – following Iran’s retaliatory strike on a U.S. air base in Qatar. The immediate reaction was: “That was it?” The strike followed a carefully calibrated, non-escalatory playbook, avoiding direct threats to energy infrastructure or disruption of shipping through the Strait of Hormuz – thus calming worst-case fears.
After Monday morning’s sharp spike to USD 81.4 per barrel, triggered by the U.S. bombing of Iranian nuclear facilities, oil prices drifted sideways in anticipation of a potential Iranian response. That response came with advance warning and caused limited physical damage. Early this morning, both the U.S. President and Iranian state media announced a ceasefire, effectively placing a lid on the immediate conflict risk – at least for now.
As a result, Brent crude has now fallen by a total of USD 12 from Monday’s peak, currently trading around USD 69 per barrel.
Looking beyond geopolitics, the market will now shift its focus to the upcoming OPEC+ meeting in early July. Saudi Arabia’s decision to increase output earlier this year – despite falling prices – has drawn renewed attention considering recent developments. Some suggest this was a response to U.S. pressure to offset potential Iranian supply losses.
However, consensus is that the move was driven more by internal OPEC+ dynamics. After years of curbing production to support prices, Riyadh had grown frustrated with quota-busting by several members (notably Kazakhstan). With Saudi Arabia cutting up to 2 million barrels per day – roughly 2% of global supply – returns were diminishing, and the risk of losing market share was rising. The production increase is widely seen as an effort to reassert leadership and restore discipline within the group.
That said, the FT recently stated that, the Saudis remain wary of past missteps. In 2018, Riyadh ramped up output at Trump’s request ahead of Iran sanctions, only to see prices collapse when the U.S. granted broad waivers – triggering oversupply. Officials have reportedly made it clear they don’t intend to repeat that mistake.
The recent visit by President Trump to Saudi Arabia, which included agreements on AI, defense, and nuclear cooperation, suggests a broader strategic alignment. This has fueled speculation about a quiet “pump-for-politics” deal behind recent production moves.
Looking ahead, oil prices have now retraced the entire rally sparked by the June 13 Israel–Iran escalation. This retreat provides more political and policy space for both the U.S. and Saudi Arabia. Specifically, it makes it easier for Riyadh to scale back its three recent production hikes of 411,000 barrels each, potentially returning to more moderate increases of 137,000 barrels for August and September.
In short: with no major loss of Iranian supply to the market, OPEC+ – led by Saudi Arabia – no longer needs to compensate for a disruption that hasn’t materialized, especially not to please the U.S. at the cost of its own market strategy. As the Saudis themselves have signaled, they are unlikely to repeat previous mistakes.
Conclusion: With Brent now in the high USD 60s, buying oil looks fundamentally justified. The geopolitical premium has deflated, but tensions between Israel and Iran remain unresolved – and the risk of missteps and renewed escalation still lingers. In fact, even this morning, reports have emerged of renewed missile fire despite the declared “truce.” The path forward may be calmer – but it is far from stable.
Analys
A muted price reaction. Market looks relaxed, but it is still on edge waiting for what Iran will do
Brent crossed the 80-line this morning but quickly fell back assigning limited probability for Iran choosing to close the Strait of Hormuz. Brent traded in a range of USD 70.56 – 79.04/b last week as the market fluctuated between ”Iran wants a deal” and ”US is about to attack Iran”. At the end of the week though, Donald Trump managed to convince markets (and probably also Iran) that he would make a decision within two weeks. I.e. no imminent attack. Previously when when he has talked about ”making a decision within two weeks” he has often ended up doing nothing in the end. The oil market relaxed as a result and the week ended at USD 77.01/b which is just USD 6/b above the year to date average of USD 71/b.

Brent jumped to USD 81.4/b this morning, the highest since mid-January, but then quickly fell back to a current price of USD 78.2/b which is only up 1.5% versus the close on Friday. As such the market is pricing a fairly low probability that Iran will actually close the Strait of Hormuz. Probably because it will hurt Iranian oil exports as well as the global oil market.
It was however all smoke and mirrors. Deception. The US attacked Iran on Saturday. The attack involved 125 warplanes, submarines and surface warships and 14 bunker buster bombs were dropped on Iranian nuclear sites including Fordow, Natanz and Isfahan. In response the Iranian Parliament voted in support of closing the Strait of Hormuz where some 17 mb of crude and products is transported to the global market every day plus significant volumes of LNG. This is however merely an advise to the Supreme leader Ayatollah Ali Khamenei and the Supreme National Security Council which sits with the final and actual decision.
No supply of oil is lost yet. It is about the risk of Iran closing the Strait of Hormuz or not. So far not a single drop of oil supply has been lost to the global market. The price at the moment is all about the assessed risk of loss of supply. Will Iran choose to choke of the Strait of Hormuz or not? That is the big question. It would be painful for US consumers, for Donald Trump’s voter base, for the global economy but also for Iran and its population which relies on oil exports and income from selling oil out of that Strait as well. As such it is not a no-brainer choice for Iran to close the Strait for oil exports. And looking at the il price this morning it is clear that the oil market doesn’t assign a very high probability of it happening. It is however probably well within the capability of Iran to close the Strait off with rockets, mines, air-drones and possibly sea-drones. Just look at how Ukraine has been able to control and damage the Russian Black Sea fleet.
What to do about the highly enriched uranium which has gone missing? While the US and Israel can celebrate their destruction of Iranian nuclear facilities they are also scratching their heads over what to do with the lost Iranian nuclear material. Iran had 408 kg of highly enriched uranium (IAEA). Almost weapons grade. Enough for some 10 nuclear warheads. It seems to have been transported out of Fordow before the attack this weekend.
The market is still on edge. USD 80-something/b seems sensible while we wait. The oil market reaction to this weekend’s events is very muted so far. The market is still on edge awaiting what Iran will do. Because Iran will do something. But what and when? An oil price of 80-something seems like a sensible level until something do happen.


Hur säkrar vi Sveriges tillgång till kritiska metaller och mineral i en ny geopolitisk verklighet?

Lundin Mining ska bli en av de tio största kopparproducenterna i världen

Sommarvädret styr elpriset i Sverige

Samtal om flera delar av råvarumarknaden
Tightening fundamentals – bullish inventories from DOE

Stor uppsida i Lappland Guldprospekterings aktie enligt analys
Silverpriset släpar efter guldets utveckling, har mer uppsida

Uppgången i oljepriset planade ut under helgen

Låga elpriser i sommar – men mellersta Sverige får en ökning

Mahvie Minerals växlar spår – satsar fullt ut på guld
-
 Nyheter4 veckor sedan
Stor uppsida i Lappland Guldprospekterings aktie enligt analys
-
 Nyheter4 veckor sedan
Silverpriset släpar efter guldets utveckling, har mer uppsida
-
 Nyheter3 veckor sedan
Uppgången i oljepriset planade ut under helgen
-
 Nyheter3 veckor sedan
Låga elpriser i sommar – men mellersta Sverige får en ökning
-
 Nyheter2 veckor sedan
Mahvie Minerals växlar spår – satsar fullt ut på guld
-
Analys3 veckor sedan
Very relaxed at USD 75/b. Risk barometer will likely fluctuate to higher levels with Brent into the 80ies or higher coming 2-3 weeks
-

 Nyheter1 vecka sedan
Oljan, guldet och marknadens oroande tystnad
-

 Nyheter1 vecka sedan
Jonas Lindvall är tillbaka med ett nytt oljebolag, Perthro, som ska börsnoteras