

Analys
Rebounding on expectations for a tightening Q3-17 while US shale oil rigs continues to rise

 Brent crude front month contract lost 3.9% last week closing the week at $45.54/b. Even the longer dated December 2020 contract lost 1.7% with a close of $51.86/b. WTI crude prices lost a comparable amount with the WTI 1 mth contract closing at $43.01/b.
Oil prices staged a 1.6% rebound during the last two days of the week following a more or less continuous sell-off since late May. There were no obvious bull-drivers lifting prices higher. Technical indicators however pointed to solid oversold territory. Headlines started to air views that “when all headlines are bearish, that’s the time to buy” etc.
Crude oil prices are gaining another 1% this morning with Brent 1mth contract trading at $46.0/b. Again there is no obvious bull-driving headline. The price recovery of 2.7% since the bottom last week cannot really be said to be explosive and there is currently no headline bullish driver pushing it higher.
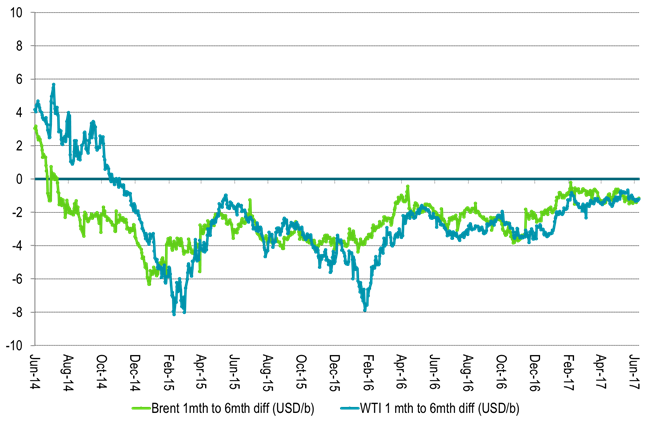
We do have a strong, seasonal increase in oil demand ahead of us for Q3 and Q4 with a substantial amount of refineries heading back into operation. Thus the current weakness in the physical crude oil market could be the final bear-point before a tightening crude oil market and significant inventory draw downs in Q3 and Q4. We do believe that inventories will draw down significantly during the coming two quarters. The price effect could however be a firming of the 1 to 18 mth contract where the 1 mth contract gains versus the 18 mth contract rather than a lifting of the whole forward crude price curve.
The strong rise in floating storage was also suddenly look upon as a sign that physical crude traders are taking long position in physical cargoes awaiting better prices. The reason being that it is not economical to store oil at sea since the contango isn’t really deep enough. Thus the only explanation would thus be that physical traders are proactively taking on floating cargoes in order to position for an oil price rebound. We are however not all that convinced about this argument. The 2 mn bl Sea Lynx VLCC has now been circling in the North Sea for several weeks with oil from the vessel being offered repeatedly to the market. The same goes for the 2 mn bl Desimi with has been circling in the North Sea since late April, early May.
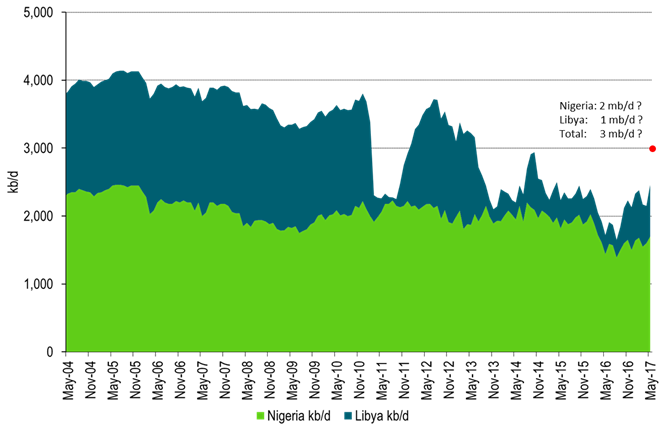
The production revival in Libya and Nigeria is creating concerns for the effect of OPEC’s cuts. Exports from Nigeria now look set to reach 2 mn bl in August while Libya’s NOC last week stated that they reached 0.9 mb/d with a target of 1 mb/d in July. This adds up to 3 mb/d for the two versus a production of 2.2 mb/d in November when OPEC & Co agreed on its production cut.
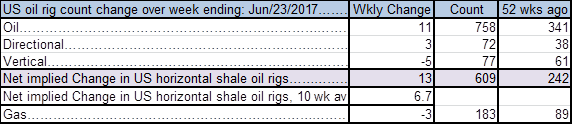
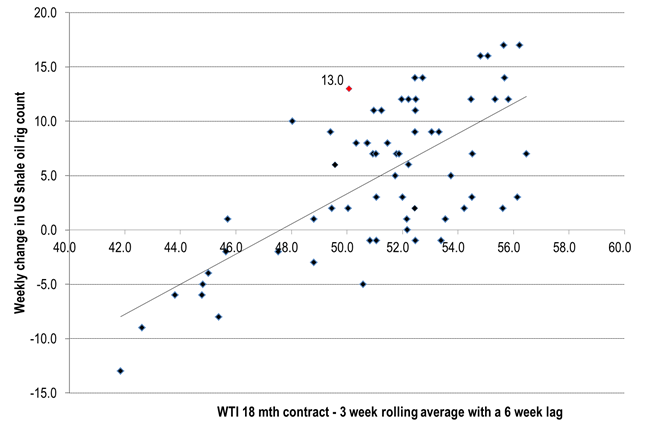
Last week 11 oil rigs were added in the US. Implied shale oil rigs rose by 13 which is the highest weekly addition since mid-April. Looking 6 weeks back the WTI 18 mth price contract traded at $49-50/b which obviously was not low enough to deter drillers from adding more oil rigs. On average there has been added 6.7 shale oil rigs each week the last 6 weeks. The average weekly additions since June last year are 6.8 rigs/week. The high of rig additions was from mid-Jan to mid-March when 11.6 rigs/week were added. Thus seen from the US shale oil drilling side of things the oil price has not yet become low enough for long enough in order to stem a further rise in active shale oil rigs.
Table1: 11 additional oil rigs last week in the US
Ch1: Changes in US shale oil rig count versus WTI 18 mth contract price some 6 weeks ago.
Ch2: The 1-6 mth contango has not deepened
This part of the curve should tighten in Q3 and Q4
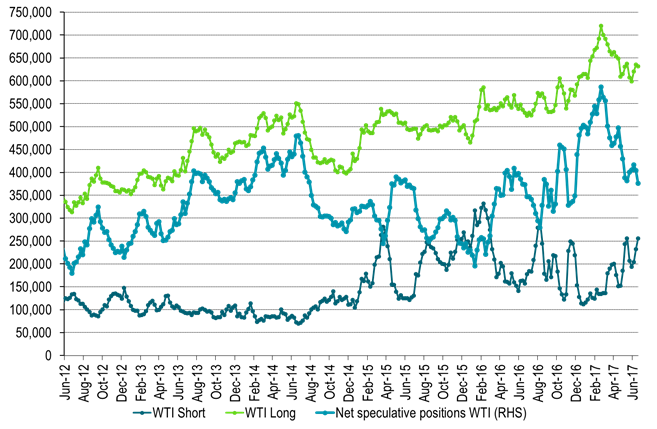
Ch3: Hedgefund speculative positioning – Net-long close to previous lows
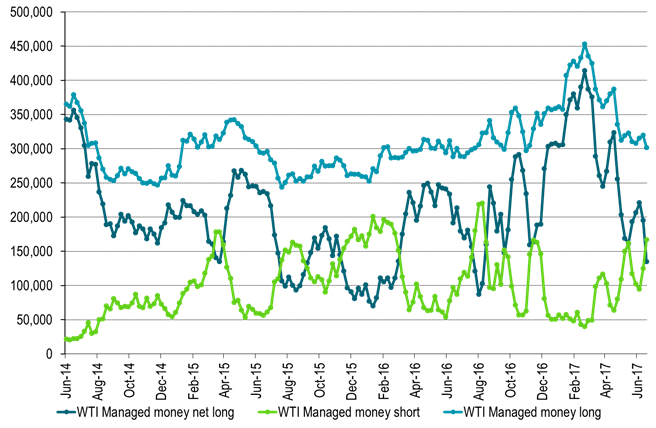
Ch4: Total net long speculative WTI positioning – Into neutral territory but still some way to go to previous lows
Ch5: Production revival in Libya and Nigeria partially countering the effect of OPEC cuts
Kind regards
Bjarne Schieldrop
Chief analyst, Commodities
SEB Markets
Merchant Banking

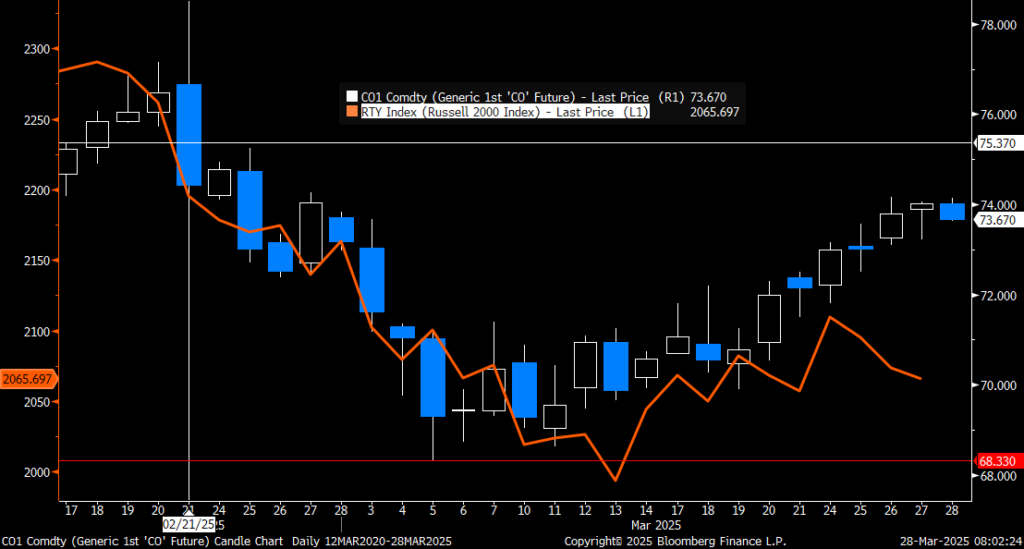
Higher last week and today as sanctions bite harder than recession fears. Brent crude gained 2% last week with a close on Friday of USD 73.63/b. It traded in a range of USD 71.8-74.17/b. It traded mostly higher through the week despite sharp, new selloffs in equities along with US consumer expectations falling to lowest level since 2013 (Consumer Conf. Board Expectations.) together with signals of new tariffs from the White House. Ahead this week looms the ”US Liberation Day” on April 2 when the White House will announce major changes in the country’s trade policy. Equity markets are down across the board this morning while Brent crude has traded higher and lower and is currently up 0.5% at USD 74.0/b at the moment.

New US sanctions towards Iran and Venezuela and threats of new sanctions towards Russia. New sanctions on Venezuela and Iran are helping to keep the market tight. Oil production in Venezuela reached 980 kb/d in February following a steady rise from 310 kb/d in mid-2020 while it used to produce 2.3 mb/d up to 2016. Trump last week allowed Chevron to import oil from Venezuela until 27 May. But he also said that any country taking oil or gas from Venezuela after 2 April will face 25% tariffs on any goods exported into the US. Trump is also threatening to sanction Russian oil further if Putin doesn’t move towards a peace solution with Ukraine.
The OPEC+ to meet on Saturday 5 April to decide whether to lift production in May or not. The OPEC+ Joint Ministerial Monitoring Committee will meet on Saturday 5 April to review market conditions, compliance by the members versus their production targets and most importantly decide whether they shall increase production further in May following first production hike in April. We find it highly likely that they will continue to lift production also in May.
OPEC(+) crashed the oil price twice to curb US shale, but it kicked back quickly. OPEC(+) has twice crashed the oil price in an effort to hurt and disable booming US shale oil production. First in 2014/15/16 and then in the spring of 2020. The first later led to the creation of OPEC+ through the Declaration of Cooperation (DoC) in the autumn of 2016. The second was in part driven by Covid-19 as well as a quarrel between Russia and Saudi Arabia over market strategy. But the fundamental reason for that quarrel and the crash in the oil price was US shale oil producers taking more and more market share.
The experience by OPEC+ through both of these two events was that US shale oil quickly kicked back even bigger and better yielding very little for OPEC+ to cheer about.
OPEC+ has harvested an elevated oil price but is left with a large spare capacity. The group has held back large production volumes since Spring 2020. It yielded the group USD 100/b in 2022 (with some help from the war in Ukraine), USD 81/b on average in 2023/24 and USD 75/b so far this year. The group is however left with a large spare capacity with little room to place it back into the market without crashing the price. It needs non-OPEC+ in general and US shale oil especially to yield room for it to re-enter.
A quick crash and painful blow to US shale oil is no longer the strategy. The strategy this time is clearly very different from the previous two times. It is no longer about trying to give US shale oil producers a quick, painful blow in the hope that the sector will stay down for an extended period. It is instead a lengthier process of finding the pain-point of US shale oil players (and other non-OPEC+ producers) through a gradual increase in production by OPEC+ and a gradual decline in the oil price down to the point where non-OPEC+ in general and US liquids production especially will gradually tick lower and yield room to the reentry of OPEC+ spare capacity. It does not look like a plan for a crash and a rush, but instead a tedious process where OPEC+ will gradually force its volumes back into the market.
Where is the price pain-point for US shale oil players? The Brent crude oil price dropped from USD 84/b over the year to September last year to USD 74/b on average since 1 September. The values for US WTI were USD 79/b and USD 71/b respectively. A drop of USD 9/b for both crudes. There has however been no visible reaction in the US drilling rig count following the USD 9/b fall. The US drilling rig count has stayed unchanged at around 480 rigs since mid-2024 with the latest count at 484 operating rigs. While US liquids production growth is slowing, it is still set to grow by 580 kb/d in 2025 and 445 kb/d in 2026 (US EIA).
US shale oil average cost-break-even at sub USD 50/b (BNEF). Industry says it is USD 65/b. BNEF last autumn estimated that all US shale oil production fields had a cost-break-even below USD 60/b with a volume weighted average just below USD 50/b while conventional US onshore oil had a break-even of USD 65/b. A recent US Dallas Fed report which surveyed US oil producers did however yield a response that the US oil industry on average needed USD 65/b to break even. That is more than USD 15/b higher than the volume weighted average of the BNEF estimates.
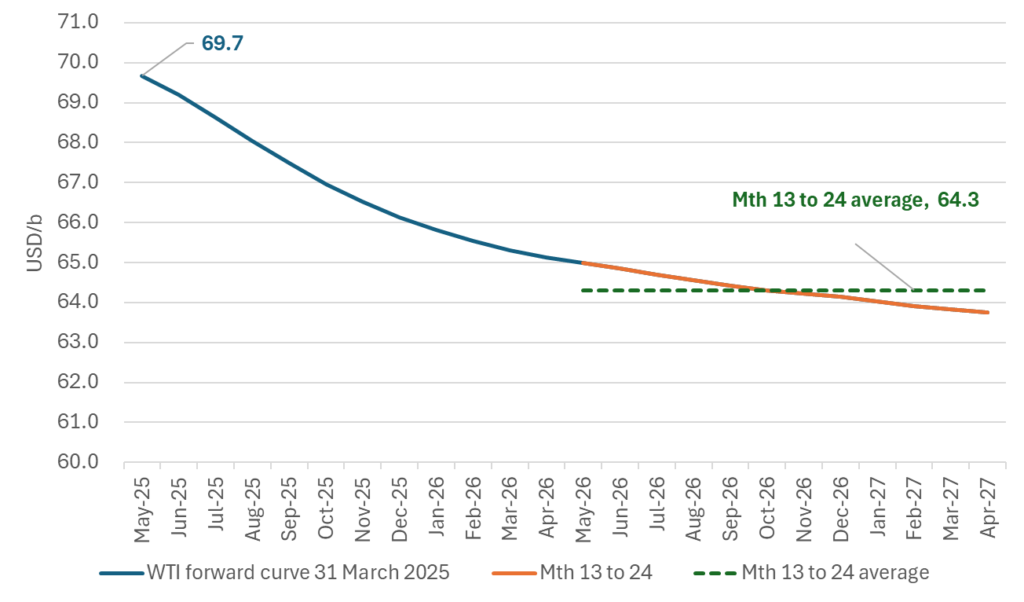
The WTI 13-to-24-month strip is at USD 64/b. Probably the part of the curve controlling activity. As such it needs to move lower to curb US shale oil activity. The WTI price is currently at USD 69.7/b. But the US shale oil industry today works on a ”12-month drilling first, then fracking after” production cycle. When it considers whether to drill more or less or not, it is typically on a deferred 12-month forward price basis. The average WTI price for months 13 to 24 is today USD 64/b. The price signal from this part of the curve is thus already down at the pain-point highlighted by the US shale oil industry. In order to yield zero growth and possibly contraction in US shale oil production, this part of the curve needs to move below that point.
The real pain-point is where we’ll see US drilling rig count starting to decline. We still don’t know whether the actual average pain-point is around USD 50/b as BNEF estimate it is or whether it is closer to USD 65/b which the US shale oil bosses say it is. The actual pain-point is where we’ll see further decline in US drilling rig count. And there has been no visible change in the rig count since mid-2024. The WTI 13-to-24-month prices need to fall further to reveal where the US shale oil industry’ actual pain-point is. And then a little bit more in order to slow production growth further and likely into some decline to make room for reactivation of OPEC+ spare capacity.
The WTI forward price curve. The average of 13 to 24 month is now USD 64.3/b.
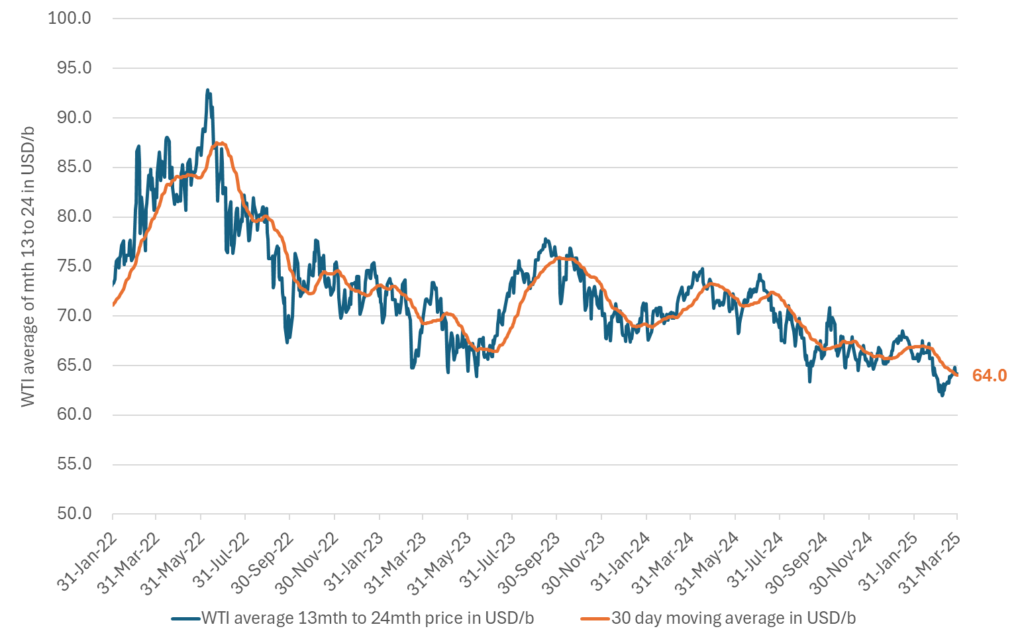
The average 13-to-24-month prices on the WTI price curve going back to primo January 2022. Recently dropping below USD 65/b for some extended period.
Brent has defied bearish equities for three days but is losing its stamina today. Brent gained 0.3% yesterday with a close of USD 74.03/b, the highest close since 27 February and almost at the high of the day. It traded as low as USD 73.23/b. Brent has now defied the equity selloff three days in a row by instead ticking steadily higher. A sign of current spot tightness. This morning however it is losing some of its stamina and is down 0.5% at USD 73.7/b along with negative equities and yet higher gold prices.
The new US Iran sanctions is creating frictions in getting its oil to market and helps keeping oil market tight. Part of the current tightness is due to the new US sanctions on Iran which. Ships containing 17 mb of its oil now sits idle east of Malaysia waiting (Bloomberg) for ship-to-ship transfers with China teapot refineries the normal final destination. But the latest US sanctions has probably made these refineries much more cautious. More friction before Iranian oil is reaching its final destination if at all. Tighter market.
Lower Saudi OSPs for May is expected. A signal of a softer market ahead as OPEC+ lifts production. Saudi Aramco is expected to reduce it official selling price (OSPs) for Arab Light to Asia for May deliveries by USD 2/b. A measure to make its oil more competitive in relative to other crudes suppliers. It is also a sign of a softer market ahead. Naturally so since OPEC+ is set to lift production in April and also most likely in May. If Saudi Aramco reduces its OSPs to Asia for May across its segments of crudes, then it is a signal it is expecting softer oil market conditions. But news today is only discussing Arab Light while the main tightness int the market today is centered around medium sour crude segment. A lowering of the OSPs for the heavier and more sour grades will thus be a more forceful bearish signal.
Front-end backwardation may ease as the Brent May contract rolls off early next week. The Brent May future will roll off early next week. It will be interesting to see how that affects the front-end 1-3mth backwardation as it is shifted out into summer where a softer market is expected.
Brent is boring like crazy with 30dma annualized volatility of just 21%. Waiting for something to happen.

Brent crude has defied three days of bearish equity markets and ticked higher instead. Caving in a bit this morning with yet another day of bearish equities and bullish gold.
Last week, U.S. crude oil refinery inputs averaged 15.8 million barrels per day, an increase of 87k bl/day from the previous week. Refineries operated at 87% of their total operable capacity during the period. Gasoline production declined, averaging 9.2 million barrels per day (m bl/d), while distillate (diesel) production also edged lower to 4.5 m bl/d.

U.S. crude oil imports averaged 6.2 m bl/d, up 810k barrels from the prior week. Over the past four weeks, imports have averaged 5.7 m bl/d, representing an 11% YoY decline compared to the same period last year.
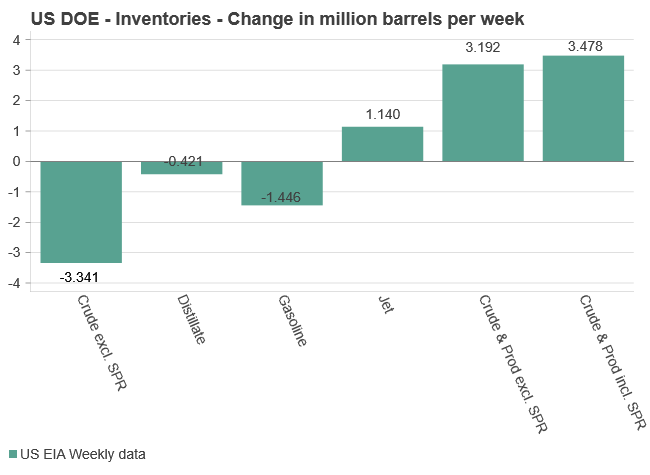
Where we place most of our attention – and what continues to influence short-term price dynamics in both WTI and Brent crude – remains U.S. crude and product inventories. Total commercial petroleum inventories (excl. SPR) rose by 3.2 m bl, a relatively modest build that is unlikely to trigger major price reactions. Brent crude traded at around USD 73.9 per barrel when the data was released yesterday afternoon (16:30 CEST) and has since slid by USD 0.4/bl to USD 73.5/bl this morning, still among the highest price levels seen in March 2025.
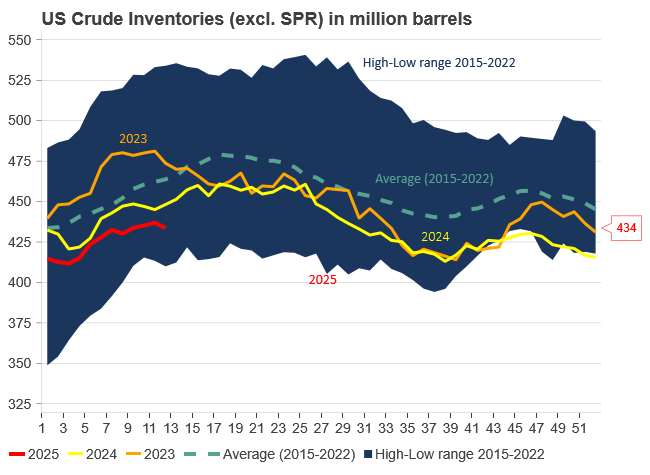
Commercial crude oil inventories (excl. SPR) fell by 3.3 m bl, contrasting with last week’s build and offering some price support, though the draw was less severe than the API’s reported -4.6 m bl. Crude inventories now stand at 433.6 m bl, about 5% below the five-year average for this time of year. Gasoline inventories declined by 1.4 m bl (API: -3.3 m bl), though they remain 2% above the five-year average. Diesel inventories fell by 0.4 m bl (API: -1.3 m bl), leaving them 7% below seasonal norms.
Over the past four weeks, total products supplied – a proxy for U.S. demand – averaged 20.2 m bl/d, up 0.5% compared to the same period last year. Gasoline supplied averaged 8.9 m bl/d, down 0.2%, while diesel supplied came in at 3.9 m bl/d, up 1.8%. Jet fuel demand also showed strength, rising 3.9% over the same four-week period.


Guld kostar över 3100 USD per uns och 1 miljoner kronor per kilo
Oil gains as sanctions bite harder than recession fears

Danska Seaborg Technologies siktar på serieproduktion av smältsaltsreaktorer till mitten av 2030-talet

Ett samtal om läget på uranmarknaden
Brent Edges Lower After Resisting Equity Slump – Sanctions, Saudi Pricing in Focus

OPEC+ börjar öka oljeutbudet från april

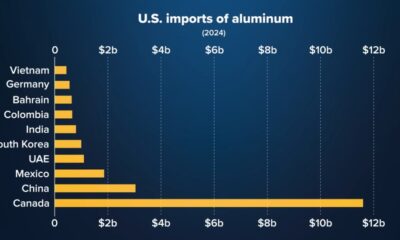
USA är världens största importör av aluminium
Crude oil comment: Unable to rebound as the US SPX is signaling dark clouds on the horizon
Oversold. Rising 1-3mth time-spreads. Possibly rebounding to USD 73.5/b before downside ensues

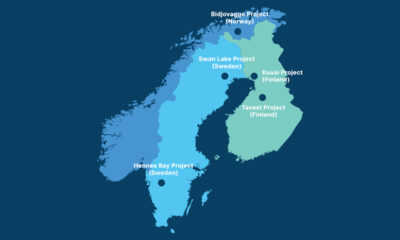
Arctic Minerals är ett nordiskt mineralprospekterings- och gruvutvecklingsbolag
-
 Nyheter4 veckor sedan
OPEC+ börjar öka oljeutbudet från april
-
 Nyheter3 veckor sedan
USA är världens största importör av aluminium
-
Analys3 veckor sedan
Crude oil comment: Unable to rebound as the US SPX is signaling dark clouds on the horizon
-
Analys3 veckor sedan
Oversold. Rising 1-3mth time-spreads. Possibly rebounding to USD 73.5/b before downside ensues
-
 Nyheter4 veckor sedan
Arctic Minerals är ett nordiskt mineralprospekterings- och gruvutvecklingsbolag
-
Analys3 veckor sedan
Crude oil comment: Not so fragile yet. If it was it would have sold off more yesterday
-
Analys4 veckor sedan
A deliberate measure to push oil price lower but it is not the opening of the floodgates
-
 Nyheter2 veckor sedan
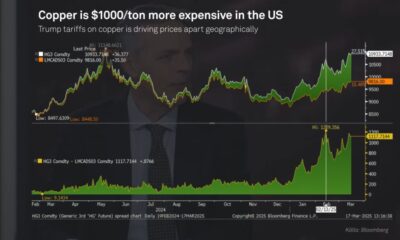
Priset på koppar skiljer sig åt efter tariffer