

Analys
Price action Rebounding from $50/b but running into headwind from stronger USD

 SEB Brent crude front month price forecast:
Q2-17: $57.5/b
Q3-17: $55.0/b
Q4-17: $52.5/b
Price action – Rebounding from $50/b but running into headwind from stronger USD
After having touched a low of $49.71/b last Wednesday Brent crude front month contract revived to touch a high of $53.1/b yesterday. This morning it is trading down 0.4% at $52.7/b. Prices found good support at the $50/b level with a solid influx of natural oil consumers jumping in securing forward hedges at lower levels. The oil price recovery over the last week is however facing headwinds from a 1.3% stronger USD and might thus run out of steam.
Crude oil comment – No reason for OPEC to roll cuts into H2
There seems to be an almost unanimous view that OPEC will roll their H1-17 cuts into H2-17. We cannot really understand why they should do that. OECD inventories declined all through the second half of 2016 and ended down y/y in December for the first time in quite a few years. And that was without the help of OPEC! The market has been confused by the fact that inventories in weekly data rose some 100 mb through the first two and a half months of the year. The market was also disappointed when it heard that OECD inventories rose 48 mb month/month in January. Do note however that the normal seasonal pattern is for OECD inventories to rise by 30 mb in January. Thus they only rose by 18 mb more than normal. Total crude and product stocks in the US have declined 4 weeks out of the last 6 weeks and we strongly believe that inventories will declined steadily from here onwards. When OPEC meets in Vienna on May 25th the perspective will be
1) Declining inventories (i.e. market is in balance to deficit)
2) A flat to backwardated crude oil curve. I.e. no spot price discount to longer dated contracts
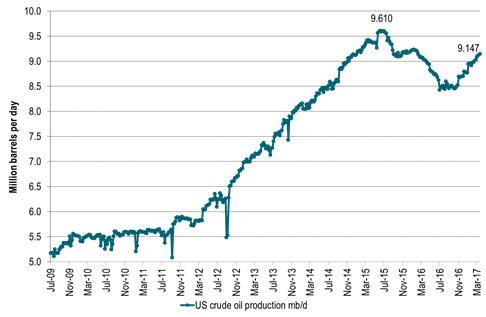
3) US crude production standing close to previous peak and rising rapidly
4) Demand will jump some 1.9 mb/d from H1-17 og H2-17 seasonally with little risk for surplus
Thus the natural communication from OPEC following their forthcoming May 25th meeting in Vienna would be that the market is in balance. Actually it is in deficit and inventories are drawing down. There is no longer a spot price discount to longer dated contracts. I.e. there is very little stress in the market due to surplus oil and OPEC receives no discounted cash flow versus longer dated prices. I.e. there is little economic reason for OPEC to cut as they then are receiving a fair price for their oil (equal to longer dated prices). A further cut would only endanger OPEC’s market share through unnecessary stimulus of US shale oil production. That last dimension will be highly accentuated at the meeting on the 25th of May since if we just extrapolate US crude oil production so far this year it may stand at 9.5 mb/d at their May meeting. US crude oil production is now growing just as fast (marginal annualized pace of 1.5 mb/d) as it did from 2011 to 2015. The hypothesis from OPEC’s November meeting in 2016 that US shale oil production will only recover gradually as long as the oil price stays below $60/b has been totally busted. The empirical evidence is that when the mid-term WTI curve (one to two year horizon forward prices) averaged $52/b in H2 then US shale oil rigs rose by 7 rigs/week. When those forward prices instead rose to $55-56/b following OPEC’s decision to cut the weekly rig additions rose to about 10 rigs/week.
OPEC is likely to conclude that all looks good. Market is in balance to deficit. Inventories are drawing down. There is no longer any spot price rebate in the market and little stress from surplus oil to be seen. Demand will rise strongly into H2-17. Thus OPEC is likely to move back into operation putting their 1.16 mb/d H1-17 cut aside and revisit the question of cuts at their next meeting in Vienna at the end of 2017. They will like to look like they are in control and an extension of cuts into H2-17 will stimulate US shale oil production to an extent that will make it look like they are out of control.
We expect crude oil prices to get a brief set-back when OPEC announces such a decision. But we do expect it to be brief and with limited consequences. We expect Brent crude oil prices to end the year with an average of $52.5/b in Q4-17. We expect the curve to be some $3/b in backwardation at that time which implies that the one to two year forward prices at that time will trade around $50/b. Since the WTI curve is trading at some $2/b below the Brent crude curve it will mean that the mid-term (1 to 2 year forward) WTI crude oil curve will then trade at around $48/b. We expect that to dampen the current very strong weekly rig additions which we see currently.
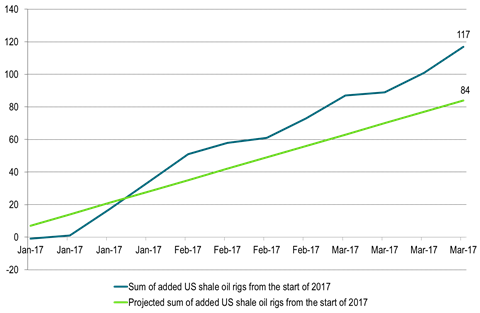
Ch1: US shale oil rigs continues to rise strongly
Last week the number of US shale oil rigs rose by 16 rigs or 9 rigs more than our projection
So far the average weekly US shale oil rig additions stands at 9.75 rigs/week
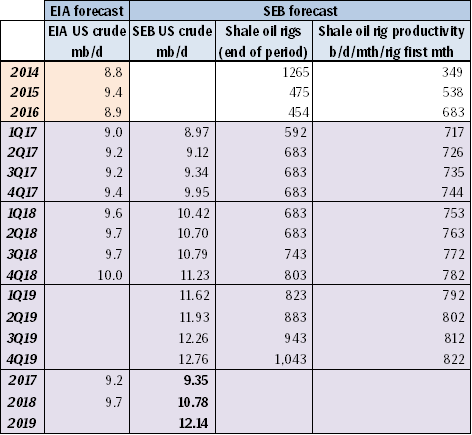
Ch2: SEB US crude oil production projection lifted by 12 kb/d in 2017, by 49 kb/d in 2018 and by 68 kb/d in 2019
Total additional cumulative US crude oil production over the next three years rose by 47 million barrels as a result of 16 rigs being added last week versus our expected 7 rigs
We expect the US EIA to lift its US crude oil production projection again in its forthcoming April report reflecting the fact that 51 shale oil rigs were added to the market in March.
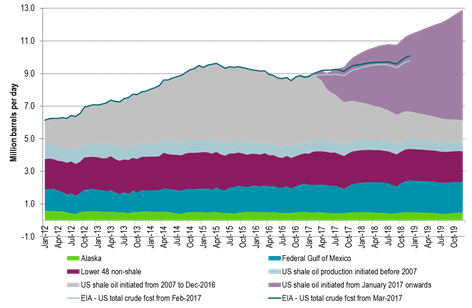
Ch3: SEB US crude oil production projection graph
Ch4: SEB global crude oil supply demand balance
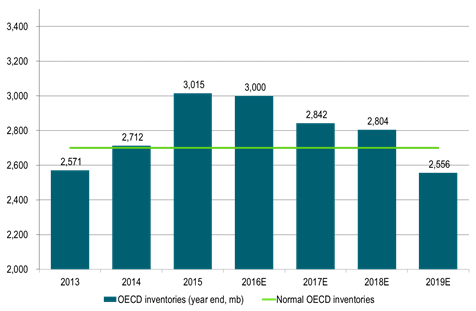
Ch5: SEB projected OECD end of year inventories
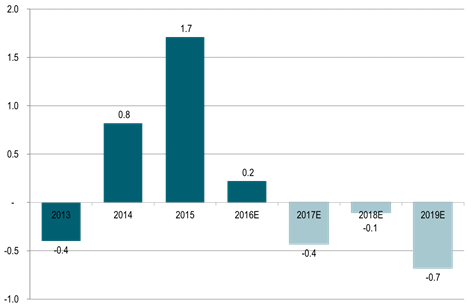
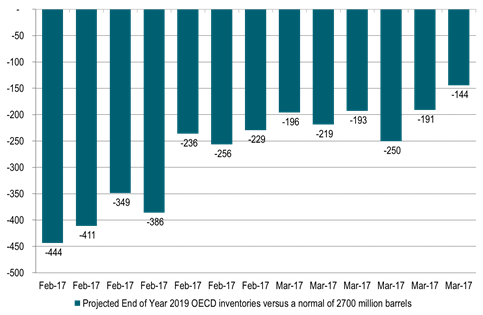
Ch6: Time development of SEB’s projected 2019 end of year OECD oil inventories versus a normal of 2700 million barrels
A deep draw in OECD inventories at the end of 2019 has become much less pronounced as rig count is rising much faster than expected thus lifting our US crude oil production projection
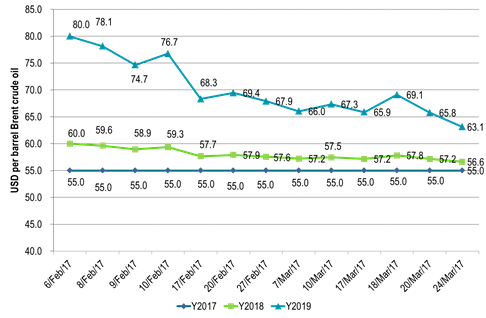
Ch6: Time development of SEB’s dynamic Brent crude oil price forecast
Much less price squeeze risk in 2019 as the balance has softened with higher US production projection
Ch7: US crude oil production increasing in a stright line
Potentially closing in at 9.5 mb/d when OPEC meets in Vienna on May 25th
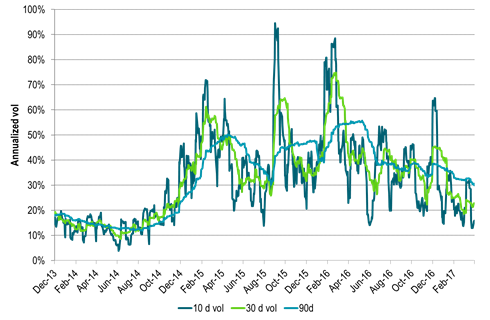
Ch8: Volatility is trending lower with yet more downside to come we expect
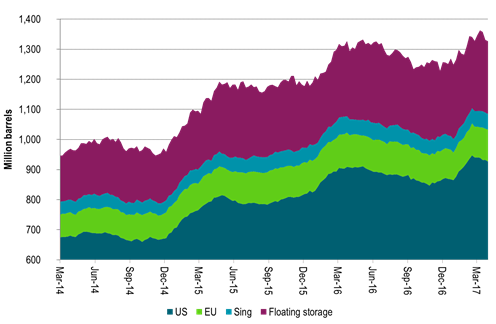
Ch9: Weekly inventory data are starting to show a draw
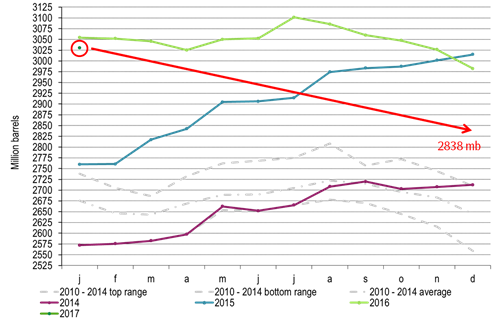
Ch10: And this is what we expect OECD inventories will do in 2017 (We assume OPEC will not cut in H2-17)
But due to US shale oil revival there won’t be much draws in 2018
Thus all through 2017 and 2018 the OECD inventories will stay above normal with few pressure points in the global oil market
Kind regards
Bjarne Schieldrop
Chief analyst, Commodities
SEB Markets
Merchant Banking
The latest weekly report from the US DOE showed a substantial drawdown across key petroleum categories, adding more upside potential to the fundamental picture.

Commercial crude inventories (excl. SPR) fell by 5.8 million barrels, bringing total inventories down to 415.1 million barrels. Now sitting 11% below the five-year seasonal norm and placed in the lowest 2015-2022 range (see picture below).
Product inventories also tightened further last week. Gasoline inventories declined by 2.1 million barrels, with reductions seen in both finished gasoline and blending components. Current gasoline levels are about 3% below the five-year average for this time of year.
Among products, the most notable move came in diesel, where inventories dropped by almost 4.1 million barrels, deepening the deficit to around 20% below seasonal norms – continuing to underscore the persistent supply tightness in diesel markets.
The only area of inventory growth was in propane/propylene, which posted a significant 5.1-million-barrel build and now stands 9% above the five-year average.
Total commercial petroleum inventories (crude plus refined products) declined by 4.2 million barrels on the week, reinforcing the overall tightening of US crude and products.


A classic case of “buy the rumor, sell the news” played out in oil markets, as Brent crude has dropped sharply – down nearly USD 10 per barrel since yesterday evening – following Iran’s retaliatory strike on a U.S. air base in Qatar. The immediate reaction was: “That was it?” The strike followed a carefully calibrated, non-escalatory playbook, avoiding direct threats to energy infrastructure or disruption of shipping through the Strait of Hormuz – thus calming worst-case fears.
After Monday morning’s sharp spike to USD 81.4 per barrel, triggered by the U.S. bombing of Iranian nuclear facilities, oil prices drifted sideways in anticipation of a potential Iranian response. That response came with advance warning and caused limited physical damage. Early this morning, both the U.S. President and Iranian state media announced a ceasefire, effectively placing a lid on the immediate conflict risk – at least for now.
As a result, Brent crude has now fallen by a total of USD 12 from Monday’s peak, currently trading around USD 69 per barrel.
Looking beyond geopolitics, the market will now shift its focus to the upcoming OPEC+ meeting in early July. Saudi Arabia’s decision to increase output earlier this year – despite falling prices – has drawn renewed attention considering recent developments. Some suggest this was a response to U.S. pressure to offset potential Iranian supply losses.
However, consensus is that the move was driven more by internal OPEC+ dynamics. After years of curbing production to support prices, Riyadh had grown frustrated with quota-busting by several members (notably Kazakhstan). With Saudi Arabia cutting up to 2 million barrels per day – roughly 2% of global supply – returns were diminishing, and the risk of losing market share was rising. The production increase is widely seen as an effort to reassert leadership and restore discipline within the group.
That said, the FT recently stated that, the Saudis remain wary of past missteps. In 2018, Riyadh ramped up output at Trump’s request ahead of Iran sanctions, only to see prices collapse when the U.S. granted broad waivers – triggering oversupply. Officials have reportedly made it clear they don’t intend to repeat that mistake.
The recent visit by President Trump to Saudi Arabia, which included agreements on AI, defense, and nuclear cooperation, suggests a broader strategic alignment. This has fueled speculation about a quiet “pump-for-politics” deal behind recent production moves.
Looking ahead, oil prices have now retraced the entire rally sparked by the June 13 Israel–Iran escalation. This retreat provides more political and policy space for both the U.S. and Saudi Arabia. Specifically, it makes it easier for Riyadh to scale back its three recent production hikes of 411,000 barrels each, potentially returning to more moderate increases of 137,000 barrels for August and September.
In short: with no major loss of Iranian supply to the market, OPEC+ – led by Saudi Arabia – no longer needs to compensate for a disruption that hasn’t materialized, especially not to please the U.S. at the cost of its own market strategy. As the Saudis themselves have signaled, they are unlikely to repeat previous mistakes.
Conclusion: With Brent now in the high USD 60s, buying oil looks fundamentally justified. The geopolitical premium has deflated, but tensions between Israel and Iran remain unresolved – and the risk of missteps and renewed escalation still lingers. In fact, even this morning, reports have emerged of renewed missile fire despite the declared “truce.” The path forward may be calmer – but it is far from stable.
Analys
A muted price reaction. Market looks relaxed, but it is still on edge waiting for what Iran will do
Brent crossed the 80-line this morning but quickly fell back assigning limited probability for Iran choosing to close the Strait of Hormuz. Brent traded in a range of USD 70.56 – 79.04/b last week as the market fluctuated between ”Iran wants a deal” and ”US is about to attack Iran”. At the end of the week though, Donald Trump managed to convince markets (and probably also Iran) that he would make a decision within two weeks. I.e. no imminent attack. Previously when when he has talked about ”making a decision within two weeks” he has often ended up doing nothing in the end. The oil market relaxed as a result and the week ended at USD 77.01/b which is just USD 6/b above the year to date average of USD 71/b.

Brent jumped to USD 81.4/b this morning, the highest since mid-January, but then quickly fell back to a current price of USD 78.2/b which is only up 1.5% versus the close on Friday. As such the market is pricing a fairly low probability that Iran will actually close the Strait of Hormuz. Probably because it will hurt Iranian oil exports as well as the global oil market.
It was however all smoke and mirrors. Deception. The US attacked Iran on Saturday. The attack involved 125 warplanes, submarines and surface warships and 14 bunker buster bombs were dropped on Iranian nuclear sites including Fordow, Natanz and Isfahan. In response the Iranian Parliament voted in support of closing the Strait of Hormuz where some 17 mb of crude and products is transported to the global market every day plus significant volumes of LNG. This is however merely an advise to the Supreme leader Ayatollah Ali Khamenei and the Supreme National Security Council which sits with the final and actual decision.
No supply of oil is lost yet. It is about the risk of Iran closing the Strait of Hormuz or not. So far not a single drop of oil supply has been lost to the global market. The price at the moment is all about the assessed risk of loss of supply. Will Iran choose to choke of the Strait of Hormuz or not? That is the big question. It would be painful for US consumers, for Donald Trump’s voter base, for the global economy but also for Iran and its population which relies on oil exports and income from selling oil out of that Strait as well. As such it is not a no-brainer choice for Iran to close the Strait for oil exports. And looking at the il price this morning it is clear that the oil market doesn’t assign a very high probability of it happening. It is however probably well within the capability of Iran to close the Strait off with rockets, mines, air-drones and possibly sea-drones. Just look at how Ukraine has been able to control and damage the Russian Black Sea fleet.
What to do about the highly enriched uranium which has gone missing? While the US and Israel can celebrate their destruction of Iranian nuclear facilities they are also scratching their heads over what to do with the lost Iranian nuclear material. Iran had 408 kg of highly enriched uranium (IAEA). Almost weapons grade. Enough for some 10 nuclear warheads. It seems to have been transported out of Fordow before the attack this weekend.
The market is still on edge. USD 80-something/b seems sensible while we wait. The oil market reaction to this weekend’s events is very muted so far. The market is still on edge awaiting what Iran will do. Because Iran will do something. But what and when? An oil price of 80-something seems like a sensible level until something do happen.


Eurobattery Minerals förvärvar majoritet i spansk volframgruva

USA ska införa 50 procent tull på koppar

Ryska staten siktar på att konfiskera en av landets största guldproducenter

Hur säkrar vi Sveriges tillgång till kritiska metaller och mineral i en ny geopolitisk verklighet?

Lundin Mining ska bli en av de tio största kopparproducenterna i världen

Mahvie Minerals växlar spår – satsar fullt ut på guld

Uppgången i oljepriset planade ut under helgen

Låga elpriser i sommar – men mellersta Sverige får en ökning

Jonas Lindvall är tillbaka med ett nytt oljebolag, Perthro, som ska börsnoteras
A muted price reaction. Market looks relaxed, but it is still on edge waiting for what Iran will do
-
 Nyheter3 veckor sedan
Mahvie Minerals växlar spår – satsar fullt ut på guld
-
 Nyheter4 veckor sedan
Uppgången i oljepriset planade ut under helgen
-
 Nyheter4 veckor sedan
Låga elpriser i sommar – men mellersta Sverige får en ökning
-
 Nyheter3 veckor sedan
Jonas Lindvall är tillbaka med ett nytt oljebolag, Perthro, som ska börsnoteras
-
Analys3 veckor sedan
A muted price reaction. Market looks relaxed, but it is still on edge waiting for what Iran will do
-

 Nyheter3 veckor sedan
Oljan, guldet och marknadens oroande tystnad
-
Analys4 veckor sedan
Very relaxed at USD 75/b. Risk barometer will likely fluctuate to higher levels with Brent into the 80ies or higher coming 2-3 weeks
-

 Nyheter3 veckor sedan
Domstolen ger klartecken till Lappland Guldprospektering