

Analys
Gold outlook 2019 – recovery expected to continue
 Gold staged a recovery late in 2018. The yellow metal has recovered most of its losses since June 2018. A collapse in speculative positioning in gold futures drove prices down in the second half of the year, sentiment toward gold is clearly recovering in recent weeks. We expect the recovery to continue as many risks that were being ignored by the market start to get priced-in to gold. Our base case scenario is for gold to reach close to US$1370/oz by year end.
Figure 1: Gold price forecast
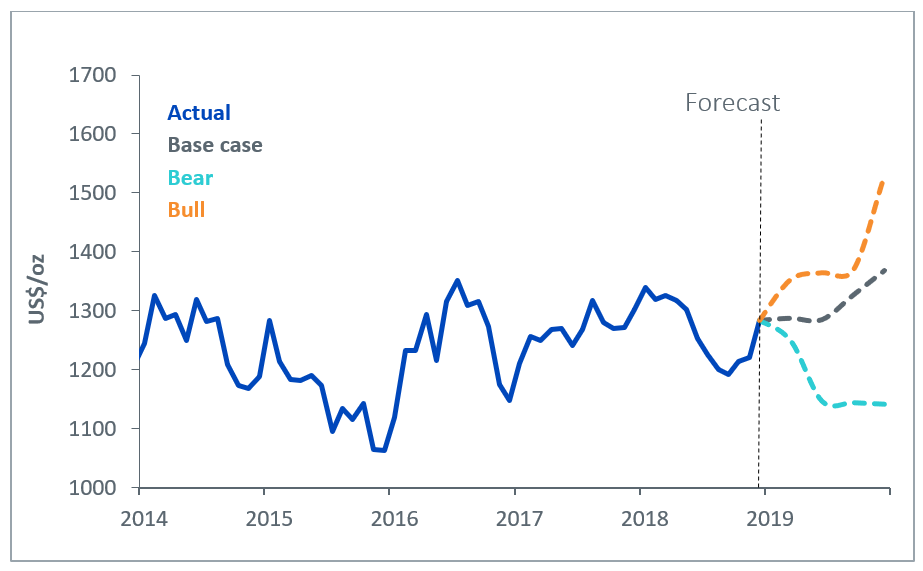
Source: WisdomTree Model Forecasts, Bloomberg Historical Data, data available as of close 31 December 2018. Forecasts are not an indicator of future performance and any investments are subject to risks and uncertainties.
Approach
Using the framework we outlined in our paper Gold outlook: gold to flatline out to June 2019 in the absence of shocks, we apply our views on inflation, exchange rates, interest rates and investor sentiment to try to project where gold will be by the end of the year.
Speculative positioning drives recovery
In 2018 speculative positioning fell to the lowest level since 2001 briefly before recovering very late in the year. Judging by flows into gold Exchange Traded Products, sentiment toward the metal is clearly recovering. Asset market volatility in the final weeks of the year was one of the main catalysts behind the recovery in gold positioning. The S&P 500 lost 14% and Brent oil fell by 35% in the final quarter of 2018. Moreover, the volatility of both benchmarks has risen substantially.
A government shutdown in the US acted as a jolt to investors to remind them that the world’s engine of growth (at least in recent times) is not invincible. Meanwhile concerns around China’s slowing growth rate also led investors to become less optimistic about cyclical assets.
Fed to continue to tighten policy
We expect the Federal Reserve (Fed) to raise rates twice in 2019 (50 basis points), in line with the dot-plots in the central bank’s recent economic forecasts . That’s also in line with consensus forecasts by economists, however, Fed fund futures are not pricing in any rate increases for 2019. We side with the Fed’s guidance as we believe that economic data from the country is strong enough and labour markets are tight enough for the central bank to continue to raise rates. However, we acknowledge the risk to rates is on the downside – which in general should play to the upside for gold prices.
US Treasury bond yield curve to invert
Although we expect a total of 50 basis points increase in policy rates by Q4 2019, we think that 10-year bond yields will only increase around 25 basis points to 3.0% in that time horizon. 2-year bond yields are likely to capture more of the gains in policy rates, but further out in the curve, we are likely to see less yield increases. That’s because the Fed’s holding of a large stock of bonds is likely to hold yields back from rising too aggressively. Also, recent tax cuts are likely to have the most impact in the very short term. As the growth impact peters out over longer horizons, the uplift to yields at the longer end of the curve will be less than at the short end. Although many people see yield curve inversion as a financial signal of impending economic downturn, we believe that an inversion can occur for the less benign reasons outlined above and so it is not necessarily a precursor to an economic recession. If anything, we believe the Fed will err on the side of dovishness, as it will be reluctant to drive policy too far from other central banks. In fact, Fed fund futures indicate that the market thinks that the Fed will stop raising rates altogether this year. That could prove to be supportive for gold prices over the course of 2019.
Figure 2: Nominal US 10 year Bond Yields forecast
Source: WisdomTree Model Forecasts, Bloomberg Historical Data, data available as of close 31 December 2018. Forecasts are not an indicator of future performance and any investments are subject to risks and uncertainties.
US Dollar appreciation to be short-lived
While the Fed remains the only major central bank raising interest rates over in the first half of the year, we expect the US Dollar to continue to appreciate, especially as judging by Fed fund futures, the market is currently not expecting further tightening. However, as other major central banks – the European Central Bank, Bank of Japan, Bank of England for example start to think about policy normalisation, we could see interest rate differentials narrow and the US Dollar weaken. Additionally, with growing indebtedness in the US – exacerbated by recent tax cuts – we expect a depreciation in the US Dollar.
Figure 3: US Dollar Exchange Rate Forecast
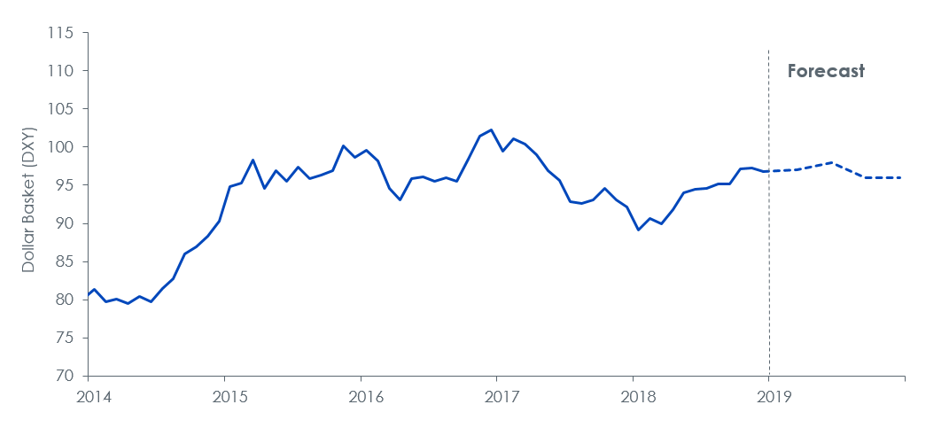
Source: WisdomTree Model Forecasts, Bloomberg Historical Data, data available as of close 31 December 2018. Forecasts are not an indicator of future performance and any investments are subject to risks and uncertainties.
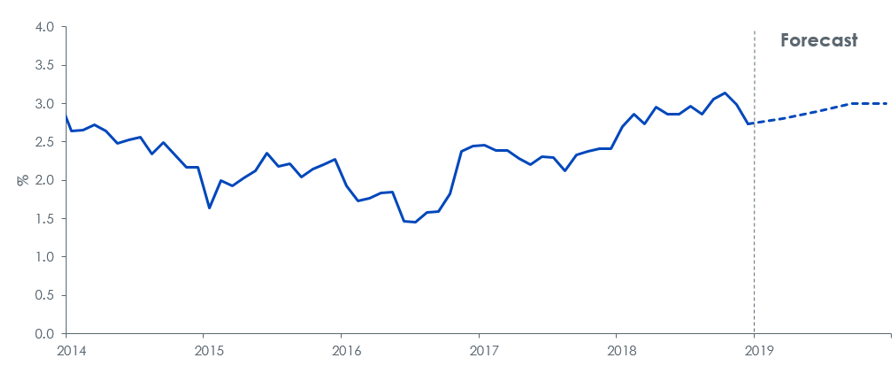
Inflationary pressures to persist, but remain contained by Fed’s policy
US consumer price index (CPI) inflation peaked at 2.9% in July 2018 and declined to 2.2% in November 2018. Volatile energy prices were responsible for a large part of the rise and decline. We expect the Fed’s policy tightening to continue to keep demand-driven inflation in check, but a recovery in oil prices will likely place upward pressure on inflation at the headline level. We expect a small increase in inflation to 2.3% by year-end.
Figure 4: Consumer Price Index inflation forecast
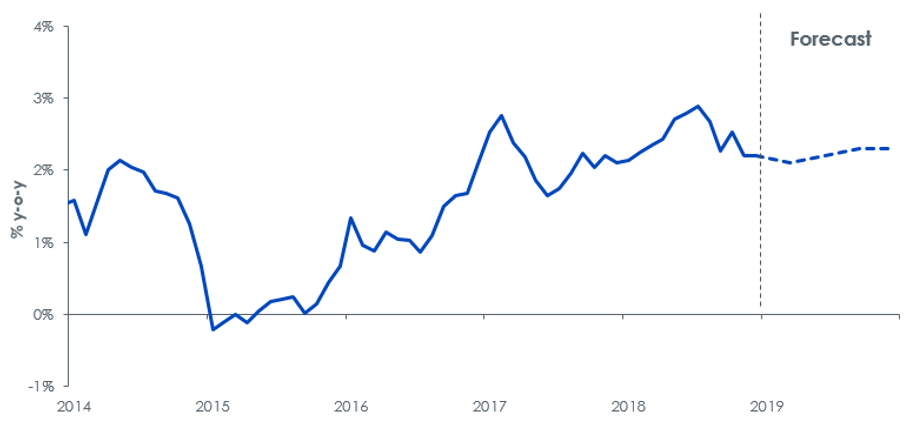
Source: WisdomTree Model Forecasts, Bloomberg Historical Data, data available as of close 31 December 2018. Forecasts are not an indicator of future performance and any investments are subject to risks and uncertainties.
What will help sentiment toward gold improve?
Summarising the monetary/economic drivers of gold – small increases in interest rates, minor appreciation followed by depreciation of the US Dollar and inflation moving marginally higher – are not going to move the dial for gold in a big way. We believe that that gold prices will end the forecast period higher mainly as a result of sentiment towards gold continuing to move out of a depressed state. This process had started already in the final week of 2018 as most markets displayed excessive volatility. We have had multiple bouts of equity market volatility in 2018, but for most part developed world equities have snapped back. That does not guarantee resilience in the face of the next shock. We note that the last time speculative positioning in gold hit levels as low as they did in 2018 was in 2001 – the year when an Argentine debt crisis was brewing, and an overvalued technology sector was imploding. Gold reacted to the stress scenario but with latency. Gold prices rose 25% in 2002 (compared to 2% in 2001).
There are other risks, that could be supportive for gold as historically a safe haven asset, which could drive positioning in gold futures higher:
- No deal Brexit– The UK’s prime minister appears to have insufficient support for the terms of withdrawal from the EU that she has been responsible for negotiating. Although she survived a vote of no confidence from her own party, it clear that the proposal is detested by leave and remain MPs alike. Renegotiating the terms of withdrawal appear impossible at this stage and so it is difficult to see how either side will be appeased by the current deal. We believe the most likely outcome will be for some form of extension beyond the March 30th deadline, however, there is a risk that doesn’t happen and there would be` no withdrawal deal in place. Leaving the EU in such an uncertain manner is likely to be very disruptive for both the UK and EU. Even if there is an extension to the deadline, uncertainty will linger, which will support demand for haven assets.
- Trade-wars – Our working assumption is that rising protectionism in the US is not going to damage global economic demand. In fact, there are signs that the rift between the US and China is beginning to thaw. However, we have seen similar signs before which have been followed by a deterioration of the relationship. If tit-for-tat protectionist measures escalate, the market could be driven into a risk-off mindset.
- The US government is currently shut down as President Trump vies congress to fund his border wall with Mexico. The risk of the standoff becoming prolonged could support demand for haven assets. Indeed, even if the government reopens soon, the risk of the Trump administration continuously using the threat of shutdowns as a strategy to gain leverage over congress is likely to hurt investor confidence in cyclical assets.
In our forecast, we bring back speculative positioning in gold futures to levels consistent with what we have seen in the past five years.
Figure 5: Gold futures speculative positioning
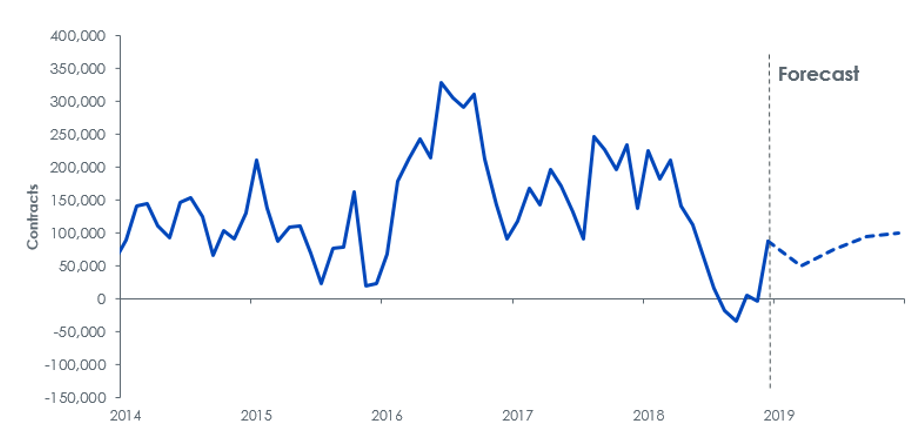
Source: WisdomTree Model Forecasts, Bloomberg Historical Data, data available as of close 31 December 2018. Forecasts are not an indicator of future performance and any investments are subject to risks and uncertainties.
Combining the monetary, economic and sentiment driven factors affecting gold, we believe gold will reach close to US$1370/oz by the end of this year.
Alternative scenarios
We have also developed alternative scenarios for gold as summarised below. Most of the sensitivity comes from our measure of sentiment, speculative positioning. But even in our bear case, we increase positioning into positive territory. In our bull case scenario, we assume the Fed will allow the economy to run hot, only raising rates once, which will put less pressure on bond yields to rise, aid US Dollar depreciation and keep inflation elevated at 2.9%. In the bear case, conversely, we assume the Fed acts more hawkishly and has more impact on the longer bond yields. The US Dollar appreciates as the Fed surprises the market with its hawkishness.
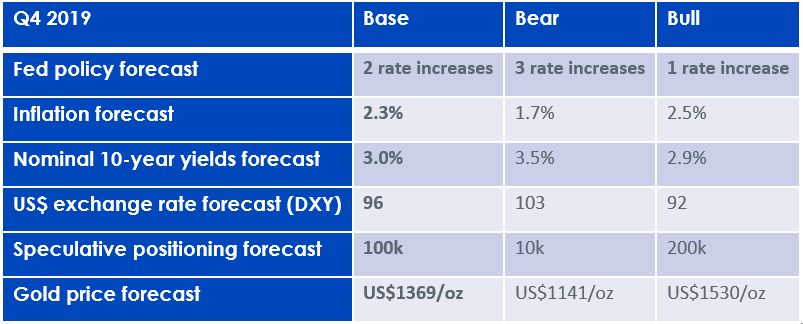
Source: WisdomTree Model Forecasts, Bloomberg Historical Data, data available as of close 31 December 2018. Forecasts are not an indicator of future performance and any investments are subject to risks and uncertainties.
Conclusion
In our base case scenario, we expect gold prices to rise close to US$1370/oz by Q4 2019, mainly as a result of speculative positioning in the futures market being restored. Some US Dollar depreciation and small gains in inflation will also aid gold’s rise.


Rebounding along with most markets. But concerns over solidity of Gaza peace may also contribute. Brent crude fell 0.8% yesterday to $61.91/b and its lowest close since May this year. This morning it is bouncing up 0.9% to $62.5/b along with a softer USD amid positive sentiment with both equities and industrial metals moving higher. Concerns that the peace in Gaza may be less solid than what one might hope for also yields some support to Brent. Bets on tech stocks are rebounding, defying fears of trade war. Money moving back into markets. Gold continues upwards its strong trend and a softer dollar helps it higher today as well.

US crude & products probably rose 5.6 mb last week (API) versus a normal seasonal decline of 2.4 mb. The US API last night partial and thus indicative data for US oil inventories. Their data indicates that US crude stocks rose 7.4 mb last week, gasoline stocks rose 3.0 mb while Distillate stocks fell 4.8 mb. Altogether an increase in commercial crude and product stocks of 5.6 mb. Commercial US crude and product stocks normally decline by 2.4 mb this time of year. So seasonally adjusted the US inventories rose 8 mb last week according to the indicative numbers by the API. That is a lot. Also, the counter seasonal trend of rising stocks versus normally declining stocks this time of year looks on a solid pace of continuation. If the API is correct then total US crude and product stocks would stand 41 mb higher than one year ago and 6 mb higher than the 2015-19 average. And if we combine this with our knowledge of a sharp increase in production and exports by OPEC(+) and a large increase in oil at sea, then the current trend in US oil inventories looks set to continue. So higher stocks and lower crude oil prices until OPEC(+) switch to cuts. Actual US oil inventory data today at 18:00 CET.
US commercial crude and product stocks rising to 1293 mb in week 41 if last nights indicative numbers from API are correct.

Crude oil soon coming to a port near you. OPEC has lifted production sharply higher this autumn. At the same time demand for oil in the Middle-East has fallen as we have moved out of summer heat and crude oil burn for power for air-conditioning. The Middle-East oil producers have thus been able to lift exports higher on both accounts. Crude oil and condensates on water has shot up by 177 mb since mid-August. This oil is now on its way to ports around the world. And when they arrive, it will likely help to lift stocks onshore higher. That is probably when we will lose the last bit of front-end backwardation the the crude oil curves. That will help to drive the front-month Brent crude oil price down to the $60/b line and revisit the high $50ies/b. Then the eyes will be all back on OPEC+ when they meet in early November and then again in early December.
Crude oil and condensates at sea have moved straight up by 177 mb since mid-August as OPEC(+) has produced more, consumed less and exported more.

When it starts to move lower it moves rather quickly. Gaza, China, IEA. Brent crude is down 2.1% today to $62/b after having traded as high as $66.58/b last Thursday and above $70/b in late September. The sell-off follows the truce/peace in Gaze, a flareup in US-China trade and yet another bearish oil outlook from the IEA.
A lasting peace in Gaze could drive crude oil at sea to onshore stocks. A lasting peace in Gaza would probably calm down the Houthis and thus allow more normal shipments of crude oil to sail through the Suez Canal, the Red Sea and out through the Bab-el-Mandeb Strait. Crude oil at sea has risen from 48 mb in April to now 91 mb versus a pre-Covid normal of about 50-60 mb. The rise to 91 mb is probably the result of crude sailing around Africa to be shot to pieces by the Houthis. If sailings were to normalize through the Suez Canal, then it could free up some 40 mb in transit at sea moving onshore into stocks.
The US-China trade conflict is of course bearish for demand if it continues.
Bearish IEA yet again. Getting closer to 2026. Credibility rises. We expect OPEC to cut end of 2025. The bearish monthly report from the IEA is what it is, but the closer we get to 2026, the more likely the IEA is of being ball-park right in its outlook. In its monthly report today the IEA estimates that the need for crude oil from OPEC in 2026 will be 25.4 mb/d versus production by the group in September of 29.1 mb/d. The group thus needs to do some serious cutting at the end of 2025 if it wants to keep the market balanced and avoid inventories from skyrocketing. Given that IEA is correct that is. We do however expect OPEC to implement cuts to avoid a large increase in inventories in Q1-26. The group will probably revert to cuts either at its early December meeting when they discuss production for January or in early January when they discuss production for February. The oil price will likely head yet lower until the group reverts to cuts.
Dubai: The Mid-East anchor dragging crude oil lower. Surplus emerging in Mid-East pricing. Crude oil prices held surprisingly strong all through the summer. A sign and a key source of that strength came from the strength in the front-end backwardation of the Dubai crude oil curve. It held out strong from mid-June and all until late September with an average 1-3mth time-spread premium of $1.8/b from mid-June to end of September. The 1-3mth time-spreads for Brent and WTI however were in steady deterioration from late June while their flat prices probably were held up by the strength coming from the Persian Gulf. Then in late September the strength in the Dubai curve suddenly collapsed. Since the start of October it has been weaker than both the Brent and the WTI curves. The Dubai 1-3mth time-spread now only stands at $0.25/b. The Middle East is now exporting more as it is producing more and also consuming less following elevated summer crude burn for power (Aircon) etc.
The only bear-element missing is a sudden and solid rise in OECD stocks. The only thing that is missing for the bear-case everyone have been waiting for is a solid, visible rise in OECD stocks in general and US oil stocks specifically. So watch out for US API indications tomorrow and official US oil inventories on Thursday.
No sign of any kind of fire-sale of oil from Saudi Arabia yet. To what we can see, Saudi Arabia is not at all struggling to sell its oil. It only lowered its Official Selling Prices (OSPs) to Asia marginally for November. A surplus market + Saudi determination to sell its oil to the market would normally lead to a sharp lowering of Saudi OSPs to Asia. Not yet at least and not for November.
The 5yr contract close to fixed at $68/b. Of importance with respect to how far down oil can/will go. When the oil market moves into a surplus then the spot price starts to trade in a large discount to the 5yr contract. Typically $10-15/b below the 5yr contract on average in bear-years (2009, 2015, 2016, 2020). But the 5yr contract is usually pulled lower as well thus making this approach a moving target. But the 5yr contract price has now been rock solidly been pegged to $68/b since 2022. And in the 2022 bull-year (Brent spot average $99/b), the 5yr contract only went to $72/b on average. If we assume that the same goes for the downside and that 2026 is a bear-year then the 5yr goes to $64/b while the spot is trading at a $10-15/b discount to that. That would imply an average spot price next year of $49-54/b. But that is if OPEC doesn’t revert to cuts and instead keeps production flowing. We think OPEC(+) will trim/cut production as needed into 2026 to prevent a huge build-up in global oil stocks and a crash in prices. But for now we are still heading lower. Into the $50ies/b.
Some rebound but not much. Brent crude rebounded 1.5% yesterday to $65.47/b. This morning it is inching 0.2% up to $65.6/b. The lowest close last week was on Thursday at $64.11/b.
The curve structure is almost as week as it was before the weekend. The rebound we now have gotten post the message from OPEC+ over the weekend is to a large degree a rebound along the curve rather than much strengthening at the front-end of the curve. That part of the curve structure is almost as weak as it was last Thursday.
We are still on a weakening path. The message from OPEC+ over the weekend was we are still on a weakening path with rising supply from the group. It is just not as rapidly weakening as was feared ahead of the weekend when a quota hike of 500 kb/d/mth for November was discussed.
The Brent curve is on its way to full contango with Brent dipping into the $50ies/b. Thus the ongoing weakening we have had in the crude curve since the start of the year, and especially since early June, will continue until the Brent crude oil forward curve is in full contango along with visibly rising US and OECD oil inventories. The front-month Brent contract will then flip down towards the $60/b-line and below into the $50ies/b.
At what point will OPEC+ turn to cuts? The big question then becomes: When will OPEC+ turn around to make some cuts? At what (price) point will they choose to stabilize the market? Because for sure they will. Higher oil inventories, some more shedding of drilling rigs in US shale and Brent into the 50ies somewhere is probably where the group will step in.
There is nothing we have seen from the group so far which indicates that they will close their eyes, let the world drown in oil and the oil price crash to $40/b or below.
The message from OPEC+ is also about balance and stability. The world won’t drown in oil in 2026. The message from the group as far as we manage to interpret it is twofold: 1) Taking back market share which requires a lower price for non-OPEC+ to back off a bit, and 2) Oil market stability and balance. It is not just about 1. Thus fretting about how we are all going to drown in oil in 2026 is totally off the mark by just focusing on point 1.
When to buy cal 2026? Before Christmas when Brent hits $55/b and before OPEC+ holds its last meeting of the year which is likely to be in early December.
Brent crude oil prices have rebounded a bit along the forward curve. Not much strengthening in the structure of the curve. The front-end backwardation is not much stronger today than on its weakest level so far this year which was on Thursday last week.

The front-end backwardation fell to its weakest level so far this year on Thursday last week. A slight pickup yesterday and today, but still very close to the weakest year to date. More oil from OPEC+ in the coming months and softer demand and rising inventories. We are heading for yet softer levels.


Vad guldets uppgång egentligen betyder för världen

Spotpriset på guld över 4300 USD och silver över 54 USD
Crude oil soon coming to a port near you

Guld och silver stiger hela tiden mot nya höjder
The Mid-East anchor dragging crude oil lower

OPEC+ missar produktionsmål, stöder oljepriserna

Ett samtal om guld, olja, fjärrvärme och förnybar energi

Goldman Sachs höjer prognosen för guld, tror priset når 4900 USD
Guld nära 4000 USD och silver 50 USD, därför kan de fortsätta stiga
Are Ukraine’s attacks on Russian energy infrastructure working?
-
 Nyheter3 veckor sedan
OPEC+ missar produktionsmål, stöder oljepriserna
-
 Nyheter4 veckor sedan
Ett samtal om guld, olja, fjärrvärme och förnybar energi
-
 Nyheter2 veckor sedan
Goldman Sachs höjer prognosen för guld, tror priset når 4900 USD
-
 Nyheter2 veckor sedan
Guld nära 4000 USD och silver 50 USD, därför kan de fortsätta stiga
-
Analys4 veckor sedan
Are Ukraine’s attacks on Russian energy infrastructure working?
-

 Nyheter3 veckor sedan
Blykalla och amerikanska Oklo inleder ett samarbete
-

 Nyheter4 veckor sedan
Guldpriset uppe på nya höjder, nu 3750 USD
-
Nyheter3 veckor sedan
Ett samtal om guld, olja, koppar och stål