

Analys
German solar power prices are collapsing as market hits solar saturation

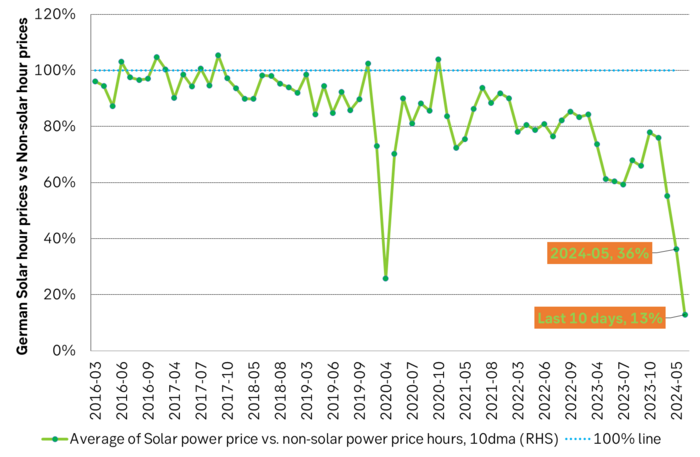
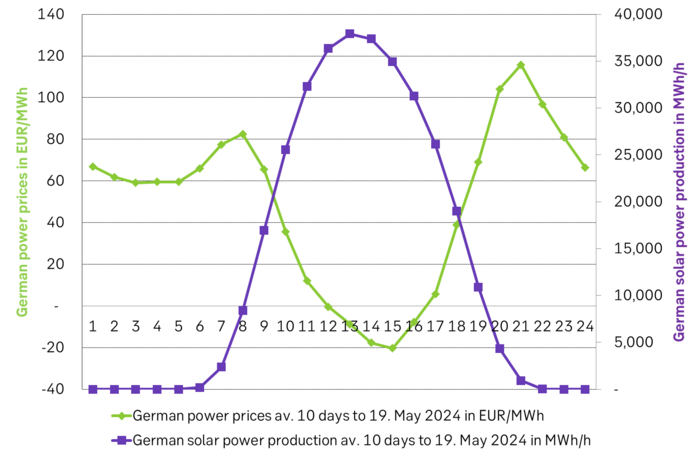
German solar power producers got a price haircut of 87% over the past 10 days. German solar power producers have over the past 10 days received a volume weighted power price of only EUR 9.1/MWh. The average power price during non-solar-power-hours was in comparison EUR 70.6/MWh. Solar power producers thus got an 87% cut in the power price they get when they produce vs. the power price during non-solar-power-hours. This is what happens to power prices when the volume of unregulated power becomes equally big or bigger than demand: Prices collapse when unregulated power produces the most.

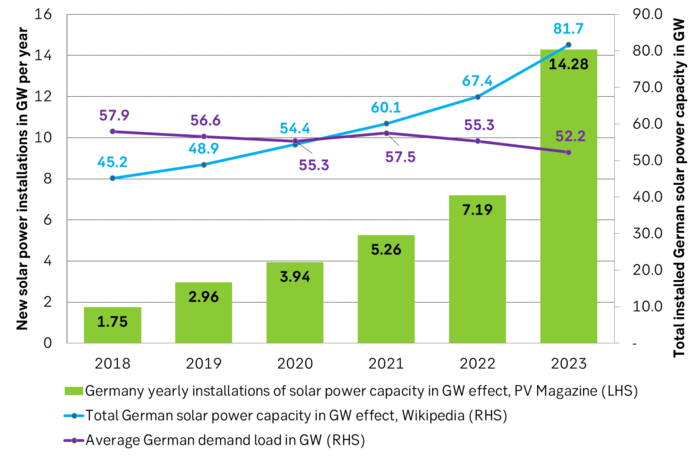
Massive growth in solar power installations in Germany in 2023 is leading to destruction of solar hour prices and solar profitability. Germany installed a record 14,280 MW of solar power capacity According to ’PV Magazine International’. That is close to twice as much as in 2022. Total installed solar capacity reached 81.7 GW at the end of 2023 according to ’Renewables Now’. Average German demand load was in comparison 52.2 GW. So total solar capacity reached almost 30 GW above average demand. Solar power produces the most during summer when demand is lower. The overshoot is thus much larger than the 30 GW mentioned when it matters.
The collapse in solar-hour-power-prices implies a collapse in solar power producer earnings unless the earnings of the installations are secured with subsidies or by PPAs. It also means that there is a sharp reduction in the earnings potential for new solar power projects. The exponential growth in new installations of solar capacity we have seen to date is likely to come to an abrupt halt. There is however most likely still a large range of solar power projects under construction in Germany which will be finalized before growth in new capacity comes to a halt. The problem of solar power production curbs (you are not allowed to produce at all) and solar power price destruction is likely to escalate yet higher before new growth in supply comes to a halt.
Focus will now shift from solar production capacity growth to grid improvements, batteries and adaptive demand. All consumers are of course happy for cheap power as long as they are able to consume it when it is cheap. At the moment they can’t. But the incentive to be inventive is now super high. The focus will now likely shift from solar power production growth to grids, batteries, adaptive demand and all possible ways to utilize ”free power”. This will over time exhaust the availability of ”free power” and drive solar-hour-power-prices back up. This again will then eventually open for renewed growth in solar power capacity growth.
It is probably much worse down in the grid. What is worth noting is that these numbers are for all of Germany average. Solar power congestion is much worse in the local grids all around Germany along with local grid capacity constraints ect.
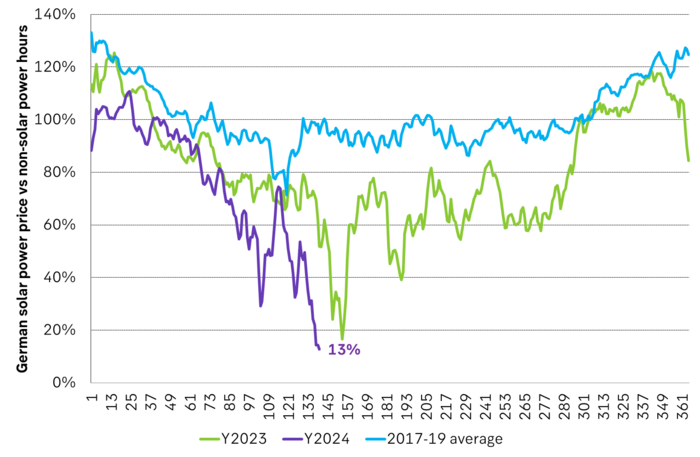
The problem of solar power is high concentration of production: 80% of German solar production was produced during 22.3% of the hours in the year in 2023. What is also worth mentioning is that solar power production is extremely concentrated in relatively few hours per year. It produces in the middle of the day and during summer. In 2023 German solar power produced 80% of its production in only 22.3% of the hours of the year. This basically implies that once solar power production reaches 22.3% of total power supply (without batteries), then solar-hour-power-prices will likely collapse. Solar power production reached 55 TWh in 2023. That’s a lot but it is still only 12% of total demand of 458 TWh in 2023. What it means is that the acute problem of solar-hour-power-price-destruction sets in much before the ”theoretical 22.3%” mentioned above.
On the 21 Feb 2024 we wrote the following note on this issue: ”The self-destructive force of unregulated solar power” where we highlighted these issues and warned that this will likely be a process of ”First gradually. Then suddenly”.
German solar power capacity makes a big leap upwards in 2023 as the energy crisis hurt everybody. Demand went down. Now there is a large overcapacity in installed solar effect vs. demand load.
German solar power producers got an 87% price haircut on average during last 10 days vs. those who produced during non-solar-power hours.
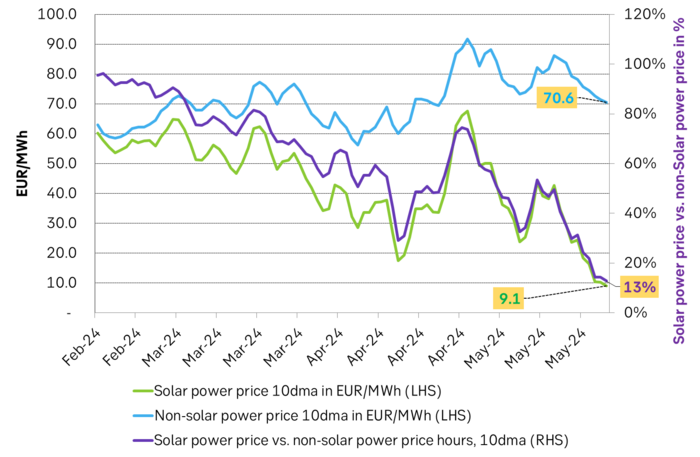
Volume weighted solar power prices vs. non-solar-hours. Bigger and bigger discount.
Volume weighted solar power prices vs. non-solar-hours. Bigger and bigger discount.
Solar power production and German power prices over the past 10 days.
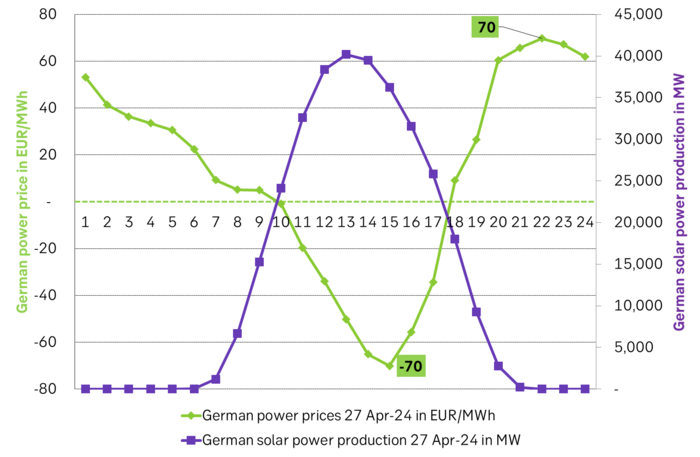
Solar power production and German power prices on 27 April 2024.
The latest weekly report from the US DOE showed a substantial drawdown across key petroleum categories, adding more upside potential to the fundamental picture.

Commercial crude inventories (excl. SPR) fell by 5.8 million barrels, bringing total inventories down to 415.1 million barrels. Now sitting 11% below the five-year seasonal norm and placed in the lowest 2015-2022 range (see picture below).
Product inventories also tightened further last week. Gasoline inventories declined by 2.1 million barrels, with reductions seen in both finished gasoline and blending components. Current gasoline levels are about 3% below the five-year average for this time of year.
Among products, the most notable move came in diesel, where inventories dropped by almost 4.1 million barrels, deepening the deficit to around 20% below seasonal norms – continuing to underscore the persistent supply tightness in diesel markets.
The only area of inventory growth was in propane/propylene, which posted a significant 5.1-million-barrel build and now stands 9% above the five-year average.
Total commercial petroleum inventories (crude plus refined products) declined by 4.2 million barrels on the week, reinforcing the overall tightening of US crude and products.


A classic case of “buy the rumor, sell the news” played out in oil markets, as Brent crude has dropped sharply – down nearly USD 10 per barrel since yesterday evening – following Iran’s retaliatory strike on a U.S. air base in Qatar. The immediate reaction was: “That was it?” The strike followed a carefully calibrated, non-escalatory playbook, avoiding direct threats to energy infrastructure or disruption of shipping through the Strait of Hormuz – thus calming worst-case fears.
After Monday morning’s sharp spike to USD 81.4 per barrel, triggered by the U.S. bombing of Iranian nuclear facilities, oil prices drifted sideways in anticipation of a potential Iranian response. That response came with advance warning and caused limited physical damage. Early this morning, both the U.S. President and Iranian state media announced a ceasefire, effectively placing a lid on the immediate conflict risk – at least for now.
As a result, Brent crude has now fallen by a total of USD 12 from Monday’s peak, currently trading around USD 69 per barrel.
Looking beyond geopolitics, the market will now shift its focus to the upcoming OPEC+ meeting in early July. Saudi Arabia’s decision to increase output earlier this year – despite falling prices – has drawn renewed attention considering recent developments. Some suggest this was a response to U.S. pressure to offset potential Iranian supply losses.
However, consensus is that the move was driven more by internal OPEC+ dynamics. After years of curbing production to support prices, Riyadh had grown frustrated with quota-busting by several members (notably Kazakhstan). With Saudi Arabia cutting up to 2 million barrels per day – roughly 2% of global supply – returns were diminishing, and the risk of losing market share was rising. The production increase is widely seen as an effort to reassert leadership and restore discipline within the group.
That said, the FT recently stated that, the Saudis remain wary of past missteps. In 2018, Riyadh ramped up output at Trump’s request ahead of Iran sanctions, only to see prices collapse when the U.S. granted broad waivers – triggering oversupply. Officials have reportedly made it clear they don’t intend to repeat that mistake.
The recent visit by President Trump to Saudi Arabia, which included agreements on AI, defense, and nuclear cooperation, suggests a broader strategic alignment. This has fueled speculation about a quiet “pump-for-politics” deal behind recent production moves.
Looking ahead, oil prices have now retraced the entire rally sparked by the June 13 Israel–Iran escalation. This retreat provides more political and policy space for both the U.S. and Saudi Arabia. Specifically, it makes it easier for Riyadh to scale back its three recent production hikes of 411,000 barrels each, potentially returning to more moderate increases of 137,000 barrels for August and September.
In short: with no major loss of Iranian supply to the market, OPEC+ – led by Saudi Arabia – no longer needs to compensate for a disruption that hasn’t materialized, especially not to please the U.S. at the cost of its own market strategy. As the Saudis themselves have signaled, they are unlikely to repeat previous mistakes.
Conclusion: With Brent now in the high USD 60s, buying oil looks fundamentally justified. The geopolitical premium has deflated, but tensions between Israel and Iran remain unresolved – and the risk of missteps and renewed escalation still lingers. In fact, even this morning, reports have emerged of renewed missile fire despite the declared “truce.” The path forward may be calmer – but it is far from stable.
Analys
A muted price reaction. Market looks relaxed, but it is still on edge waiting for what Iran will do
Brent crossed the 80-line this morning but quickly fell back assigning limited probability for Iran choosing to close the Strait of Hormuz. Brent traded in a range of USD 70.56 – 79.04/b last week as the market fluctuated between ”Iran wants a deal” and ”US is about to attack Iran”. At the end of the week though, Donald Trump managed to convince markets (and probably also Iran) that he would make a decision within two weeks. I.e. no imminent attack. Previously when when he has talked about ”making a decision within two weeks” he has often ended up doing nothing in the end. The oil market relaxed as a result and the week ended at USD 77.01/b which is just USD 6/b above the year to date average of USD 71/b.
Brent jumped to USD 81.4/b this morning, the highest since mid-January, but then quickly fell back to a current price of USD 78.2/b which is only up 1.5% versus the close on Friday. As such the market is pricing a fairly low probability that Iran will actually close the Strait of Hormuz. Probably because it will hurt Iranian oil exports as well as the global oil market.
It was however all smoke and mirrors. Deception. The US attacked Iran on Saturday. The attack involved 125 warplanes, submarines and surface warships and 14 bunker buster bombs were dropped on Iranian nuclear sites including Fordow, Natanz and Isfahan. In response the Iranian Parliament voted in support of closing the Strait of Hormuz where some 17 mb of crude and products is transported to the global market every day plus significant volumes of LNG. This is however merely an advise to the Supreme leader Ayatollah Ali Khamenei and the Supreme National Security Council which sits with the final and actual decision.
No supply of oil is lost yet. It is about the risk of Iran closing the Strait of Hormuz or not. So far not a single drop of oil supply has been lost to the global market. The price at the moment is all about the assessed risk of loss of supply. Will Iran choose to choke of the Strait of Hormuz or not? That is the big question. It would be painful for US consumers, for Donald Trump’s voter base, for the global economy but also for Iran and its population which relies on oil exports and income from selling oil out of that Strait as well. As such it is not a no-brainer choice for Iran to close the Strait for oil exports. And looking at the il price this morning it is clear that the oil market doesn’t assign a very high probability of it happening. It is however probably well within the capability of Iran to close the Strait off with rockets, mines, air-drones and possibly sea-drones. Just look at how Ukraine has been able to control and damage the Russian Black Sea fleet.
What to do about the highly enriched uranium which has gone missing? While the US and Israel can celebrate their destruction of Iranian nuclear facilities they are also scratching their heads over what to do with the lost Iranian nuclear material. Iran had 408 kg of highly enriched uranium (IAEA). Almost weapons grade. Enough for some 10 nuclear warheads. It seems to have been transported out of Fordow before the attack this weekend.
The market is still on edge. USD 80-something/b seems sensible while we wait. The oil market reaction to this weekend’s events is very muted so far. The market is still on edge awaiting what Iran will do. Because Iran will do something. But what and when? An oil price of 80-something seems like a sensible level until something do happen.


Eurobattery Minerals förvärvar majoritet i spansk volframgruva

USA ska införa 50 procent tull på koppar

Ryska staten siktar på att konfiskera en av landets största guldproducenter

Hur säkrar vi Sveriges tillgång till kritiska metaller och mineral i en ny geopolitisk verklighet?

Lundin Mining ska bli en av de tio största kopparproducenterna i världen

Mahvie Minerals växlar spår – satsar fullt ut på guld

Uppgången i oljepriset planade ut under helgen

Låga elpriser i sommar – men mellersta Sverige får en ökning
A muted price reaction. Market looks relaxed, but it is still on edge waiting for what Iran will do

Jonas Lindvall är tillbaka med ett nytt oljebolag, Perthro, som ska börsnoteras
-
 Nyheter3 veckor sedan
Mahvie Minerals växlar spår – satsar fullt ut på guld
-
 Nyheter4 veckor sedan
Uppgången i oljepriset planade ut under helgen
-
 Nyheter4 veckor sedan
Låga elpriser i sommar – men mellersta Sverige får en ökning
-
Analys3 veckor sedan
A muted price reaction. Market looks relaxed, but it is still on edge waiting for what Iran will do
-
 Nyheter3 veckor sedan
Jonas Lindvall är tillbaka med ett nytt oljebolag, Perthro, som ska börsnoteras
-

 Nyheter3 veckor sedan
Oljan, guldet och marknadens oroande tystnad
-
Analys4 veckor sedan
Very relaxed at USD 75/b. Risk barometer will likely fluctuate to higher levels with Brent into the 80ies or higher coming 2-3 weeks
-

 Nyheter3 veckor sedan
Domstolen ger klartecken till Lappland Guldprospektering