

Analys
Dollar Weakness Helps Gold To All-Time Highs
Gold Passes Two Important Sign-Posts

The gold bull market passed two important sign-posts in July. The strength of the market is impressive as it blew through $1,800 and the all-time high of $1,921. These prices had been major technical resistance points set a decade ago.
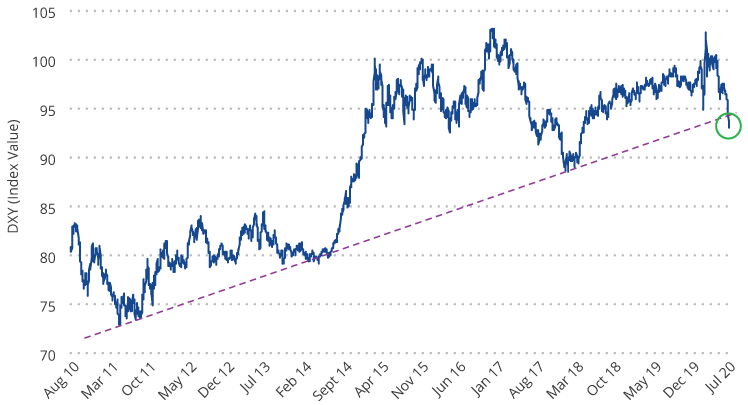
The second significant signpost in July was the new U.S. dollar weakness. U.S. dollar weakness is a hallmark of most gold bull markets, but in this cycle gold had so far been rising in a flat dollar environment. The chart below shows the U.S. dollar index (DXY)1 has been in a bull market since 2011. However, the dollar declined through July, then fell precipitously at the end of the month, appearing to have broken its long-term trend. We may be seeing the beginnings of a bear market for the dollar. This enabled gold to test the $2,000 per ounce milestone as it reached an intraday high of $1,983 on July 31. Gold closed out July at $1,975.86 per ounce for a $194.90 (10.9%) monthly gain.
U.S. Dollar Index Breaking Its Near 10-Year Support Trend (2011 to 2020)?
Gold Miners Remain Well Positioned (Especially Junior Developers)
Gold stocks moved higher as the vast majority of companies reporting second quarter results met or exceeded expectations. COVID-related costs were also reported, showing the industry has done an excellent job of dealing with operational issues in our view. For example, 1.7 million ounce producer Agnico-Eagle (approximately net assets of 4.7% as of end-July) was among those hardest hit by pandemic lock downs. Its costs for temporary mine suspensions totaled $22 million, whereas the cash provided from operations totaled $162 million. Going forward, per the company’s second quarter 2020 financial results, Agnico-Eagle expects COVID protocols to cost $6 per ounce, which raises their cash costs by less than 1%. For the month, the NYSE Gold Miners Index (GDMNTR)2 gained 14.4%, while the MVIS Global Junior Gold Miners Index (MVGDXJTR)3 advanced 19.8%.
Junior developers are a class of company that you won’t find much of in passive index funds. These are companies with properties that are in various stages of development, but not yet producing gold. Our active gold equity strategy invests across the spectrum of companies and currently carries 22 junior developers that total approximately 26% of the strategy’s net assets as of end-July. These companies had been underperforming since the gold price broke out in June 2019. This is a sharp contrast from past bull markets, when the juniors began outperforming the larger companies much earlier. Through the second quarter and into July, the junior developers have finally kicked into gear. Seven of our juniors have now gained over 100% year to date. We don’t expect to give back these gains because the stocks had been extremely undervalued and many of our companies have announced encouraging drill results and new discoveries that create lasting value. In addition, investors have returned to the junior sector, enabling companies to raise $1.5 billion this year, and the second quarter was their strongest for equity raises since 2012, according to RBC Capital Markets.
$2,000 Gold Is About More Than Just The Pandemic
Gold has tested the $2,000 per ounce level sooner than we had anticipated and we believe there is more than the pandemic to overcome at this point.
- Slower Recovery – During July, two Federal Reserve (Fed) presidents, a Fed governor, and its Chairman all warned of a long, slow road to economic recovery. Initial jobless claims have stagnated for eight weeks at around 1.4 to 1.5 million. Contrast this with the Global Financial Crisis (GFC), where initial jobless claims declined steadily to 587,000 in the same time frame, seventeen weeks after the recession peak. JPMorgan said it was preparing for an unemployment rate that remains in double digits well into next year and a slower recovery in gross domestic product (GDP) than the bank’s economists assumed three months ago.
- Deficits, Debt & Defaults – The U.S. budget deficit totaled $863 billion in June, as much as the entire gap in 2019. With the new stimulus bill now being considered in Congress, the annual deficit could exceed $4.7 trillion. This is on top of record peace-time deficits before the pandemic.
Corporate debt is also at record levels and many households are feeling financial stress. Ultra low interest rates over the past two decades have encouraged the accumulation of unproductive government and private debt. It fuels the rise of giant firms, while “zombie” companies (companies with earnings less than their debt service costs) have proliferated. This is at the expense of start-ups, innovation and creative destruction. The result is low levels of productivity, causing recoveries to become weaker and weaker. The Wall Street Journal reports the largest U.S. banks have set aside $28 billion to cover losses as consumers and businesses start to default on their loans.
What Could Drive Gold Prices Even Higher?
The pandemic created a deflationary shock to the economy and the massive accumulation of debt since the GFC creates a drag on productivity that could guarantee a low growth economy for decades to come. Negative real rates, persistent risks to economic well-being, and the weak dollar are drivers that we believe could enable gold to trend to $3,400 per ounce in the coming years. This might be a conservative forecast considering the 180% rise gold experienced from the depths of the GFC. Several scenarios could see gold prices moving higher from there:
- Systemic collapse as debt issuance overwhelms the financial markets.
- An inflationary cycle brought on by either: a) trillions of U.S. dollars, euros, yen and yuan being pumped into the global financial system, b) governments enabling inflation to ease the debt burden, c) implementation of modern monetary theory or other forms of money printing to fund government spending without issuing debt.
- U.S. Dollar Crisis – America is dealing with deficits, divisive politics, social unrest and deteriorating international relations on a scale rarely seen in history. While other countries may have similar problems, they do not oversee the world’s reserve currency. The U.S. is held to a higher standard and a crisis of confidence could weigh heavily on the dollar.
Some might balk at such bold forecasts, however, we believe the various drivers of gold are rarely aligned as they are today. We also consider gold’s relative size in the financial markets. There have been 200,000 tonnes of gold mined in the history of the world and virtually all of it is potentially available to the market. A gold price of $2,000 per ounce yields a market value of $12.9 trillion. Compare this with global stock, bond and currency markets, each of which totals roughly $100 trillion or more. A relatively small shift in funds from these markets may fuel the gold price for a long time.
In addition, the market value of the global gold industry as of end-July is approximately $530 billion. The market value of Alphabet Inc. as of the same time, alone, is $1.0 trillion. Gold mining is a relatively tiny sector that, in addition to carrying earnings leverage to the gold price, carries a scarcity factor when market demand is high.
1U.S. Dollar Index (DXY) indicates the general international value of the U.S. dollar by averaging the exchange rates between the U.S. dollar and six major world currencies.
2NYSE Arca Gold Miners Index (GDMNTR) is a modified market capitalization-weighted index comprised of publicly traded companies involved primarily in the mining for gold.
3MVIS Global Junior Gold Miners Index (MVGDXJTR) is a rules-based, modified market capitalization-weighted, float-adjusted index comprised of a global universe of publicly traded small- and medium-capitalization companies that generate at least 50% of their revenues from gold and/or silver mining, hold real property that has the potential to produce at least 50% of the company’s revenue from gold or silver mining when developed, or primarily invest in gold or silver.
Joe Foster, Portfolio Manager/Strategist, VanEck
This commentary originates from VanEck Investments Ltd, a UCITS Management Company under Irish law regulated by the Central Bank of Ireland and VanEck Asset Management B.V., a UCITS Management Company under Dutch law regulated by the Netherlands Authority for the Financial Markets. It is intended only to provide general and preliminary information to investors and shall not be construed as investment, legal or tax advice. VanEck Investments Ltd, VanEck Asset Management B.V. and its associated and affiliated companies (together “VanEck”) assume no liability with regards to any investment, divestment or retention decision taken by the investor on the basis of this commentary. The views and opinions expressed are those of the author(s) but not necessarily those of VanEck. Opinions are current as of the commentary’s publication date and are subject to change with market conditions. Certain statements contained herein may constitute projections, forecasts and other forward looking statements, which do not reflect actual results. Information provided by third party sources are believed to be reliable and have not been independently verified for accuracy or completeness and cannot be guaranteed. All indices mentioned are measures of common market sectors and performance. It is not possible to invest directly in an index.
All performance information is historical and is no guarantee of future results. Investing is subject to risk, including the possible loss of principal. You must read the Prospectus and KIID before investing in a fund.
No part of this material may be reproduced in any form, or referred to in any other publication, without express written permission of VanEck.


The latest weekly report from the US DOE showed a substantial drawdown across key petroleum categories, adding more upside potential to the fundamental picture.

Commercial crude inventories (excl. SPR) fell by 5.8 million barrels, bringing total inventories down to 415.1 million barrels. Now sitting 11% below the five-year seasonal norm and placed in the lowest 2015-2022 range (see picture below).
Product inventories also tightened further last week. Gasoline inventories declined by 2.1 million barrels, with reductions seen in both finished gasoline and blending components. Current gasoline levels are about 3% below the five-year average for this time of year.
Among products, the most notable move came in diesel, where inventories dropped by almost 4.1 million barrels, deepening the deficit to around 20% below seasonal norms – continuing to underscore the persistent supply tightness in diesel markets.
The only area of inventory growth was in propane/propylene, which posted a significant 5.1-million-barrel build and now stands 9% above the five-year average.
Total commercial petroleum inventories (crude plus refined products) declined by 4.2 million barrels on the week, reinforcing the overall tightening of US crude and products.


A classic case of “buy the rumor, sell the news” played out in oil markets, as Brent crude has dropped sharply – down nearly USD 10 per barrel since yesterday evening – following Iran’s retaliatory strike on a U.S. air base in Qatar. The immediate reaction was: “That was it?” The strike followed a carefully calibrated, non-escalatory playbook, avoiding direct threats to energy infrastructure or disruption of shipping through the Strait of Hormuz – thus calming worst-case fears.
After Monday morning’s sharp spike to USD 81.4 per barrel, triggered by the U.S. bombing of Iranian nuclear facilities, oil prices drifted sideways in anticipation of a potential Iranian response. That response came with advance warning and caused limited physical damage. Early this morning, both the U.S. President and Iranian state media announced a ceasefire, effectively placing a lid on the immediate conflict risk – at least for now.
As a result, Brent crude has now fallen by a total of USD 12 from Monday’s peak, currently trading around USD 69 per barrel.
Looking beyond geopolitics, the market will now shift its focus to the upcoming OPEC+ meeting in early July. Saudi Arabia’s decision to increase output earlier this year – despite falling prices – has drawn renewed attention considering recent developments. Some suggest this was a response to U.S. pressure to offset potential Iranian supply losses.
However, consensus is that the move was driven more by internal OPEC+ dynamics. After years of curbing production to support prices, Riyadh had grown frustrated with quota-busting by several members (notably Kazakhstan). With Saudi Arabia cutting up to 2 million barrels per day – roughly 2% of global supply – returns were diminishing, and the risk of losing market share was rising. The production increase is widely seen as an effort to reassert leadership and restore discipline within the group.
That said, the FT recently stated that, the Saudis remain wary of past missteps. In 2018, Riyadh ramped up output at Trump’s request ahead of Iran sanctions, only to see prices collapse when the U.S. granted broad waivers – triggering oversupply. Officials have reportedly made it clear they don’t intend to repeat that mistake.
The recent visit by President Trump to Saudi Arabia, which included agreements on AI, defense, and nuclear cooperation, suggests a broader strategic alignment. This has fueled speculation about a quiet “pump-for-politics” deal behind recent production moves.
Looking ahead, oil prices have now retraced the entire rally sparked by the June 13 Israel–Iran escalation. This retreat provides more political and policy space for both the U.S. and Saudi Arabia. Specifically, it makes it easier for Riyadh to scale back its three recent production hikes of 411,000 barrels each, potentially returning to more moderate increases of 137,000 barrels for August and September.
In short: with no major loss of Iranian supply to the market, OPEC+ – led by Saudi Arabia – no longer needs to compensate for a disruption that hasn’t materialized, especially not to please the U.S. at the cost of its own market strategy. As the Saudis themselves have signaled, they are unlikely to repeat previous mistakes.
Conclusion: With Brent now in the high USD 60s, buying oil looks fundamentally justified. The geopolitical premium has deflated, but tensions between Israel and Iran remain unresolved – and the risk of missteps and renewed escalation still lingers. In fact, even this morning, reports have emerged of renewed missile fire despite the declared “truce.” The path forward may be calmer – but it is far from stable.
Analys
A muted price reaction. Market looks relaxed, but it is still on edge waiting for what Iran will do
Brent crossed the 80-line this morning but quickly fell back assigning limited probability for Iran choosing to close the Strait of Hormuz. Brent traded in a range of USD 70.56 – 79.04/b last week as the market fluctuated between ”Iran wants a deal” and ”US is about to attack Iran”. At the end of the week though, Donald Trump managed to convince markets (and probably also Iran) that he would make a decision within two weeks. I.e. no imminent attack. Previously when when he has talked about ”making a decision within two weeks” he has often ended up doing nothing in the end. The oil market relaxed as a result and the week ended at USD 77.01/b which is just USD 6/b above the year to date average of USD 71/b.

Brent jumped to USD 81.4/b this morning, the highest since mid-January, but then quickly fell back to a current price of USD 78.2/b which is only up 1.5% versus the close on Friday. As such the market is pricing a fairly low probability that Iran will actually close the Strait of Hormuz. Probably because it will hurt Iranian oil exports as well as the global oil market.
It was however all smoke and mirrors. Deception. The US attacked Iran on Saturday. The attack involved 125 warplanes, submarines and surface warships and 14 bunker buster bombs were dropped on Iranian nuclear sites including Fordow, Natanz and Isfahan. In response the Iranian Parliament voted in support of closing the Strait of Hormuz where some 17 mb of crude and products is transported to the global market every day plus significant volumes of LNG. This is however merely an advise to the Supreme leader Ayatollah Ali Khamenei and the Supreme National Security Council which sits with the final and actual decision.
No supply of oil is lost yet. It is about the risk of Iran closing the Strait of Hormuz or not. So far not a single drop of oil supply has been lost to the global market. The price at the moment is all about the assessed risk of loss of supply. Will Iran choose to choke of the Strait of Hormuz or not? That is the big question. It would be painful for US consumers, for Donald Trump’s voter base, for the global economy but also for Iran and its population which relies on oil exports and income from selling oil out of that Strait as well. As such it is not a no-brainer choice for Iran to close the Strait for oil exports. And looking at the il price this morning it is clear that the oil market doesn’t assign a very high probability of it happening. It is however probably well within the capability of Iran to close the Strait off with rockets, mines, air-drones and possibly sea-drones. Just look at how Ukraine has been able to control and damage the Russian Black Sea fleet.
What to do about the highly enriched uranium which has gone missing? While the US and Israel can celebrate their destruction of Iranian nuclear facilities they are also scratching their heads over what to do with the lost Iranian nuclear material. Iran had 408 kg of highly enriched uranium (IAEA). Almost weapons grade. Enough for some 10 nuclear warheads. It seems to have been transported out of Fordow before the attack this weekend.
The market is still on edge. USD 80-something/b seems sensible while we wait. The oil market reaction to this weekend’s events is very muted so far. The market is still on edge awaiting what Iran will do. Because Iran will do something. But what and when? An oil price of 80-something seems like a sensible level until something do happen.


Tightening fundamentals – bullish inventories from DOE

Jonas Lindvall är tillbaka med ett nytt oljebolag, Perthro, som ska börsnoteras

Oljan, guldet och marknadens oroande tystnad

Domstolen ger klartecken till Lappland Guldprospektering
Bombs to ”ceasefire” in hours – Brent below $70

Stor uppsida i Lappland Guldprospekterings aktie enligt analys

Brookfield ska bygga ett AI-datacenter på hela 750 MW i Strängnäs

Sommaren inleds med sol och varierande elpriser

OPEC+ ökar oljeproduktionen trots fallande priser

Silverpriset släpar efter guldets utveckling, har mer uppsida
-
 Nyheter3 veckor sedan
Stor uppsida i Lappland Guldprospekterings aktie enligt analys
-
 Nyheter4 veckor sedan
Brookfield ska bygga ett AI-datacenter på hela 750 MW i Strängnäs
-
 Nyheter4 veckor sedan
Sommaren inleds med sol och varierande elpriser
-
 Nyheter4 veckor sedan
OPEC+ ökar oljeproduktionen trots fallande priser
-
 Nyheter3 veckor sedan
Silverpriset släpar efter guldets utveckling, har mer uppsida
-
Analys4 veckor sedan
Brent needs to fall to USD 58/b to make cheating unprofitable for Kazakhstan
-

 Nyheter4 veckor sedan
Tradingfirman XTX Markets bygger datacenter i finska Kajana för 1 miljard euro
-

 Nyheter2 veckor sedan
Uppgången i oljepriset planade ut under helgen