

Analys
We can confidently say yet again that Saudi Arabia is the boss

Crude oil prices are pulling back this morning on China concerns. But Saudi Arabia is probably very happy with the overall situation. It has showed the oil market yet again who’s the boss and the world will also need more of its oil in the coming months. The global market is set to run a deficit of 1.7 m b/d in Q4-23 according to the latest IEA report if Russia and Saudi Arabia sticks to their current production. After now having put the market strait there is no reason for Saudi Arabia to let such a deep deficit and inventory draw actually play out. It would lead to much higher prices but Saudi would also receive a lot of political pain from the US, China, India, Europe. Why ruin the party with oil rallying above USD 100/b and drive up an ugly political debacle when oil at USD 85/b is such a beautiful place. Tapering of Saudi Arabia’s cuts in Q4-23 would be the natural thing to expect. But all through September at least there should be a very sharp and tight market.

Through most of the first half of this year all up until late June there was deep disagreement with respect to global oil demand. In its June oil market report (STEO), the US EIA projected an oil demand in Q4-23 of 101.8 m b/d while the IEA in its OMR report the same month projected a Q4-23 demand of 103.5 m b/d. Such magnitudes of diverging views with respect to global oil demand is very rare. Markets didn’t really know what to believe with deep fear of deteriorating economic outlook on top due to sky rocketing interest rates around the world and a sluggish Chinese economy. The actual level of global oil demand is usually something we only really know in hindsight. With lots of facts in hand the IEA now estimates that global demand was 103 m b/d in June and expects it to be 103.1 m b/d in Q4-23.
The world did indeed get a strong rebound in global oil demand as the world increasingly and fully emerged from Covid-19 restrictions. Increased flying, driving and strong demand for petrochemicals. But it took a little longer to materialize than expected and it was shrouded in fears over the direction of the global economy. Global demand at 103 m b/d is not about a vigorously growing global economy but mostly about normalization post Covid-19. The IEA now estimates that global demand this year will average 102.2 m b/d versus 99.9 m b/d in 2022 giving a rebound of 2.2 m b/d YoY. But if it hadn’t been for Covid-19 then global oil demand would probably have been averaging close to 106 m b/d this year and 106.5 m b/d in H2-23 if we assume the normal 1.3% oil demand growth since 2019 had taken place. Much of this normal oil demand growth is due to population growth which is relentlessly rising higher. There is thus still a potentially huge, pent up demand for oil which may have built up during the Covid-19 years. Whether that potential pent up demand will actually emerge or not remains to be seen. But for now we are at a solid 103 m b/d demand. This is what the market can see and believe in. But significant pent up demand may be lurking behind the curtains.
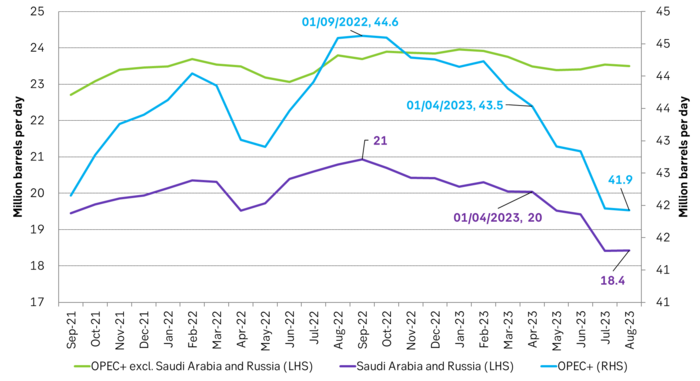
Saudi Arabia was probably very frustrated with financial oil markets as they sold oil heavily in H1-23 and drove prices lower even as Saudi Arabia could see in its physical oil books that demand was robust. Saudi Arabia made deep cuts to production from 10.5 m b/d in April and all the way down to almost 9.0 m b/d in July with same level also in August and September. This isn’t Saudi Arabia’s first rodeo and it has really showed the market yet again who’s the boss.
Global oil demand normally rises by 1.3 m b/d from H1 to H2. Production from OPEC+ has however declined by 1.6 m b/d from April to August. And market is now very tight. If Saudi Arabia and Russia sticks to their current production levels throughout H2-23 then the IEA projects a draw in global oil inventories of 1.7 m b/d. That is a big, big draw which would drive oil prices yet higher. The price of sour crude (Dubai) which normally trades at at discount to sweet crudes is now instead trading at a premium. That is how tight the sour crude market has gotten.
But Saudi Arabia now has plenty of spare capacity at hand and it can easily lift production by 1.5 m b/d again back up to 10.5 m b/d. While they may chose to keep production at around 9.0 m b/d for a little while longer they have no good reason to drive the oil price up to USD 100-110/b. That will only give them large political problems with their main consumers. For sure neither the US nor China or India will be very happy.
Saudi Arabia should be fully content for the moment. It has shown the market yet again who’s the boss. It has driven the oil price back up to a very satisfying level of USD 85/b (ish). The world needs more of its oil and Saudi has spare capacity to provide it. Could it be better? Hardly.
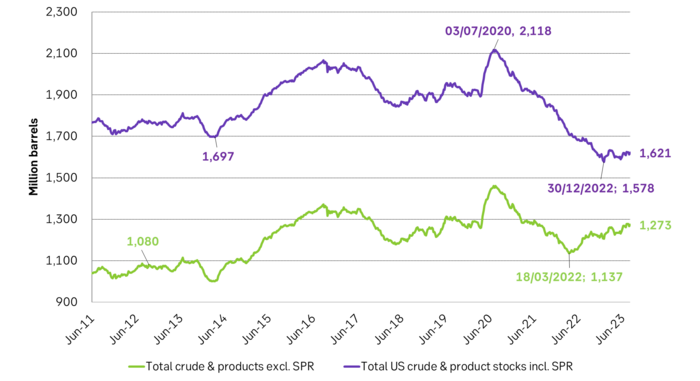
US oil inventories with and without SPR. We still haven’t seen a decline in US crude and product stocks excluding SPR. But that will be the proof of the pudding. A running global deficit of 1.7 m b/d will eventually show up in declining US crude and product stocks.
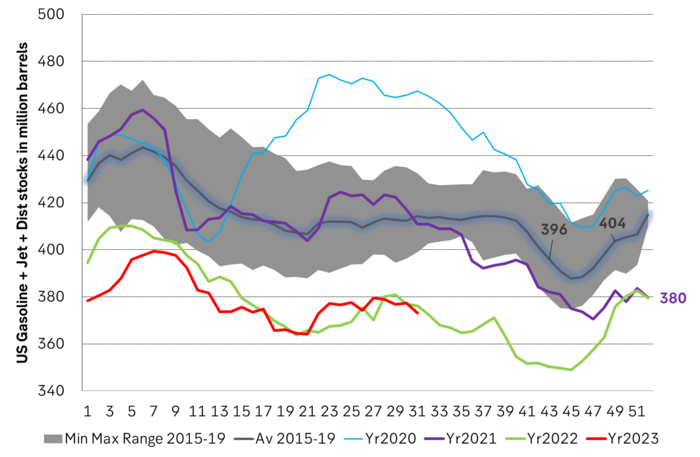
Main oil product stocks in the US are lower this year than last year. At least a little. Refining margins are very strong as a result of reviving global demand for gasoline and jet fuel. When refining margins are strong then refineries make a lot of money and then they buy a lot of crude oil to make more.
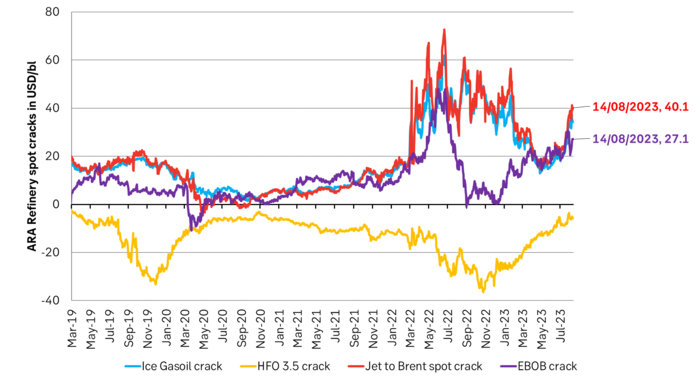
Refining margins ticked lower following crazy levels in 2022 but have now shot back up again as demand for gasoline and jet fuel has revived post Covid-19.
Significant cuts from Saudi Arabia and some cuts by Russia has made total OPEC+ production fall like a rock (blue line). But that also means there is more spare capacity at hand.
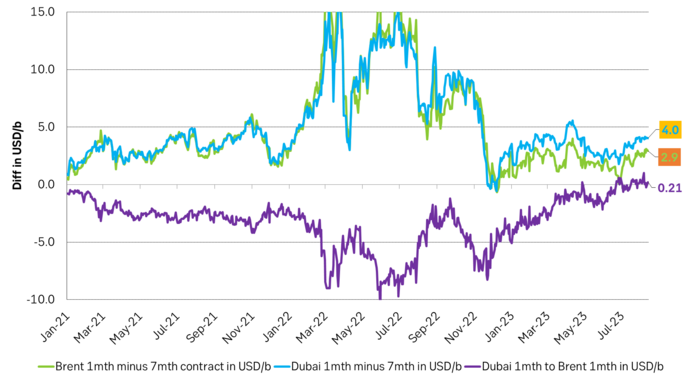
The sharp decline in production from OPEC+ has led to a rebound in the time spreads for both Brent crude and Dubai crude. The tightening by OPEC+ is so large that Dubai sour crude now trades at a premium to Brent crude which is highly unusual (lilac graph).
Hesitant today. Brent jumped to an intraday high of $66.36/b yesterday after having touched an intraday low of $60.07/b on Monday as Indian and Chinese buyers cancelled some Russian oil purchases and instead redirected their purchases towards the Middle East due to the news US sanctions. Brent is falling back 0.4% this morning to $65.8/b.

It’s our strong view that the only sensible thing is to sell this rally. In all Trump’s unpredictability he has become increasingly predictable. Again and again he has rumbled about how he is going to be tough on Putin. Punish Putin if he won’t agree to peace in Ukraine. Recent rumbling was about the Tomahawk rockets which Trump threatened on 10 October and 12 October to sell/send to Ukraine. Then on 17 October he said that ”the U.S. didn’t want to give away weapons (Tomahawks) it needs”.
All of Trump’s threats towards Putin have been hot air. So far Trump’s threats have been all hot air and threats which later have evaporated after ”great talks with Putin”. After all these repetitions it is very hard to believe that this time will be any different. The new sanctions won’t take effect before 21. November. Trump has already said that: ”he was hoping that these new sanctions would be very short-lived in any case”. Come 21. November these new sanctions will either evaporate like all the other threats Trump has thrown at Putin before fading them. Or the sanctions will be postponed by another 4 weeks or 8 weeks with the appearance that Trump is even more angry with Putin. But so far Trump has done nothing that hurt Putin/Russia. We can’t imagine that this will be different. The only way forward in our view for a propre lasting peace in Ukraine is to turn Ukraine into defensive porcupine equipped with a stinging tail if need be.
China will likely stand up to Trump if new sanctions really materialize on 21 Nov. Just one country has really stood up to Trump in his tariff trade war this year: China. China has come of age and strength. I will no longer be bullied. Trump upped tariffs. China responded in kind. Trump cut China off from high-end computer chips. China put on the breaks on rare earth metals. China won’t be bullied any more and it has the power to stand up. Some Chinese state-owned companies like Sinopec have cancelled some of their Russian purchases. But China’s Foreign Ministry spokesperson Guo Jiakun has stated that China “oppose unilateral sanctions which lack a basis in international law and authorization of the UN Security Council”. Thus no one, not even the US shall unilaterally dictate China from whom they can buy oil or not. This is yet another opportunity for China to show its new strength and stand up to Trump in a show of force. Exactly how China choses to play this remains to be seen. But China won’t be bullied by over something as important as its oil purchases. So best guess here is that China will defy Trump on this. But probably China won’t need to make a bid deal over this. Firstly because these new sanctions will either evaporate as all the other threats or be postponed once we get to 21 November. Secondly because the sanctions are explicit towards US persons and companies but only ”may” be enforced versus non-US entities.
Sanctions is not a reduction in global supply of oil. Just some added layer of friction. Anyhow, the new sanctions won’t reduce the supply of Russian crude oil to the market. It will only increase the friction in the market with yet more need for the shadow fleet and ship to ship transfer of Russian oil to dodge the sanctions. If they materialize at all.
The jump in crude oil prices is probably due to redirections of crude purchases to the Mid-East and not because all speculators are now turned bullish. Has oil rallied because all speculators now suddenly have turned bullish? We don’t think so. Brent crude has probably jumped because some Indian and Chinese oil purchasers of have redirected their purchases from Russia towards the Mid-East just in case the sanctions really materializes on 21 November.
Parts of the Brent crude curve dipping into the high $50ies/b. Brent crude fell 2.3% over the week to Friday. It closed the week at $61.29/b, a slight gain on the day, but also traded to a low of $60.14/b that same day and just barely avoided trading into the $50ies/b. This morning it is risk-on in equities which seems to help industrial metals a little higher. But no such luck for oil. It is down 0.8% at $60.8/b. This week looks set for Brent crude to dip its feet in the $50ies/b. The Brent 3mth contract actually traded into the high $50ies/b on Friday.
The front-end backwardation has been on a weakening foot and is now about to fully disappear. The lowest point of the crude oil curve has also moved steadily lower and lower and its discount to the 5yr contract is now $6.8/b. A solid contango. The Brent 3mth contract did actually dip into the $50ies/b intraday on Friday when it traded to a low point of $59.93/b.
More weakness to come as lots of oil at sea comes to ports. Mid-East OPEC countries have boosted exports along with lower post summer consumption and higher production. The result is highly visibly in oil at sea which increased by 17 mb to 1,311 mb over the week to Sunday. Up 185 mb since mid-August. On its way to discharge at a port somewhere over the coming month or two.
Don’t forget that the oil market path ahead is all down to OPEC+. Remember that what is playing out in the oil market now is all by design by OPEC+. The group has decided that the unwind of the voluntary cuts is what it wants to do. In a combination of meeting demand from consumers as well as taking back market share. But we need to remember that how this plays out going forward is all at the mercy of what OPEC+ decides to do. It will halt the unwinding at some point. It will revert to cuts instead of unwind at some point.
A few months with Brent at $55/b and 40-50 US shale oil rigs kicked out may be what is needed. We think OPEC+ needs to see the exit of another 40-50 drilling rigs in the US shale oil patches to set US shale oil production on a path to of a 1 mb/d year on year decline Dec-25 to Dec-26. We are not there yet. But a 2-3 months period with Brent crude averaging $55/b would probably do it.
Oil on water increased 17 mb over the week to Sunday while oil in transit increased by 23 mb. So less oil was standing still. More was moving.

Crude oil floating storage (stationary more than 7 days). Down 11 mb over week to Sunday

The lowest point of the Brent crude oil curve versus the 5yr contract. Weakest so far this year.

Crude oil 1mth to 3mth time-spreads. Dubai held out strongly through summer, but then that center of strength fell apart in late September and has been leading weakness in crude curves lower since then.

Rebounding along with most markets. But concerns over solidity of Gaza peace may also contribute. Brent crude fell 0.8% yesterday to $61.91/b and its lowest close since May this year. This morning it is bouncing up 0.9% to $62.5/b along with a softer USD amid positive sentiment with both equities and industrial metals moving higher. Concerns that the peace in Gaza may be less solid than what one might hope for also yields some support to Brent. Bets on tech stocks are rebounding, defying fears of trade war. Money moving back into markets. Gold continues upwards its strong trend and a softer dollar helps it higher today as well.
US crude & products probably rose 5.6 mb last week (API) versus a normal seasonal decline of 2.4 mb. The US API last night partial and thus indicative data for US oil inventories. Their data indicates that US crude stocks rose 7.4 mb last week, gasoline stocks rose 3.0 mb while Distillate stocks fell 4.8 mb. Altogether an increase in commercial crude and product stocks of 5.6 mb. Commercial US crude and product stocks normally decline by 2.4 mb this time of year. So seasonally adjusted the US inventories rose 8 mb last week according to the indicative numbers by the API. That is a lot. Also, the counter seasonal trend of rising stocks versus normally declining stocks this time of year looks on a solid pace of continuation. If the API is correct then total US crude and product stocks would stand 41 mb higher than one year ago and 6 mb higher than the 2015-19 average. And if we combine this with our knowledge of a sharp increase in production and exports by OPEC(+) and a large increase in oil at sea, then the current trend in US oil inventories looks set to continue. So higher stocks and lower crude oil prices until OPEC(+) switch to cuts. Actual US oil inventory data today at 18:00 CET.
US commercial crude and product stocks rising to 1293 mb in week 41 if last nights indicative numbers from API are correct.

Crude oil soon coming to a port near you. OPEC has lifted production sharply higher this autumn. At the same time demand for oil in the Middle-East has fallen as we have moved out of summer heat and crude oil burn for power for air-conditioning. The Middle-East oil producers have thus been able to lift exports higher on both accounts. Crude oil and condensates on water has shot up by 177 mb since mid-August. This oil is now on its way to ports around the world. And when they arrive, it will likely help to lift stocks onshore higher. That is probably when we will lose the last bit of front-end backwardation the the crude oil curves. That will help to drive the front-month Brent crude oil price down to the $60/b line and revisit the high $50ies/b. Then the eyes will be all back on OPEC+ when they meet in early November and then again in early December.
Crude oil and condensates at sea have moved straight up by 177 mb since mid-August as OPEC(+) has produced more, consumed less and exported more.


Sell the rally. Trump has become predictable in his unpredictability

Gruvbolaget Boliden överträffade analytikernas förväntningar

Australien och USA investerar 8,5 miljarder USD för försörjningskedja av kritiska mineraler
Brent crude set to dip its feet into the high $50ies/b this week

Vad guldets uppgång egentligen betyder för världen

Goldman Sachs höjer prognosen för guld, tror priset når 4900 USD

Blykalla och amerikanska Oklo inleder ett samarbete

Guld nära 4000 USD och silver 50 USD, därför kan de fortsätta stiga

Leading Edge Materials är på rätt plats i rätt tid

Nytt prisrekord, guld stiger över 4000 USD
-
 Nyheter3 veckor sedan
Goldman Sachs höjer prognosen för guld, tror priset når 4900 USD
-
 Nyheter4 veckor sedan
Blykalla och amerikanska Oklo inleder ett samarbete
-
 Nyheter3 veckor sedan
Guld nära 4000 USD och silver 50 USD, därför kan de fortsätta stiga
-
 Nyheter2 veckor sedan
Leading Edge Materials är på rätt plats i rätt tid
-
 Nyheter3 veckor sedan
Nytt prisrekord, guld stiger över 4000 USD
-

 Nyheter4 veckor sedan
Ett samtal om guld, olja, koppar och stål
-
Analys4 veckor sedan
OPEC+ will likely unwind 500 kb/d of voluntary quotas in October. But a full unwind of 1.5 mb/d in one go could be in the cards
-

 Nyheter4 veckor sedan
Neptune Energy bekräftar enorma litiumfyndigheter i Tyskland