

Analys
USD 100/b in sight but oil product demand may start to hurt

Some crude oil grades have already traded above USD 100/b. Tapis last week at USD 101.3/b. Dated Brent is trading at USD 95.1/b. No more than some market noise is needed to drive it above USD 100/b. But a perceived and implied oil market deficit of 1.5 to 2.5 m b/d may be closer to balance than a deficit. And if so the reason is probably that oil product demand is hurting. Refineries are running hard. They are craving for crude and converting it to oil products. Crude stocks in US, EU16 and Japan fell 23 m b in August as a result of this and amid continued restraint production by Saudi/Russia. But oil product stocks rose 20.3 m b with net draws in crude and products of only 2.7 m b for these regions. Thus indicating more of a balanced market than a deficit. Naturally there has been strong support for crude prices while oil product refinery margins have started to come off. Saudi/Russia is in solid control of the market. Both crude and product stocks are low while the market is either in deficit or at best in balance. So there should be limited down side price risk. But oil product demand is likely to hurt more if Brent crude rises to USD 110-120/b and such a price level looks excessive.

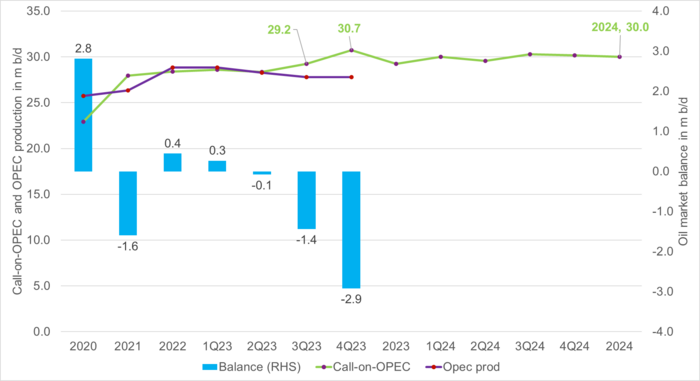
Crude oil prices have been on a relentless rise since late June when it became clear that Saudi Arabia would keep its production at 9 m b/d not just in July but also in August. Then later extended to September and then lately to the end of the year. On paper this has placed the market into a solid deficit. Total OPEC production was 27.8 m b/d in August and likely more or less the same in September. OPEC estimates that the need for oil from OPEC in Q3-23 is 29.2 m b/d which places the global market in a 1.4 m b/d deficit when OPEC produces 27.8 m b/d.
The proof of the pudding is of course that inventories actually draws down when there is a deficit. A 1.4 m b/d of deficit for 31 days in August implies a global inventory draw of 43.4 m b/d. If we assume that OECD countries accounts for 46% of global oil demand then OECD could/should have had a fair share of inventory rise of say 20 m b in August. Actual inventory data are however usually a lagging set of data so we have to work with sub sets of data being released on a higher frequency. And non-OECD demand and inventory data are hard to come by.
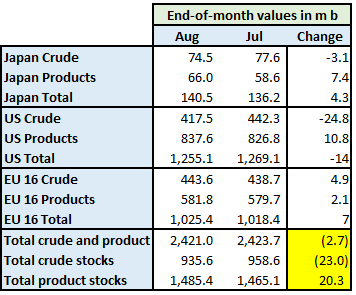
If we look at oil inventory data for US, EU16 and Japan we see that crude stocks fell 23 m b in August while product stocks rose 20.3 m b with a total crude and product draw of only 2.7 m b. I.e. indicating close to a balanced market in August rather than a big deficit. But it matters that crude stocks fell 23 m b. That is a tight crude market where refineries are craving and bidding for crude oil together with speculators who are buying paper-oil. So refineries worked hard to buy crude oil and converting it to oil products in August. But these additional oil products weren’t gobbled up by consumers but instead went into inventories.
Rising oil product inventories is of course a good thing since these inventories in general are low. And also oil product stocks are low. The point is more that the world did maybe not run a large supply/demand deficit of 1.5 to 2.5 m b/d in August but rather had a more balanced market. A weaker oil product demand than anticipated would then likely be the natural explanation for this. Strong refinery demand for crude oil, crude oil inventory draws amid a situation where crude inventories already are low is of course creating an added sense of bullishness for crude oil.
On the one hand strong refinery demand for crude oil has helped to drive crude oil prices higher amid continued production cuts by Saudi Arabia. Rising oil product stocks have on the other hand eased the pressure on oil products and thus softened the oil product refinery margins.
The overall situation is that Saudi Arabia together with Russia are in solid control of the oil market. Further that the global market is either balanced or in deficit and that both crude and product stocks are still low. Thus we have a tight market both in terms of supplies and inventories. So there should be limited downside in oil prices. We are highly likely to see Dated Brent moving above USD 100/b. It is now less than USD 5/b away from that level and only noise is needed to bring it above. Tupis crude oil in Asia traded at USD 101.3/b last week. So some crude benchmarks are already above the USD 100/b mark.
While Dated Brent looks set to hit USD 100/b in not too long we are skeptical with respect to further price rises to USD 110-120/b as oil product demand likely increasingly would start to hurt. Unless of course if we get some serious supply disruptions. But Saudi Arabia now has several million barrels per day of reserve capacity as it today only produces 9.0 m b/d. Thus disruptions can be countered. Oil product demand, oil product cracks and oil product inventories is a good thing to watch going forward. An oil price of USD 85-95/b is probably much better than USD 110-120/b for a world where economic activity is likely set to slow rather than accelerate following large interest rate hikes over the past 12-18 months.
OPEC’s implied call-on-OPEC crude oil. If OPEC’s production stays at 27.8 m b/d throughout Q3-23 and Q4-23 then OPECs numbers further strong inventory draws to the end of the year.
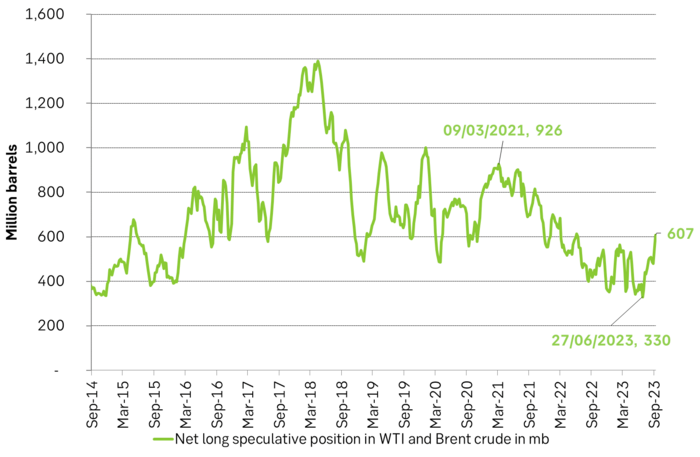
Net long speculative positions in Brent crude and WTI. Speculators have joined the price rally since end of June.
End of month crude and product stocks in m b in EU16, US and Japan. Solid draw in crude stocks but also solid rise in product stocks. In total very limited inventory draw. Refineries ran hard to convert crude to oil products but these then went straight into inventories alleviating low oil product inventories there.
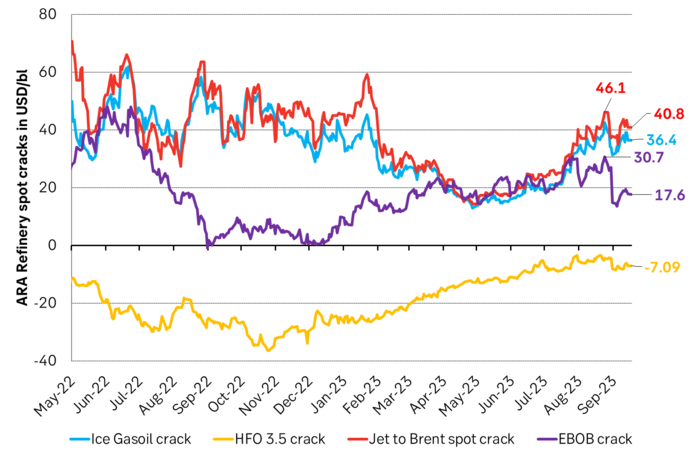
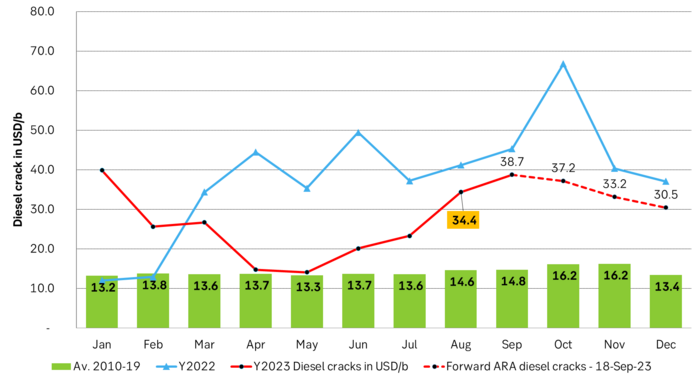
ARA oil product refinery margins have come off their highs for all products as the oil product situation has eased a bit. Especially so for gasoline with now fading summer driving. But also HFO 3.5% cracks have eased back a little bit. But to be clear, diesel cracks and mid-dist cracks are still exceptionally high. And even gasoline crack down to USD 17.6/b is still very high this time of year.
ARA diesel cracks in USD/b. Very, very high in 2022. Almost normal in Apr and May. Now very high vs. normal though a little softer than last year.
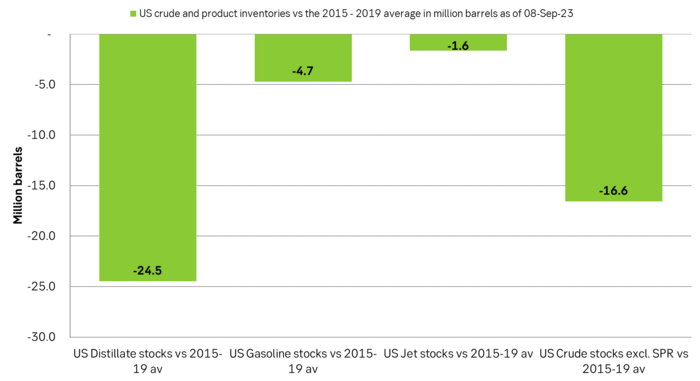
US crude and product stocks vs. 2015-2019 average. Still very low mid-dist inventories (diesel) and also low crude stocks but not all that low gasoline inventories.
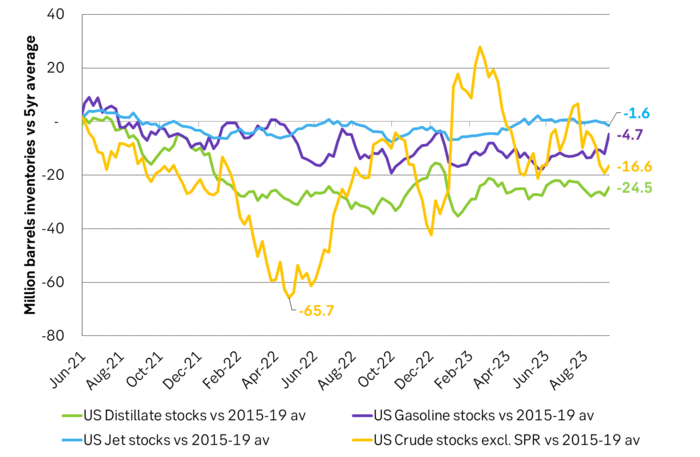
US crude and product stocks vs. 2015-2019 averages. Mid-dist stocks have stayed persistently low while gasoline stocks suddenly have jumped as gasoline demand seems to have started to hurt due to higher prices.
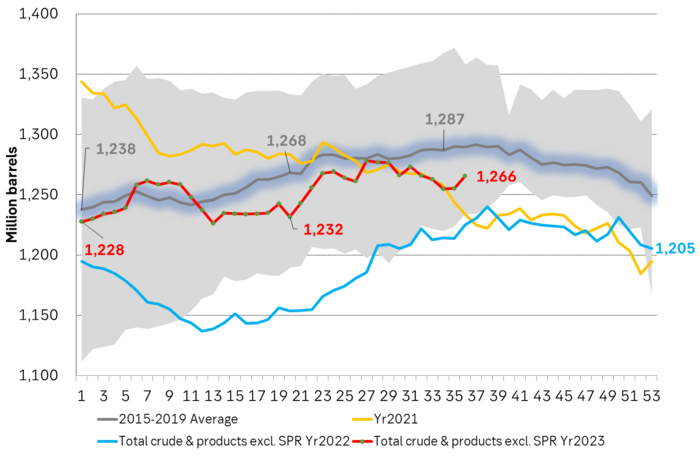
Total commercial US crude and product stocks in million barrels. Rising lately. If large, global deficit they should have been falling sharply. Might be a blip?
Source: SEB graph and calculations, Blbrg data feed, EIA data
Some rebound but not much. Brent crude rebounded 1.5% yesterday to $65.47/b. This morning it is inching 0.2% up to $65.6/b. The lowest close last week was on Thursday at $64.11/b.

The curve structure is almost as week as it was before the weekend. The rebound we now have gotten post the message from OPEC+ over the weekend is to a large degree a rebound along the curve rather than much strengthening at the front-end of the curve. That part of the curve structure is almost as weak as it was last Thursday.
We are still on a weakening path. The message from OPEC+ over the weekend was we are still on a weakening path with rising supply from the group. It is just not as rapidly weakening as was feared ahead of the weekend when a quota hike of 500 kb/d/mth for November was discussed.
The Brent curve is on its way to full contango with Brent dipping into the $50ies/b. Thus the ongoing weakening we have had in the crude curve since the start of the year, and especially since early June, will continue until the Brent crude oil forward curve is in full contango along with visibly rising US and OECD oil inventories. The front-month Brent contract will then flip down towards the $60/b-line and below into the $50ies/b.
At what point will OPEC+ turn to cuts? The big question then becomes: When will OPEC+ turn around to make some cuts? At what (price) point will they choose to stabilize the market? Because for sure they will. Higher oil inventories, some more shedding of drilling rigs in US shale and Brent into the 50ies somewhere is probably where the group will step in.
There is nothing we have seen from the group so far which indicates that they will close their eyes, let the world drown in oil and the oil price crash to $40/b or below.
The message from OPEC+ is also about balance and stability. The world won’t drown in oil in 2026. The message from the group as far as we manage to interpret it is twofold: 1) Taking back market share which requires a lower price for non-OPEC+ to back off a bit, and 2) Oil market stability and balance. It is not just about 1. Thus fretting about how we are all going to drown in oil in 2026 is totally off the mark by just focusing on point 1.
When to buy cal 2026? Before Christmas when Brent hits $55/b and before OPEC+ holds its last meeting of the year which is likely to be in early December.
Brent crude oil prices have rebounded a bit along the forward curve. Not much strengthening in the structure of the curve. The front-end backwardation is not much stronger today than on its weakest level so far this year which was on Thursday last week.

The front-end backwardation fell to its weakest level so far this year on Thursday last week. A slight pickup yesterday and today, but still very close to the weakest year to date. More oil from OPEC+ in the coming months and softer demand and rising inventories. We are heading for yet softer levels.

Down to the lowest since early May. Brent crude has fallen sharply the latest four days. It closed at USD 64.11/b yesterday which is the lowest since early May. It is staging a 1.3% rebound this morning along with gains in both equities and industrial metals with an added touch of support from a softer USD on top.
What stands out the most to us this week is the collapse in the Dubai one to three months time-spread.
Dubai is medium sour crude. OPEC+ is in general medium sour crude production. Asian refineries are predominantly designed to process medium sour crude. So Dubai is the real measure of the balance between OPEC+ holding back or not versus Asian oil demand for consumption and stock building.
A sharp weakening of the front-end of the Dubai curve. The front-end of the Dubai crude curve has been holding out very solidly throughout this summer while the front-end of the Brent and WTI curves have been steadily softening. But the strength in the Dubai curve in our view was carrying the crude oil market in general. A source of strength in the crude oil market. The core of the strength.
The now finally sharp decline of the front-end of the Dubai crude curve is thus a strong shift. Weakness in the Dubai crude marker is weakness in the core of the oil market. The core which has helped to hold the oil market elevated.
Facts supports the weakening. Add in facts of Iraq lifting production from Kurdistan through Turkey. Saudi Arabia lifting production to 10 mb/d in September (normal production level) and lifting exports as well as domestic demand for oil for power for air con is fading along with summer heat. Add also in counter seasonal rise in US crude and product stocks last week. US oil stocks usually decline by 1.3 mb/week this time of year. Last week they instead rose 6.4 mb/week (+7.2 mb if including SPR). Total US commercial oil stocks are now only 2.1 mb below the 2015-19 seasonal average. US oil stocks normally decline from now to Christmas. If they instead continue to rise, then it will be strongly counter seasonal rise and will create a very strong bearish pressure on oil prices.
Will OPEC+ lift its voluntary quotas by zero, 137 kb/d, 500 kb/d or 1.5 mb/d? On Sunday of course OPEC+ will decide on how much to unwind of the remaining 1.5 mb/d of voluntary quotas for November. Will it be 137 kb/d yet again as for October? Will it be 500 kb/d as was talked about earlier this week? Or will it be a full unwind in one go of 1.5 mb/d? We think most likely now it will be at least 500 kb/d and possibly a full unwind. We discussed this in a not earlier this week: ”500 kb/d of voluntary quotas in October. But a full unwind of 1.5 mb/d”
The strength in the front-end of the Dubai curve held out through summer while Brent and WTI curve structures weakened steadily. That core strength helped to keep flat crude oil prices elevated close to the 70-line. Now also the Dubai curve has given in.

Brent crude oil forward curves

Total US commercial stocks now close to normal. Counter seasonal rise last week. Rest of year?

Total US crude and product stocks on a steady trend higher.

Analys
OPEC+ will likely unwind 500 kb/d of voluntary quotas in October. But a full unwind of 1.5 mb/d in one go could be in the cards
Down to mid-60ies as Iraq lifts production while Saudi may be tired of voluntary cut frugality. The Brent December contract dropped 1.6% yesterday to USD 66.03/b. This morning it is down another 0.3% to USD 65.8/b. The drop in the price came on the back of the combined news that Iraq has resumed 190 kb/d of production in Kurdistan with exports through Turkey while OPEC+ delegates send signals that the group will unwind the remaining 1.65 mb/d (less the 137 kb/d in October) of voluntary cuts at a pace of 500 kb/d per month pace.
Signals of accelerated unwind and Iraqi increase may be connected. Russia, Kazakhstan and Iraq were main offenders versus the voluntary quotas they had agreed to follow. Russia had a production ’debt’ (cumulative overproduction versus quota) of close to 90 mb in March this year while Kazakhstan had a ’debt’ of about 60 mb and the same for Iraq. This apparently made Saudi Arabia angry this spring. Why should Saudi Arabia hold back if the other voluntary cutters were just freeriding? Thus the sudden rapid unwinding of voluntary cuts. That is at least one angle of explanations for the accelerated unwinding.
If the offenders with production debts then refrained from lifting production as the voluntary cuts were rapidly unwinded, then they could ’pay back’ their ’debts’ as they would under-produce versus the new and steadily higher quotas.
Forget about Kazakhstan. Its production was just too far above the quotas with no hope that the country would hold back production due to cross-ownership of oil assets by international oil companies. But Russia and Iraq should be able to do it.
Iraqi cumulative overproduction versus quotas could reach 85-90 mb in October. Iraq has however steadily continued to overproduce by 3-5 mb per month. In July its new and gradually higher quota came close to equal with a cumulative overproduction of only 0.6 mb that month. In August again however its production had an overshoot of 100 kb/d or 3.1 mb for the month. Its cumulative production debt had then risen to close to 80 mb. We don’t know for September yet. But looking at October we now know that its production will likely average close to 4.5 mb/d due to the revival of 190 kb/d of production in Kurdistan. Its quota however will only be 4.24 mb/d. Its overproduction in October will thus likely be around 250 kb/d above its quota with its production debt rising another 7-8 mb to a total of close to 90 mb.
Again, why should Saudi Arabia be frugal while Iraq is freeriding. Better to get rid of the voluntary quotas as quickly as possible and then start all over with clean sheets.
Unwinding the remaining 1.513 mb/d in one go in October? If OPEC+ unwinds the remaining 1.513 mb/d of voluntary cuts in one big go in October, then Iraq’s quota will be around 4.4 mb/d for October versus its likely production of close to 4.5 mb/d for the coming month..
OPEC+ should thus unwind the remaining 1.513 mb/d (1.65 – 0.137 mb/d) in one go for October in order for the quota of Iraq to be able to keep track with Iraq’s actual production increase.
October 5 will show how it plays out. But a quota unwind of at least 500 kb/d for Oct seems likely. An overall increase of at least 500 kb/d in the voluntary quota for October looks likely. But it could be the whole 1.513 mb/d in one go. If the increase in the quota is ’only’ 500 kb/d then Iraqi cumulative production will still rise by 5.7 mb to a total of 85 mb in October.
Iraqi production debt versus quotas will likely rise by 5.7 mb in October if OPEC+ only lifts the overall quota by 500 kb/d in October. Here assuming historical production debt did not rise in September. That Iraq lifts its production by 190 kb/d in October to 4.47 mb/d (August level + 190 kb/d) and that OPEC+ unwinds 500 kb/d of the remining quotas in October when they decide on this on 5 October.


Blykalla, Evroc och Studsvik vill bygga kärnkraftsdrivna datacenter i Sverige

Toppmöte om framtidens kärnkraft runt Östersjön hölls idag

Nytt prisrekord, guld stiger över 4000 USD

Goldman Sachs höjer prognosen för guld, tror priset når 4900 USD
More weakness and lower price levels ahead, but the world won’t drown in oil in 2026

Mahvie Minerals i en guldtrend
Volatile but going nowhere. Brent crude circles USD 66 as market weighs surplus vs risk

Aktier i guldbolag laggar priset på guld

Kinas elproduktion slog nytt rekord i augusti, vilket även kolkraft gjorde

Tyskland har så höga elpriser att företag inte har råd att använda elektricitet
-
 Nyheter4 veckor sedan
Mahvie Minerals i en guldtrend
-
Analys4 veckor sedan
Volatile but going nowhere. Brent crude circles USD 66 as market weighs surplus vs risk
-
 Nyheter4 veckor sedan
Aktier i guldbolag laggar priset på guld
-
 Nyheter3 veckor sedan
Kinas elproduktion slog nytt rekord i augusti, vilket även kolkraft gjorde
-
Nyheter3 veckor sedan
Tyskland har så höga elpriser att företag inte har råd att använda elektricitet
-

 Nyheter4 veckor sedan
Guld når sin högsta nivå någonsin, nu även justerat för inflation
-

 Nyheter4 veckor sedan
Det stigande guldpriset en utmaning för smyckesköpare
-
Analys4 veckor sedan
Waiting for the surplus while we worry about Israel and Qatar