

Analys
Ultra tight market for medium sour crude and middle distillates

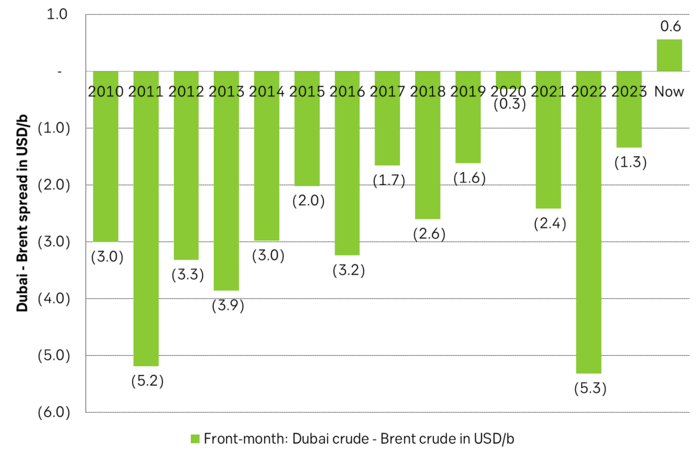
The world is craving for medium sour crude, middle distillates and heavier products. Deep cuts by OPEC+ has created a super tight market for medium to heavy crudes. So tight that Dubai crude now trades at a USD 0.6/b premium to Brent crude rather than a normal discount. All of Russia’s crudes are now trading above the USD 60/b price cap set by the US. Scarcity of such crudes, rich on middle distillates and heavy products, is naturally leading to a scarcity of middle distillates and heavier products. Global inventories of such products are now very low and refining margins are skyrocketing with diesel in Europe now at USD 125/b. There is no sign that Saudi Arabia will shift away from its current ”price over volume” strategy as it is expected to lift its official selling prices for October. Crude oil at USD 85/b is a blissful heaven for Saudi Arabia. As long as US shale oil is shedding drilling rigs at a WTI oil price of USD 80/b there is no reason for Saudi Arabia to fear any shale oil boom which potentially could rob if of market shares. So ”price over volume” is the name of the game.

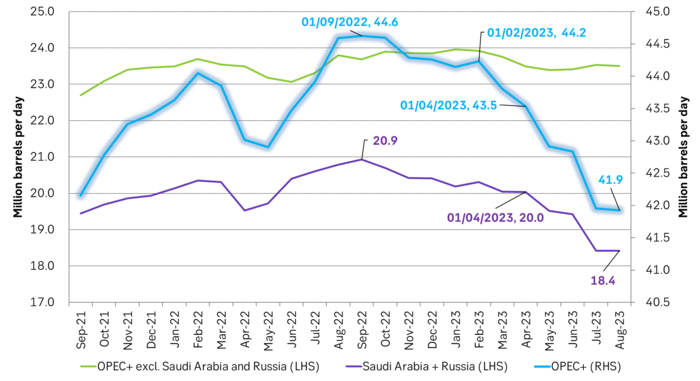
Production by OPEC+ has declined by 2.7 m b/d from Sep-2022 to Aug-2023. Most of this reduction has taken place since February this year. Global demand on the other hand has increased by 2.4 m b/d from Q3-2022 to Q3-2023. This counter move between supply from OPEC+ vs. global demand has been partially eased by a 1.4 m b/d increase in supply by OECD producers, mostly US shale oil (light sweet crude).
There has thus been a massive tightening in the supply of medium sour crude (medium weight and sulfur > 1%) from OPEC+. Naturally so because this is the type of crude which OPEC+ predominantly is producing. So when the organisation makes deep cuts it leads to a tightening of the medium sour crude market.
The situation has been exacerbated by several factors. The first is Europe which no longer is importing neither crude nor oil products from Russia. The EU28 used to import 4.3 m b/d of crude and products from Russia before the war in Ukraine. Predominantly medium sour crude (Urals), lots of diesel but also lots of heavier components like VGO and different kinds of heavy refinery residues like bunker oil etc. Refineries are huge, complex, specialized machines which are individually tailor made for specific tasks and feed stocks. Without the specific feed stocks they were made for they typically cannot run optimally and have to run at reduced rates thus churning out less finished oil products. Europe has to some degree been able to import medium sour crude from the Middle East and other places to replace the 4.3 m b/d of lost supply from Russia, but it has also been forced to replace it with light sweet crude from the US which is yielding much less diesel or heavier products. The Vacuum Gasoil (VGO) and other heavy feed stocks which the EU used to import from Russia were typically converted to diesel products in deep conversion units. The second factor which has added to the problem is that more than 5 m b/d of global refining capacity has been decommissioned globally since 2020. Global refining capacity actually contracted in 2021 for the first time!
But bottom line here is that the global market for medium sour crude is now super tight. Predominantly as a result of deep cuts by OPEC+. This has amplified the factors above and led to a super tight situation in medium heavy to heavy products (diesel, jet, bunker oil, etc). It is so tight that bunker oil (HSFO 3.5%) in Europe recently traded at a premium to Brent crude rather than a normal discount of USD 10-20/b. This hasn’t happened since the 1990ies! Another sign of the tightness in medium sour crude is that Dubai crude (API = 31, Sulfur = 2%) now is trading at a premium to Brent crude (API = 38, Sulfur = 0.5%) versus a normal discount of more than USD 2/b.
Global middle distillate stocks are very low as we now head into winter. Inventories of middle distillates and jet fuel in the US is almost equally low as they were one year ago.
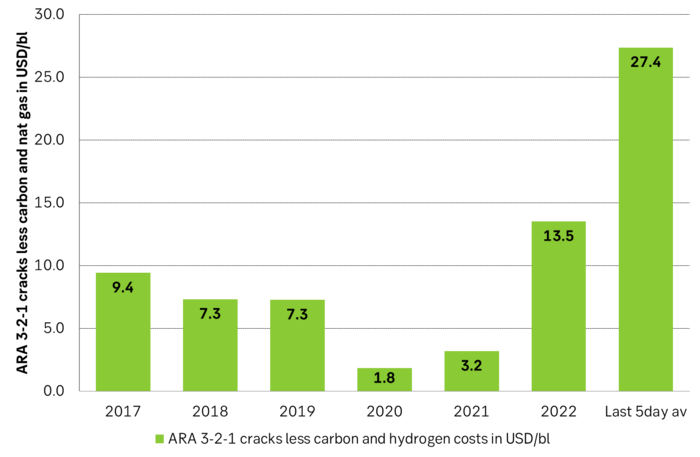
The tightness in medium sour crude and diesel products has sent refinery margins skyrocketing. The price of diesel in Europe ARA is now standing at USD 125.2/b. That is down from the crazy prices we had one year ago when diesel prices in Europe almost reached USD 180/b. But current diesel price is on par with the price of diesel from 2011 to 2014 when Brent crude averaged USD 110/b. The diesel refining premium in ARA is now USD 40/b and the premium for jet fuel is USD 45/b. Refineries usually make a profit on diesel, jet and gasoline, a loss on bunker oil and a total refining margin for turning crude oil to products of maybe just USD 5/b before operating and capital cost leaving them with limited or even negative margins overall. Now they are making a killing. As a result they will buy as much crude as they can and turn it into the needed products. What they want more than anything is medium sour crudes which have rich contents of middle distillates. But the supply of that crude is now super tight due to deliberate cuts by Saudi Arabia and now also Russia.
There is no sign that Saudi Arabia and Russia will back down any time soon. Saudi Arabia is about to set its official selling prices (OSPs) for October and indications are that they will increase their prices. That implies that Saudi Arabia will continue its ”price over volume” strategy. No signs that they will change on this any time soon. US shale oil producers are still shedding drilling rigs and supply growth there is slowing = Power to OPEC+ to control the market.
Saudi Arabia will also decide over the coming days what they will do with their unilateral production cut for October. Will it roll forward their current production of 9 m b/d or will they add some crude and lift it to for example 9.5 m b/d? Hard to say, but what is clear is that the global market currently is craving for more diesel, heavy products and medium sour crude. Our view is that Saudi Arabia will not risk driving crude oil prices to USD 100 – 110/b or higher through deliberate cuts as this will lead to elevated political storm from the US and maybe also from China. We think that Saudi Arabia is utterly happy with the current oil price of USD 85/b and want to keep it at that level. Getting it exactly right is of course tricky, but they do have the capacity to at least get it ballpark right.
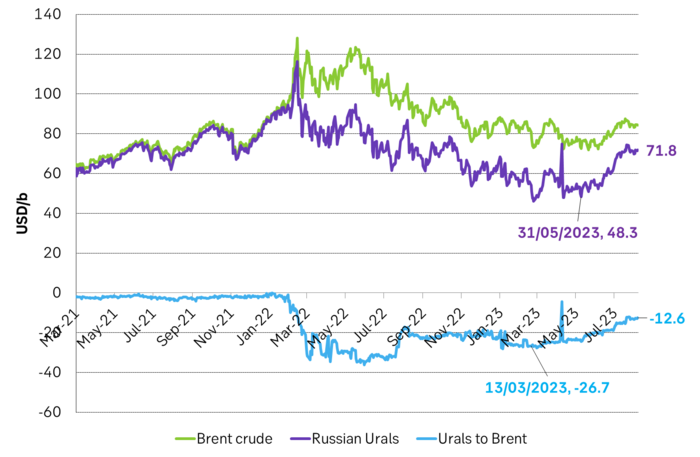
Russia should be super happy. The tight medium sour crude market has sent the price of all their crude exports to above the USD 60/b cap. The price of Urals has increased from USD 50/b in May to now USD 71/b. This is of course a headache for the western who is trying to limit Russian oil revenue.
Deep cuts by OPEC+ over the past year. In total 2.7 m b/d since Sep 2022. But accelerating cuts since February 2023. Deliberate cuts by Saudi Arabia and in part by Russia. It has created a super tight market for medium sour crude as global demand has rallied 2.4 m b/d over the past year.
Price spread Dubai – Brent. Dubai usually trades at a discount to Brent crude. Now it trades at a premium of USD 0.6/b. Highly unusual! A sign of a very tight medium sour crude oil market.
The price discount for Russian Urals crude is evaporating as the market for medium sour crude oil has tightened.
ARA diesel prices have rallied since their low point in April. Diesel in ARA now costs USD 125/b and equally much as it did from 2011 to 2014 when Brent crude traded at USD 110/b.
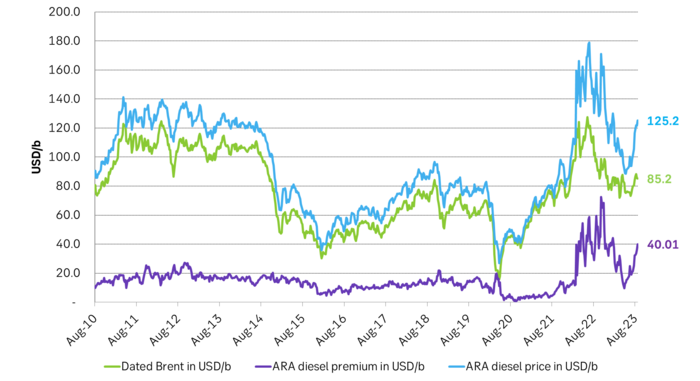
Refineries are making a killing as refining margins for diesel, jet and gasoline have skyrocketed while the usual loss making component, bunker oil, now almost trades on par with Brent crude. Refineries, the primary buyers of crude, will buy as much crude oil as they can to make yet more money. This should help to keep demand for crude oil elevated and thus prices for crude oil elevated.
Market is starting to take US/Iran headlines with a pinch of salt. Brent crude rose $2.8/b yesterday to an official close of $112.1/b. But after that it traded as low as $108.05/b before ending late night at around $109.7/b. Through the day it traded in a range of $106.87 – 112.72/b amid a flurry of news or rumors from Iran and the US. ”US temporary sanctions during negotiations” (falls alarm). ”We will bomb Iran” (not anyhow),… etc. While the market is still fluctuating to this kind of news flow, it is starting to take such headlines with a pinch of salt.

We’ll see. Maybe, maybe not. The Brent M1 contract is trading at $110.2/b this morning which very close to the average ticks through yesterday of $110.4/b.
Trump with bearish, verbal intervention whenever Brent trades above $110/b it seems. What seems to be a pattern is that Trump states something like ”very good negotiations going on with Iran”, ”New leaders in Iran are great,..”, ”Great progress in negotiations,…”, ”Deal in sight,..” etc whenever the Brent M1 contract trades above $110/b. An effort to cool the market. These hot air verbal interventions from Trump used to have a heavy bearish impact on prices, but they now seems to have less and less effect unless they are backed by reality.
As far as we can see there has been no real progress in the negotiations between the US and Iran with both sides still standing by their previous demands.
Iran is getting stronger while the cease fire lasts making a return to war for Trump yet harder. Iran is naturally in constant preparation for a return to war given Trump’s steady threats of bombing Iran again. Iran is naturally doing what ever is possible to prepare for a return to war. And every day the cease fire lasts it is better prepared. This naturally makes it more and more difficult and dangerous for the US to return to warring activity versus Iran as the consequences for energy infrastructure in the Persian Gulf will be more and more severe the longer the cease fire lasts. Israel seems to see it this way as well. That the war is not won and that current frozen state of a cease fire gives Iran opportunity to rebuild military and politically.
Global inventories are drawing down day by day. How much? In the meantime the Strait of Hormuz stays closed. There is varying measures and estimates of how much global inventories are drawing down. Our rough estimate, back of the envelope, is that global inventories are drawing down by at least some 10 mb/d or about 300 mb/d in a balance between loss of supply versus demand destruction. Other estimates we see are a monthly draw of 250-270 mb/d. The IEA only ’measured’ a draw in global observable stocks of 117 mb in April with oil on water rising 53 mb while on shore stocks fell 170 mb. But global stocks are hard to measure with large invisible, unmeasured stocks. As such a back of the envelope approach may be better.
Oil products is what the world is consuming. Oil product prices likely to rise while product stocks fall. Strategic Petroleum Reserves (SPR) are predominantly crude oil. Discharging oil from OECD SPR stocks, a sharp reduction in Chinese crude imports and a reduction in global refinery throughput of 6-7 mb/d has helped to keep crude oil markets satisfactorily supplied. But global inventories are drawing down none the less. And oil products is really what the world is consuming. So if global refinery throughput stays subdued, then demand will eventually have to match the supply of oil products. The likely path forward this summer is a steady draw down in jet fuel, diesel and gasoline. Higher prices for these. Then, if possible, higher refinery throughput and higher usage of crude in response to very profitable refinery margins. And lastly sharper draw in crude stocks and higher prices for these. But some 6 mb/d of oil products used to be exported through the Strait of Hormuz. And it may not be so easy to ramp up refinery activity across the world to compensate. Especially as Ukraine continues to damage Russian refineries as well as Russian crude production and export facilities.
Watch oil product stocks and prices as well as Brent calendar 2027. What to watch for this summer is thus oil product inventories falling and oil product premiums to crude rising. Another measure to watch is the Brent crude 2027 contract as it rises steadily day by day as the Strait of Hormuz stays closed and global oil inventories decline. The latter is close to the highest level since the start of the war and keeps rising.
The Brent M1 contract and the Brent 2027 prices and current price of jet fuel in Europe (ARA). All in USD/b

Our back of the envelope calculation of the global shortage created by the closure of the Strait of Hormuz. Note that 3.5 mb/d of discharge from SPR is also a draw. Note also that ’Forced demand loss’ of 2.5 mb/d is probably temporary and will fall back towards zero as logistics are sorted out leaving ’Price demand loss’ to do the job of balancing the market. Thus a shortfall of at least 9 mb/d created by the closure. More if SPR discharge is included and more if Forced demand loss recedes.

Brent is climbing higher. Front-month is at USD 106.3/bl this morning, close to a weekly high and a USD 9/bl jump from Mondays open. This is the move we flagged as a risk earlier in the week: the market shifting from ”a deal is around the corner” to ”this is going to take longer than we thought”.

Analyst Commodities, SEB
During April, rest-of-year Brent remained remarkably stable around USD 90/bl. A stability which rested on one single assumption: the SoH reopens around 1 May. That assumption is now slowly falling apart.
As we highlighted yesterday: every week of delay beyond 1 May adds (theoretically) ish USD 5/bl to the rest-of-year average, as global inventories draw 100 million barrels per week. i.e., a mid-May reopening implies rest-of-year Brent closer to USD 100/bl, and anything pushing into June or July takes us meaningfully higher.
What’s changed in the last 48 hours:
#1: The US military has formally warned that clearing suspected sea mines from SoH could take up to six months. That is a completely different timescale from what the financial market is pricing. Even a political deal tomorrow does not immediately reopen the strait.
#2: Trump has shifted his tone from urgency to ”strategic patience”. In yesterday’s press conference: ”Don’t rush me… I want a great deal.” The market is reading this as a president no longer feeling pressured by timelines, with the naval blockade running in the background.
#3: So far, the military activity is escalating, not de-escalating. Axios reports Iran is laying more mines in SoH. The US 3rd carrier strike group (USS George H.W. Bush) is arriving with two countermine vessels. Trump yesterday ordered the US Navy to destroy any Iranian boats caught laying mines. While CNN reports that the Pentagon is actively drawing up plans to strike Iranian SoH capabilities and individual Iranian military leaders if the ceasefire collapses. i.e., NOT a attitude consistent with an imminent deal!
Spot crude and product prices eased off the early-April highs on a combination of system rerouting and deal optimism. Both now weakening. Goldman estimates April Gulf output is reduced by 14.5 mbl/d, or 57% of pre-war supply, a number that keeps getting worse the longer this drags on.
Demand-side adaptation is ongoing: S. Korea has cut its Middle East crude dependence from 69% to 56% by pulling more from the Americas and Africa, and Japan is kicking off a second round of SPR releases from 1 May. But SPRs are finite.
Ref. to the negotiations, we should not bet on speed. The current Iranian leadership is dominated by genuine hardliners willing to absorb economic pain and run the clock to extract concessions. That is not a setup for a rapid resolution. US/Israeli media briefings keep framing the delay as ”internal Iranian divisions”, the reality is more complicated and points toward weeks and months, not days.
Our point is that the complexity is large, and higher prices have only just started (given a scenario where the negotiations drag out in time). The market spent April leaning on the USD 90/bl rest-of-year assumption; that case is diminishing by the hour. If ”early May reopening” is replaced by ”June, July or later” over the next week or two, both crude and products have meaningful room to reprice higher from here. There is a high risk being short energy and betting on any immediate political resolution(!).
Down on Friday. Up on Monday. The Brent June crude oil contract traded down 5.1% last week to a close of $90.38/b. It reached a high of $103.87/b last Monday and a low of $86.09/b on Friday as Iran announced that the Strait of Hormuz was fully open for transit. That quickly changed over the weekend as the US upheld its blockade of Iranian oil exports while Iran naturally responded by closing the SoH again. The US blew a hole in the engine room of the Iranian ship TOUSKA and took custody of the ship on Sunday. Brent crude is up 5.6% this morning to $95.4/b.
The cease-fire is expiring tomorrow. The US has said it will send a delegation for a second round of negotiations in Islamabad in Pakistan. But Iran has for now rejected a second round of talks as it views US demands as unrealistic and excessive while the US is also blocking the Strait of Hormuz.
While Brent is up 5% this morning, the financial market is still very optimistic that progress will be made. That talks will continue and that the SoH will fully open by the start of May which is consistent with a rest-of-year average Brent crude oil price of around $90/b with the market now trading that balance at around $88/b.
Financial optimism vs. physical deterioration. We have a divergence where the financial market is trading negotiations, improvements and resolution while at the same time the physical market is deteriorating day by day. Physical oil flows remain constrained by disrupted flows, longer voyage times and elevated freight and insurance costs.
Financial markets are betting that a US/Iranian resolution will save us in time from violent shortages down the road. But every day that the SoH remains closed is bringing us closer to a potentially very painful point of shortages and much higher prices.
The US blockade is also a weapon of leverage against its European and Asian allies. When Iran closed the SoH it held the world economy as a hostage against the US. The US blockade of the SoH is of course blocking Iranian oil exports. But it is also an action of disruption directed towards Europe and Asia. The US has called for the rest of the world to engaged in the war with Iran: ”If you want oil from the Persian Gulf, then go and get it”. A risk is that the US plays brinkmanship with the global oil market directed towards its European and Asian allies and maybe even towards China to force them to engage and take part. Maybe unthinkable. But unthinkable has become the norm with Trump in the White House.


Sommarväder skapar prisrally på elbörsen
Oil product price pain is set to rise as the Strait of Hormuz stays closed into summer

Solkraften pressar elpriserna dagtid

Michel Gubel ger sin syn på oljemarknaden