

Analys
The self-destructive force of unregulated solar power

Modifications

Solar and wind power production has increased rapidly over the latest years as LCOE costs have fallen sharply while government support schemes have given it an extra boost as well. Solar and wind power production is totally unregulated supply. They produce whenever they produce. Fossil power supply on the other hand is fully dispatchable to the degree that we tend to take it for granted. As such we have naturally tended to underestimate the consequences of not having dispatchability in solar and wind power.
When you start out with a large, fossil-based power system it is fairly easy to add unregulated power supply from solar and wind because it can piggyback on the dispatchability and flexibility of the fossil power system. But as the share of unregulated renewable energy rises to a larger and larger share of production, the flexibility in the fossil part of the system naturally gets smaller and smaller. This problem is accentuated further by the fact that solar power production has a very high concentration of production where 80% of production in a year is produced in only 20% of the hours in the year. Thus fossil flexibility and dispatchability is eroded much faster during these 20% hours.
Power prices typically collapse to zero or negative when demand is fully met or saturated by unregulated power supply. That again implies that solar power profitability collapse as well. And the result of that of course is that the exponential growth in solar power production which we now take for granted and which we expect will lead us all the way to zero emissions could come to a full stop as well.
This is already a rapidly increasing problem in California where more and more renewable energy is denied access to the grid because there simply isn’t enough demand for it just then or because the grid cannot handle it. But it is also becoming an increasing problem in Germany where the strong growth and high concentration of solar power increasingly is destroying the power prices just when they produce the most.
The need for biiiig, cheeeeap grid batteries are now becoming increasingly critical for the the exponential growth in solar and wind power to continue.
We fear that the self-destructive force on power prices, of exponential growth in unregulated solar power, is some kind of Solar-hara-kiri process with respect to its own profitability. And that it has the potential to develop along a curve of ”first gradually, then suddenly”. And when/if that happens the exponential growth in unregulated solar power production should naturally come to a screeching halt.
The resolution of the problem is of course the eventual arrival of biiiig, cheeeap grid batteries which then again will sett solar power production free to resume its exponential growth.
Feeding solar and wind power supply into a fossil system is easy to start with. Then very difficult. It is easy to build unregulated solar and wind power supply into a flexible fossil system. It is easy to infuse unregulated power supply (Solar and Wind) into a power system where there is lots and lots of fossil based power. Fossil supply can then back-off and make room for solar and wind power whenever the sun is shining or the wind is blowing and then ramp up again when it suddenly disappear. But when unregulated, renewable energy supply keeps growing it becomes harder and harder to infuse yet more of it into the system as the fossil flexibility is increasingly eroded. That’s when yet more supply of solar and wind is no longer pushing aside fossil supply but instead is starting to destroy their own prices.
Solar power produces 80% of its production during 20% of the hours in the year. Solar power has however a much more tightly focused production profile than wind. In Germany in 2023 some 80% of all solar power production was concentrated on only 20% of the hours of the year. For wind power the 80% share of production was spread out over 50% of the hours in the year. The reason is of course that the wind can blow both summer and winter and night and day. Solar power is instead focused during the day and during summer. It has a much higher concentration of production.
Power prices tend to collapse when demand is fully covered by unregulated power supply. When solar power production grows rapidly in a given power system then its high production concentration will eventually lead to full saturation during certain hours of the year. Demand during these hours will then be fully supplied and covered by unregulated power like solar, wind, run-of-river hydro and other unregulated supply. That is great as it means that the fossil share in these hours then are close to zero.
The problem is that power markets, more than any other commodity market in the world, are extremely sensitive to imbalances in supply and demand. A little bit too little supply and the power price can spike up to close to infinity. A little bit too much supply and the price crashes to zero or negative.
When unregulated power supply reaches full demand saturation during certain hours then power prices tend to collapse because it is so easy to get a little bit too much supply.
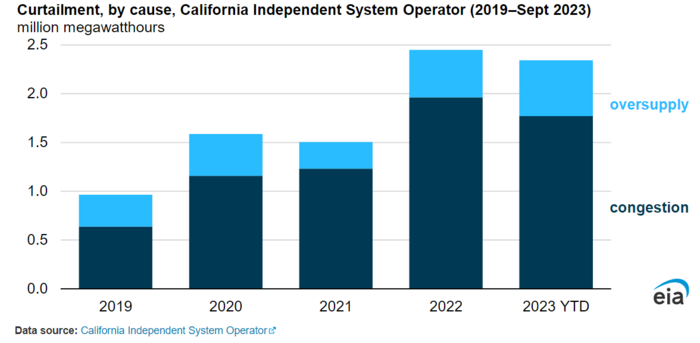
It is not a problem when power prices collapse for just a few hours per year. But the number of hours affected is growing rapidly many places. The US EIA highlighted in October 2023 (”Solar and wind power curtailments are rising in California”) that this is becoming a bigger and bigger problem in California. Since 2019 the power system operator there has been forced to curtail supply of unregulated power more and more. There simply isn’t enough demand in certain hours to meet the spikes in unregulated supply or the grid isn’t up to the task of distributing the unregulated supply in the system.
So when producers of unregulated supply produces the most they increasingly are denied access to sell it into the grid or if they are allowed to sell it into the grid the price is close to zero or even negative.
US EIA: Solar and wind power curtailments are rising in California
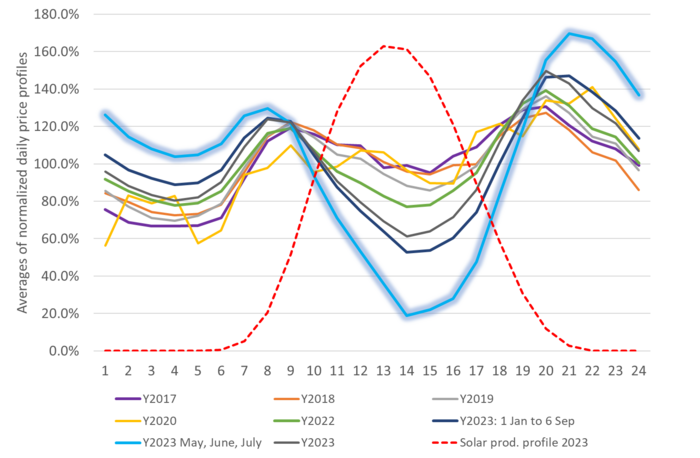
Germany is increasingly affected as booming solar production is depressing prices more and more. This is now also a rapidly increasing problem in Germany where rapid growth in supply of solar and wind power together increasingly are forcing power prices lower just when they produce the most.
Average German power prices for hour 1 to 24 for certain periods and years. Highly concentrated supply of solar power during summer and during the day is increasingly forcing power prices towards zero during these periods
It is like ”Solar hara-kiri” when increasing supply of solar power is killing its own prices and profits. It was not a big problem economically when only a few hours are affected. But as more and more hours are affected it is becoming an increasing problem. It is like ”Solar hara-kiri” where rapidly rising supply of solar power is increasingly killing its own prices. With that it is killing its profits. And if profits are killed than new-build and growth in supply will typically slow down rapidly as well.
This is probably not a big problem globally yet as the global power system is still predominantly fueled by fossil fuels which can back off when renewable energy spikes up. But in certain pockets of the world where penetration of unregulated power supply has reached high levels it is becoming an increasing problem. Like in California and in Germany.
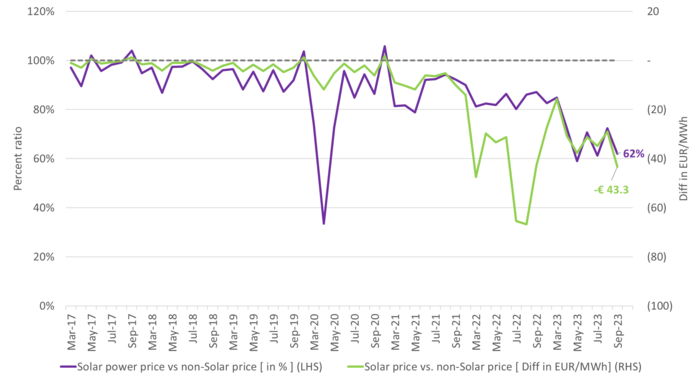
The volume weighted solar power price in September 2023 in Germany had a 38% discount to power prices during non-solar power hours. And the discount looks like it is rapidly getting bigger and bigger.
The monthly average volume weighted solar power price versus the average volume weighted non-solar power price weighted by the inverse profile. In Germany in September 2023 solar power producers only achieved 62% of the average price during hours of the day when the sun wasn’t shining.
First gradually, then suddenly. There is a clear risk here that this progresses along a process of ”first gradually, then suddenly”. This is already what we have seen over the past couple of years: The discount for what solar power earns when it produces power versus what the power price is when it is not producing is increasing rapidly as more and more unregulated power supply hits right into the ”demand ceiling”. The inflicted pain from this process so far has to a large degree been masked by incredibly high natural gas prices. So even if the profitability for solar power has been eroding, the average power price in the system has been much higher than usual due to high natural gas and CO2 prices.
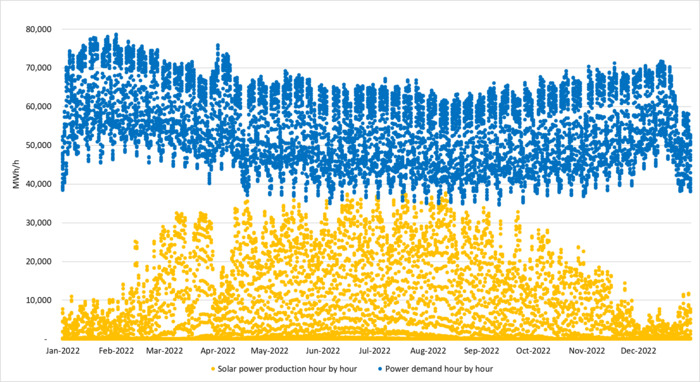
Graphing all the individual hourly data for solar power and power demand in Germany in 2022 we see that solar power alone is not yet reaching full saturation versus demand.
Germany 2022: Hourly German power demand and solar power supply in 2022. A total of 8760 hours for each in consecutive order. Her showing only Demand and Solar power production
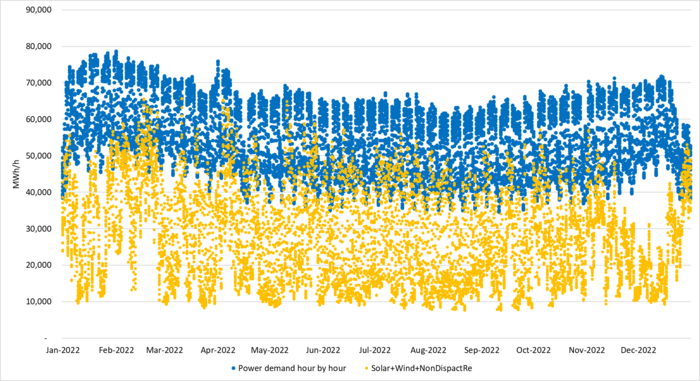
The unregulated power supply is increasingly hitting the ”demand ceiling”. If we now add all the other sources of unregulated power supply, predominantly offshore and onshore wind and run of river, then we get the following picture where we see that unregulated German power supply increasingly is hitting right up and into the ”demand ceiling”. In those instances there will be no, flexible fossil power supply left to back off and that is typically when power prices collapse or go negative.
Germany 2022: Hourly German power demand (blue dots) and unregulated supply (solar, wind, run of river,…) in orange dots. A total of 8760 hours for each in consecutive order.
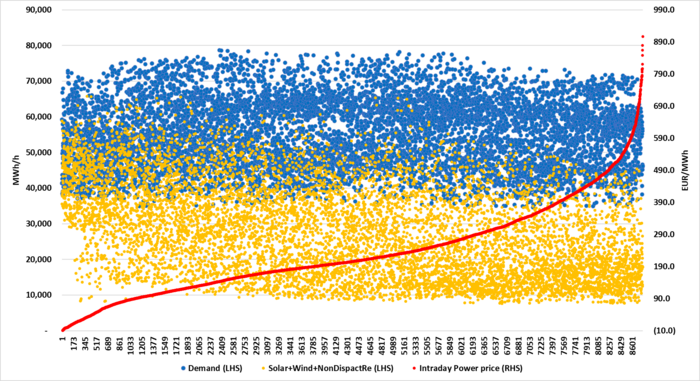
High unregulated power supply saturation vs demand implied lower power prices in 2022. Sorting 8760 individual power prices in Germany from Y2022 from lowest to highest shows that power German power prices were strongly related to the penetration of unregulated power supply. In the following graph, we have sorted the data from the lowest price to the highest price in the year 2022. Prices were ireasingly depressed when unregulated power penetrated up and into the ”demand ceiling”. Natural gas prices were extreme in 2022 and overall power prices were exceptionally high for that reason as well. But the tendency of price destruction in relation to high levels of unregulated power vs demand is clear.
Germany 2022: Hourly German power demand (blue dots) and unregulated supply (solar, wind, run of river,…) in orange dots. A total of 8760 hours. Sorted according to how hourly power prices were from lowest to highest.
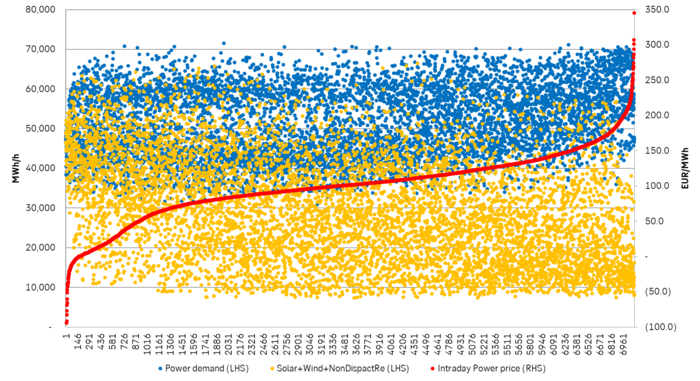
The unregulated power supply penetrating vs demand was even deeper in 2023. If we make the same graph for the year 2023 from 1 Jan to 20 Oct, we can see how the unregulated power is penetrating deeper and deeper into the power ”demand ceiling”. As a result the solar power discount vs. non-solar power hours from March to September in 2023 reached an even higher discount in 2023 than in 2022.
2023 year to 20 October: Hourly German power demand (blue dots) and unregulated supply (solar, wind, run of river,…) in orange dots. A total of 8760 hours. Sorted according to how hourly power prices were from lowest to highest. German power demand was down 8.3% YoY in H1-2023 due to the European energy crisis and still very high power prices
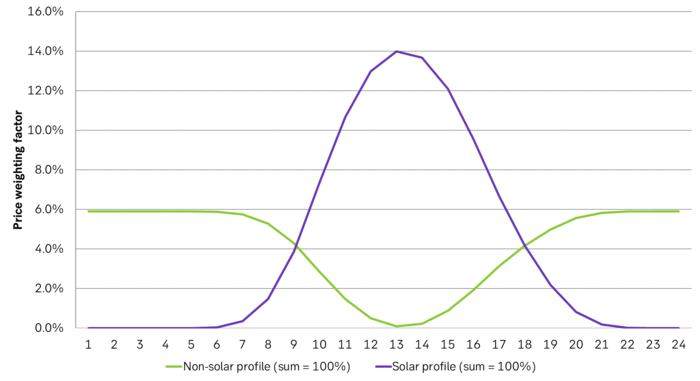
Solar power hours and non-solar power hours is not given as a clear cut-off, but a gradual one. In the following graph given as average profiles of the year from hour 1 to hour 24. First calculated explicitly for solar power production and then the inverse is calculated from that one. These solar power profiles can then be calculated for each individual day in the year giving individual inverse-curves on a daily basis.
The daily ”solar power production profiles” and the ”non-solar power production profiles” typically looks like this graph but calculated individually per day as solar power production varies from day to day and through the seasons. The solar power production profile is explicitly given by the actual solar power production that day while the non-solar power profile is derived directly from this and the inverse of it on a daily basis.
The exponential growth in solar and wind power is likely to slow down in the years to come as grid constraints and lack of power cables is holding up growth in renewable energy with waiting times for access of 5-10 years:
”Offshore wind auction’s lack of bids must be ‘wake-up call’ for UK, says RWE chief”
FT: ”Gridlock: how a lack of power lines will delay the age of renewables”
FT: ”Will there be enough cables for the clean energy transition?”
Parts of the Brent crude curve dipping into the high $50ies/b. Brent crude fell 2.3% over the week to Friday. It closed the week at $61.29/b, a slight gain on the day, but also traded to a low of $60.14/b that same day and just barely avoided trading into the $50ies/b. This morning it is risk-on in equities which seems to help industrial metals a little higher. But no such luck for oil. It is down 0.8% at $60.8/b. This week looks set for Brent crude to dip its feet in the $50ies/b. The Brent 3mth contract actually traded into the high $50ies/b on Friday.

The front-end backwardation has been on a weakening foot and is now about to fully disappear. The lowest point of the crude oil curve has also moved steadily lower and lower and its discount to the 5yr contract is now $6.8/b. A solid contango. The Brent 3mth contract did actually dip into the $50ies/b intraday on Friday when it traded to a low point of $59.93/b.
More weakness to come as lots of oil at sea comes to ports. Mid-East OPEC countries have boosted exports along with lower post summer consumption and higher production. The result is highly visibly in oil at sea which increased by 17 mb to 1,311 mb over the week to Sunday. Up 185 mb since mid-August. On its way to discharge at a port somewhere over the coming month or two.
Don’t forget that the oil market path ahead is all down to OPEC+. Remember that what is playing out in the oil market now is all by design by OPEC+. The group has decided that the unwind of the voluntary cuts is what it wants to do. In a combination of meeting demand from consumers as well as taking back market share. But we need to remember that how this plays out going forward is all at the mercy of what OPEC+ decides to do. It will halt the unwinding at some point. It will revert to cuts instead of unwind at some point.
A few months with Brent at $55/b and 40-50 US shale oil rigs kicked out may be what is needed. We think OPEC+ needs to see the exit of another 40-50 drilling rigs in the US shale oil patches to set US shale oil production on a path to of a 1 mb/d year on year decline Dec-25 to Dec-26. We are not there yet. But a 2-3 months period with Brent crude averaging $55/b would probably do it.
Oil on water increased 17 mb over the week to Sunday while oil in transit increased by 23 mb. So less oil was standing still. More was moving.

Crude oil floating storage (stationary more than 7 days). Down 11 mb over week to Sunday

The lowest point of the Brent crude oil curve versus the 5yr contract. Weakest so far this year.

Crude oil 1mth to 3mth time-spreads. Dubai held out strongly through summer, but then that center of strength fell apart in late September and has been leading weakness in crude curves lower since then.

Rebounding along with most markets. But concerns over solidity of Gaza peace may also contribute. Brent crude fell 0.8% yesterday to $61.91/b and its lowest close since May this year. This morning it is bouncing up 0.9% to $62.5/b along with a softer USD amid positive sentiment with both equities and industrial metals moving higher. Concerns that the peace in Gaza may be less solid than what one might hope for also yields some support to Brent. Bets on tech stocks are rebounding, defying fears of trade war. Money moving back into markets. Gold continues upwards its strong trend and a softer dollar helps it higher today as well.
US crude & products probably rose 5.6 mb last week (API) versus a normal seasonal decline of 2.4 mb. The US API last night partial and thus indicative data for US oil inventories. Their data indicates that US crude stocks rose 7.4 mb last week, gasoline stocks rose 3.0 mb while Distillate stocks fell 4.8 mb. Altogether an increase in commercial crude and product stocks of 5.6 mb. Commercial US crude and product stocks normally decline by 2.4 mb this time of year. So seasonally adjusted the US inventories rose 8 mb last week according to the indicative numbers by the API. That is a lot. Also, the counter seasonal trend of rising stocks versus normally declining stocks this time of year looks on a solid pace of continuation. If the API is correct then total US crude and product stocks would stand 41 mb higher than one year ago and 6 mb higher than the 2015-19 average. And if we combine this with our knowledge of a sharp increase in production and exports by OPEC(+) and a large increase in oil at sea, then the current trend in US oil inventories looks set to continue. So higher stocks and lower crude oil prices until OPEC(+) switch to cuts. Actual US oil inventory data today at 18:00 CET.
US commercial crude and product stocks rising to 1293 mb in week 41 if last nights indicative numbers from API are correct.

Crude oil soon coming to a port near you. OPEC has lifted production sharply higher this autumn. At the same time demand for oil in the Middle-East has fallen as we have moved out of summer heat and crude oil burn for power for air-conditioning. The Middle-East oil producers have thus been able to lift exports higher on both accounts. Crude oil and condensates on water has shot up by 177 mb since mid-August. This oil is now on its way to ports around the world. And when they arrive, it will likely help to lift stocks onshore higher. That is probably when we will lose the last bit of front-end backwardation the the crude oil curves. That will help to drive the front-month Brent crude oil price down to the $60/b line and revisit the high $50ies/b. Then the eyes will be all back on OPEC+ when they meet in early November and then again in early December.
Crude oil and condensates at sea have moved straight up by 177 mb since mid-August as OPEC(+) has produced more, consumed less and exported more.

When it starts to move lower it moves rather quickly. Gaza, China, IEA. Brent crude is down 2.1% today to $62/b after having traded as high as $66.58/b last Thursday and above $70/b in late September. The sell-off follows the truce/peace in Gaze, a flareup in US-China trade and yet another bearish oil outlook from the IEA.
A lasting peace in Gaze could drive crude oil at sea to onshore stocks. A lasting peace in Gaza would probably calm down the Houthis and thus allow more normal shipments of crude oil to sail through the Suez Canal, the Red Sea and out through the Bab-el-Mandeb Strait. Crude oil at sea has risen from 48 mb in April to now 91 mb versus a pre-Covid normal of about 50-60 mb. The rise to 91 mb is probably the result of crude sailing around Africa to be shot to pieces by the Houthis. If sailings were to normalize through the Suez Canal, then it could free up some 40 mb in transit at sea moving onshore into stocks.
The US-China trade conflict is of course bearish for demand if it continues.
Bearish IEA yet again. Getting closer to 2026. Credibility rises. We expect OPEC to cut end of 2025. The bearish monthly report from the IEA is what it is, but the closer we get to 2026, the more likely the IEA is of being ball-park right in its outlook. In its monthly report today the IEA estimates that the need for crude oil from OPEC in 2026 will be 25.4 mb/d versus production by the group in September of 29.1 mb/d. The group thus needs to do some serious cutting at the end of 2025 if it wants to keep the market balanced and avoid inventories from skyrocketing. Given that IEA is correct that is. We do however expect OPEC to implement cuts to avoid a large increase in inventories in Q1-26. The group will probably revert to cuts either at its early December meeting when they discuss production for January or in early January when they discuss production for February. The oil price will likely head yet lower until the group reverts to cuts.
Dubai: The Mid-East anchor dragging crude oil lower. Surplus emerging in Mid-East pricing. Crude oil prices held surprisingly strong all through the summer. A sign and a key source of that strength came from the strength in the front-end backwardation of the Dubai crude oil curve. It held out strong from mid-June and all until late September with an average 1-3mth time-spread premium of $1.8/b from mid-June to end of September. The 1-3mth time-spreads for Brent and WTI however were in steady deterioration from late June while their flat prices probably were held up by the strength coming from the Persian Gulf. Then in late September the strength in the Dubai curve suddenly collapsed. Since the start of October it has been weaker than both the Brent and the WTI curves. The Dubai 1-3mth time-spread now only stands at $0.25/b. The Middle East is now exporting more as it is producing more and also consuming less following elevated summer crude burn for power (Aircon) etc.
The only bear-element missing is a sudden and solid rise in OECD stocks. The only thing that is missing for the bear-case everyone have been waiting for is a solid, visible rise in OECD stocks in general and US oil stocks specifically. So watch out for US API indications tomorrow and official US oil inventories on Thursday.
No sign of any kind of fire-sale of oil from Saudi Arabia yet. To what we can see, Saudi Arabia is not at all struggling to sell its oil. It only lowered its Official Selling Prices (OSPs) to Asia marginally for November. A surplus market + Saudi determination to sell its oil to the market would normally lead to a sharp lowering of Saudi OSPs to Asia. Not yet at least and not for November.
The 5yr contract close to fixed at $68/b. Of importance with respect to how far down oil can/will go. When the oil market moves into a surplus then the spot price starts to trade in a large discount to the 5yr contract. Typically $10-15/b below the 5yr contract on average in bear-years (2009, 2015, 2016, 2020). But the 5yr contract is usually pulled lower as well thus making this approach a moving target. But the 5yr contract price has now been rock solidly been pegged to $68/b since 2022. And in the 2022 bull-year (Brent spot average $99/b), the 5yr contract only went to $72/b on average. If we assume that the same goes for the downside and that 2026 is a bear-year then the 5yr goes to $64/b while the spot is trading at a $10-15/b discount to that. That would imply an average spot price next year of $49-54/b. But that is if OPEC doesn’t revert to cuts and instead keeps production flowing. We think OPEC(+) will trim/cut production as needed into 2026 to prevent a huge build-up in global oil stocks and a crash in prices. But for now we are still heading lower. Into the $50ies/b.


Australien och USA investerar 8,5 miljarder USD för försörjningskedja av kritiska mineraler
Brent crude set to dip its feet into the high $50ies/b this week

Vad guldets uppgång egentligen betyder för världen

Spotpriset på guld över 4300 USD och silver över 54 USD
Crude oil soon coming to a port near you

OPEC+ missar produktionsmål, stöder oljepriserna

Goldman Sachs höjer prognosen för guld, tror priset når 4900 USD

Ett samtal om guld, olja, fjärrvärme och förnybar energi

Blykalla och amerikanska Oklo inleder ett samarbete
Guld nära 4000 USD och silver 50 USD, därför kan de fortsätta stiga
-
 Nyheter4 veckor sedan
OPEC+ missar produktionsmål, stöder oljepriserna
-
 Nyheter2 veckor sedan
Goldman Sachs höjer prognosen för guld, tror priset når 4900 USD
-
 Nyheter4 veckor sedan
Ett samtal om guld, olja, fjärrvärme och förnybar energi
-
 Nyheter3 veckor sedan
Blykalla och amerikanska Oklo inleder ett samarbete
-
 Nyheter3 veckor sedan
Guld nära 4000 USD och silver 50 USD, därför kan de fortsätta stiga
-
Analys4 veckor sedan
Are Ukraine’s attacks on Russian energy infrastructure working?
-

 Nyheter4 veckor sedan
Guldpriset uppe på nya höjder, nu 3750 USD
-
Nyheter3 veckor sedan
Ett samtal om guld, olja, koppar och stål