

Analys
The most important data point in the global oil market will be published on Friday 28 June


US crude oil production has been booming for more than a decade. Interrupted by two setbacks in response to sharp price declines. The US boom has created large waves in the global oil market and made life very difficult for OPEC(+). Brent crude has not traded below USD 70/b since Dec-2021 and over the past year, it has averaged USD 84/b. US shale oil production would typically boom with such a price level historically. However, there has been zero growth in US crude oil production from Sep-2023 to Mar-2024. This may be partially due to a cold US winter, but something fundamentally seems to have changed. We recently visited a range of US E&P and oil services companies in Houston. The general view was that there would be zero growth in US crude oil production YoY to May 2025. If so and if it also is a general shift to sideways US crude oil production beyond that point, it will be a tremendous shift for the global oil market. It will massively improve the position of OPEC+. It will also sharply change our perception of the forever booming US shale oil supply. But ”the proof is in the pudding” and that is data. More specifically the US monthly, controlled oil production data is to be published on Friday 28 June.
The most important data point in the global oil market will be published on Friday 28 June. The US EIA will then publish its monthly revised and controlled oil production data for April. Following years of booming growth, the US crude oil production has now gone sideways from September 2023 to March 2024. Is this a temporary blip in the growth curve due to a hard and cold US winter or is it the early signs of a huge, fundamental shift where US crude oil production moves from a decade of booming growth to flat-lining horizontal production?
We recently visited a range of E&P and oil services companies in Houston. The general view there was that US crude oil production will be no higher in May 2025 than it is in May 2024. I.e. zero growth.
It may sound undramatic, but if it plays out it is a huge change for the global oil market. It will significantly strengthen the position of OPEC+ and its ability to steer the oil price to a suitable level of its choosing.
The data point on Friday will tell us more about whether the companies we met are correct in their assessment of non-growth in the coming 12 months or whether production growth will accelerate yet again following a slowdown during winter.
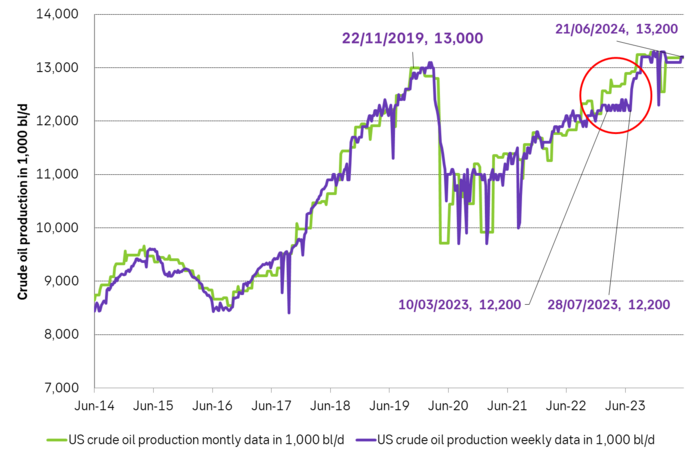
The US releases weekly estimates for its crude oil production but these are rough, temporary estimates. The market was fooled by these weekly numbers last year when the weekly numbers pointed to a steady production of around 12.2 m b/d from March to July while actual monthly data, with a substantial lag in publishing, showed that production was rising strongly.
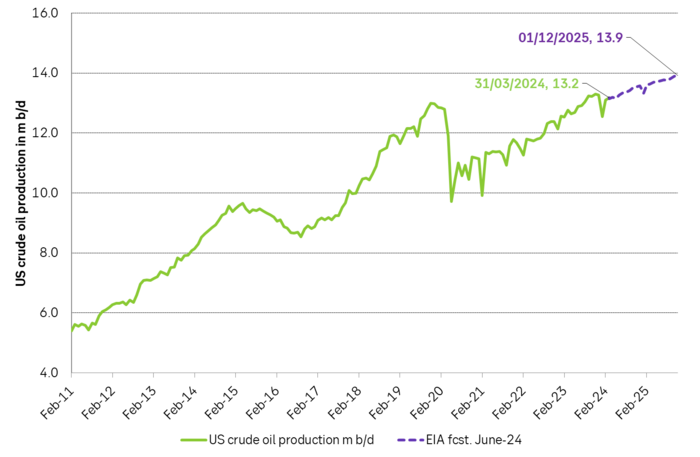
The real data are the monthly, controlled data. These data will be the ”proof of the pudding” of whether US shale oil production now is about to shift from a decade of booming growth to instead flat-line sideways or whether it will drift gradually higher as projected by the US EIA in its latest Short-Term Energy Outlook.
US crude oil production given by weekly data and monthly data. Note that the monthly, controlled data comes with a significant lag. The market was thus navigating along the weekly data which showed ”sideways at 12.2 m b/d” for a significant period last year until actual data showed otherwise with a time-lag.
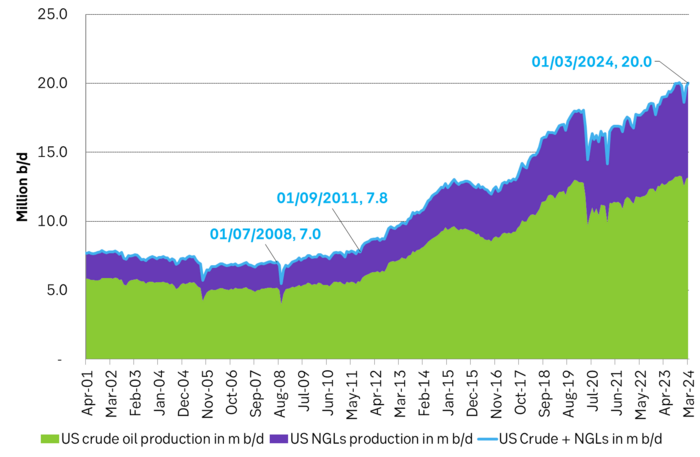
If we add in Natural Gas Liquids and zoom out to include history back to 2001 we see an almost uninterrupted boom in supply since Sep 2011 with a few setbacks. At first glance, this graph gives little support to a belief that US crude oil production now suddenly will go sideways. Simple extrapolation of the graph indicates growth, growth, growth.
US crude and liquids production has boomed since September 2011
However. The latest actual data point for US crude oil production is for March with a reading of 13.18 m b/d. What stands out is that production then was still below the September level of 13.25 m b/d.
The world has gotten used to forever growing US crude oil production due to the US shale oil revolution, with shorter periods of sharp production declines as a result of sharp price declines.
But the Brent crude oil price hasn’t collapsed. Instead, it is trading solidly in the range of USD 70-80-90/b. The front-month Brent crude oil contract hasn’t closed below USD 70/b since December 2021.
Experiences from the last 15 years would imply wild production growth and activity in US shale oil production at current crude oil prices. But US crude oil production has now basically gone sideways to lower from September to March.
The big, big question is thus: Are we now witnessing the early innings of a big change in US shale oil production where we shift from booming growth to flat-lining of production?
If we zoom in we can see that US liquids production has flat-lined since September 2023. Is the flat-lining from Sep to Mar due to the cold winter so that we’ll see a revival into spring and summer or are we witnessing the early signs of a huge change in the global oil market where US crude oil production goes from booming growth to flat-line production.

The message from Houston was that there will be no growth in US crude oil production until May 2025. SEB recently visited oil and gas producers and services providers in Houston to take the pulse of the oil and gas business. Especially so the US shale oil and shale gas business. What we found was an unusually homogeneous view among the companies we met concerning both the state of the situation and the outlook. The sentiment was kind of peculiar. Everybody was making money and was kind of happy about that, but there was no enthusiasm as the growth and boom years were gone. The unanimous view was that US crude oil production would be no higher one year from now than it is today. I.e. flat-lining from here.
The arguments for flat-lining of US crude oil production here onward were many.
1) The shale oil business has ”grown up” and matured with a focus on profits rather than growth for the sake of growth.
2) Bankruptcies and M&As have consolidated the shale oil companies into larger, fewer public companies now accounting for up to 75% of total production. Investors in these companies have little interest/appetite for growth after having burned their fingers during a decade and a half of capital destruction. These investors may also be skeptical of the longevity of the US shale oil business. Better to fully utilize the current shale oil infrastructure steadily over the coming years and return profits to shareholders than to invest in yet more infrastructure capacity and growth.
3) The remaining 25% of shale oil producers which are in private hands have limited scope for growth as they lack pipeline capacity for bringing more crude oil from field to market. Associated nat gas production is also a problem/bottleneck as flaring is forbidden in many places and pipes to transport nat gas from field to market are limited.
4) The low-hanging fruits of volume productivity have been harvested. Drilling and fracking are now mostly running 24/7 and most new wells today are all ”long wells” of around 3 miles. So hard to shave off yet another day in terms of ”drilling yet faster” and the length of the wells has increasingly reached their natural optimal length.
5) The average ”rock quality” of wells drilled in the US in 2024 will be of slightly lower quality than in 2023 and 2025 will be slightly lower quality than 2024. That is not to say that the US, or more specifically the Permian basin, is quickly running out of shale oil resources. But this will be a slight headwind. There is also an increasing insight into the fact that US shale oil resources are indeed finite and that it is now time to harvest values over the coming 5-10 years. One company we met in Houston argued that US shale oil production would now move sideways for 6-7 years and then overall production decline would set in.
The US shale oil revolution can be divided into three main phases. Each phase is probably equally revolutionary as the other in terms of impact on the global oil market.
1) The boom phase. It started after 2008 but didn’t accelerate in force before the ”Arab Spring” erupted and drove the oil price to USD 110/b from 2011 to 2014. It was talked down time and time again, but it continued to boom and re-boom to the point that today it is almost impossible to envision that it won’t just continue to boom or at least grow forever.
2) The plateau phase. The low-hanging fruits of productivity growth have been harvested. The highest quality resources have been utilized. The halfway point of resources has been extracted. Consolidation, normalization, and maturity of the business has been reached. Production goes sideways.
3) The decline phase. Eventually, the resources will have been extracted to the point that production unavoidably starts to decline.
Moving from phase one to phase two may be almost as shocking for the oil market as the experience of phase 1. The discussions we had with oil producers and services companies in Houston may indicate that we may now be moving from phase one to phase two. That there will be zero shale oil production growth YoY in 2025 and that production then may go sideways for 6-7 years before phase three sets in.
US EIA June STEO report with EIA’s projection for US crude oil production to Dec-2025. Softer growth, but still growth.
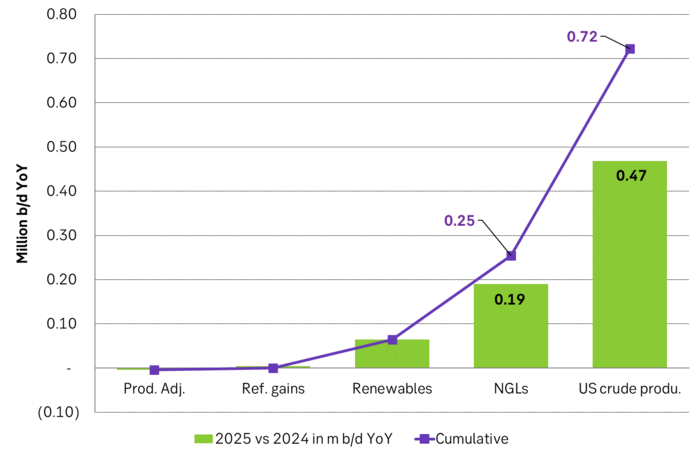
US EIA June STEO report with YoY outlook growth for 2025. Projects that US crude production will grow by 0.47 m b/d YoY in 2025 and that total liquids will grow by 720 k b/d YoY.
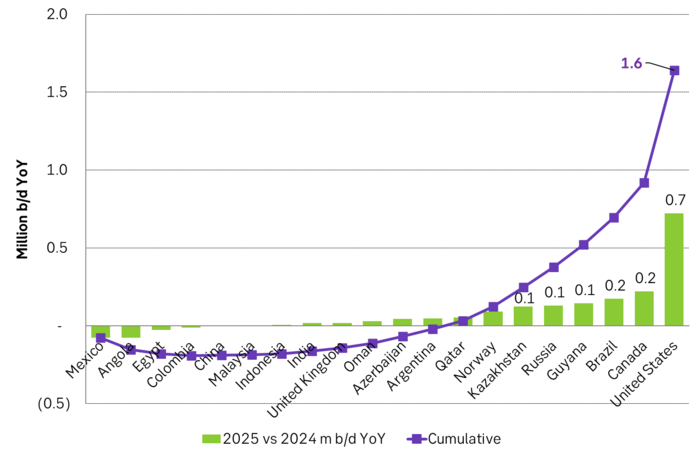
US EIA June STEO report with outlook for production growth by country in 2025. This shows how big the US production growth of 0.7 m b/d YoY really is compared to other producers around the world
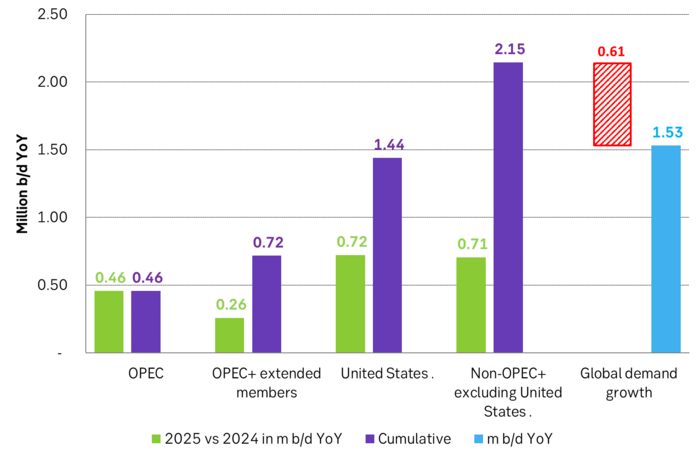
US EIA June STEO report with projected global growth in supply and demand YoY in 2025. Solid demand growth, but even strong supply growth with little room for OPEC+ to expand. Production growth by non-OPEC+ will basically cover global oil demand growth.
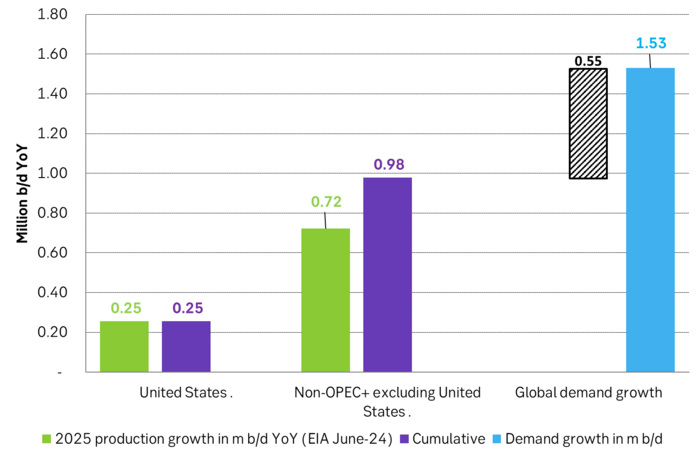
But if there instead is zero growth in US crude oil production in 2025 and the US liquids production only grows by 0.25 m b/d YoY due to NGLs and biofuels, then suddenly there is room for OPEC+ to put some of its current production cuts back into the market. Thus growth/no-growth in US shale oil production will be of huge importance for OPEC+ in 2025. If there is no growth in US shale oil then OPEC+ will have a much better position to control the oil price to where it wants it.
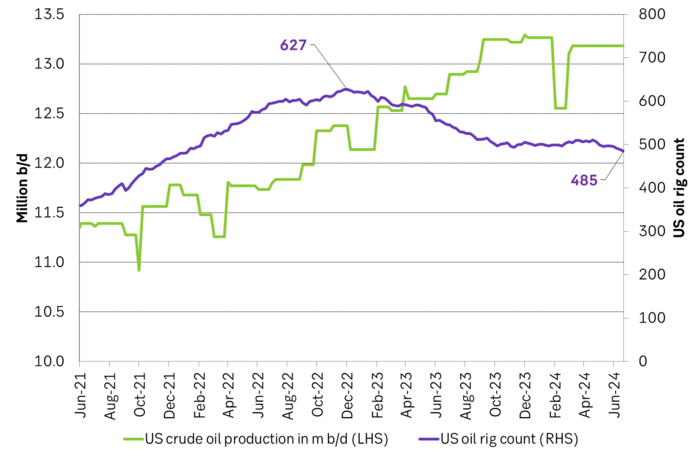
US crude oil production and drilling rig count
After reaching USD 66.78 per barrel on Friday afternoon, Brent crude has since traded mostly sideways, yet dipping lower this morning. The market appears to be consolidating last week’s sharp gains, with Brent now easing back to around USD 64.5 per barrel, roughly USD 2.3 below Friday’s peak but still well above last Monday’s USD 60.07 low.

The rebound last week was initially driven by Washington’s decision to blacklist Russia’s two largest oil producers, Rosneft and Lukoil, which together account for nearly half of the country’s crude exports. The move sparked a wave of risk repricing and short covering, with Brent rallying almost 10% from Monday’s trough. Yet, the market is now questioning the actual effectiveness of the sanctions. While a full blacklisting sounds dramatic, the mechanisms for enforcement remain unclear, and so far, there are no signs of disrupted Russian flows.
In practice, these measures are unlikely to materially affect Russian supply or revenues in the near term, yet we have now seen Indian refiners reportedly paused new orders for Russian barrels pending government guidance. BPCL is expected to issue a replacement spot tender within 7–10 days, potentially sourcing crude from non-sanctioned entities instead. Meanwhile, Lukoil is exploring the sale of overseas assets, and Germany has requested extra time for Rosneft to reorganize its refining interests in the country.
The broader market focus is now shifting toward this week’s Fed decision and Sunday’s OPEC+ meeting, both seen as potential short-term price drivers. Renewed U.S.-China trade dialogue ahead of Trump’s meeting with President Xi Jinping in South Korea is also lending some macro support.
In short, while the White House’s latest move adds to geopolitical noise, it does not yet represent a true supply disruption. If Washington had intended to apply real pressure, it could have advanced the long-standing Senate bill enforcing secondary sanctions on buyers of Russian oil, legislation with overwhelming backing, or delivered more direct military assistance to Ukraine. Instead, the latest action looks more like political theatre than policy shift, projecting toughness without imposing material economic pain.
Still, while the immediate supply impact appears limited, the episode has refocused attention on Russia’s export vulnerability and underscored the ongoing geopolitical risk premium in the oil market. Combined with counter-seasonal draws in U.S. crude inventories, record-high barrels at sea, and ongoing uncertainty ahead of the OPEC+ meeting, short-term fundamentals remain somewhat tighter than the broader surplus story suggests.
i.e., the sanctions may prove mostly symbolic, but the combination of geopolitics and uneven inventory draws is likely to keep Brent volatile around the low to mid-USD 60s in the days ahead.
Hesitant today. Brent jumped to an intraday high of $66.36/b yesterday after having touched an intraday low of $60.07/b on Monday as Indian and Chinese buyers cancelled some Russian oil purchases and instead redirected their purchases towards the Middle East due to the news US sanctions. Brent is falling back 0.4% this morning to $65.8/b.
It’s our strong view that the only sensible thing is to sell this rally. In all Trump’s unpredictability he has become increasingly predictable. Again and again he has rumbled about how he is going to be tough on Putin. Punish Putin if he won’t agree to peace in Ukraine. Recent rumbling was about the Tomahawk rockets which Trump threatened on 10 October and 12 October to sell/send to Ukraine. Then on 17 October he said that ”the U.S. didn’t want to give away weapons (Tomahawks) it needs”.
All of Trump’s threats towards Putin have been hot air. So far Trump’s threats have been all hot air and threats which later have evaporated after ”great talks with Putin”. After all these repetitions it is very hard to believe that this time will be any different. The new sanctions won’t take effect before 21. November. Trump has already said that: ”he was hoping that these new sanctions would be very short-lived in any case”. Come 21. November these new sanctions will either evaporate like all the other threats Trump has thrown at Putin before fading them. Or the sanctions will be postponed by another 4 weeks or 8 weeks with the appearance that Trump is even more angry with Putin. But so far Trump has done nothing that hurt Putin/Russia. We can’t imagine that this will be different. The only way forward in our view for a propre lasting peace in Ukraine is to turn Ukraine into defensive porcupine equipped with a stinging tail if need be.
China will likely stand up to Trump if new sanctions really materialize on 21 Nov. Just one country has really stood up to Trump in his tariff trade war this year: China. China has come of age and strength. I will no longer be bullied. Trump upped tariffs. China responded in kind. Trump cut China off from high-end computer chips. China put on the breaks on rare earth metals. China won’t be bullied any more and it has the power to stand up. Some Chinese state-owned companies like Sinopec have cancelled some of their Russian purchases. But China’s Foreign Ministry spokesperson Guo Jiakun has stated that China “oppose unilateral sanctions which lack a basis in international law and authorization of the UN Security Council”. Thus no one, not even the US shall unilaterally dictate China from whom they can buy oil or not. This is yet another opportunity for China to show its new strength and stand up to Trump in a show of force. Exactly how China choses to play this remains to be seen. But China won’t be bullied by over something as important as its oil purchases. So best guess here is that China will defy Trump on this. But probably China won’t need to make a bid deal over this. Firstly because these new sanctions will either evaporate as all the other threats or be postponed once we get to 21 November. Secondly because the sanctions are explicit towards US persons and companies but only ”may” be enforced versus non-US entities.
Sanctions is not a reduction in global supply of oil. Just some added layer of friction. Anyhow, the new sanctions won’t reduce the supply of Russian crude oil to the market. It will only increase the friction in the market with yet more need for the shadow fleet and ship to ship transfer of Russian oil to dodge the sanctions. If they materialize at all.
The jump in crude oil prices is probably due to redirections of crude purchases to the Mid-East and not because all speculators are now turned bullish. Has oil rallied because all speculators now suddenly have turned bullish? We don’t think so. Brent crude has probably jumped because some Indian and Chinese oil purchasers of have redirected their purchases from Russia towards the Mid-East just in case the sanctions really materializes on 21 November.
Parts of the Brent crude curve dipping into the high $50ies/b. Brent crude fell 2.3% over the week to Friday. It closed the week at $61.29/b, a slight gain on the day, but also traded to a low of $60.14/b that same day and just barely avoided trading into the $50ies/b. This morning it is risk-on in equities which seems to help industrial metals a little higher. But no such luck for oil. It is down 0.8% at $60.8/b. This week looks set for Brent crude to dip its feet in the $50ies/b. The Brent 3mth contract actually traded into the high $50ies/b on Friday.
The front-end backwardation has been on a weakening foot and is now about to fully disappear. The lowest point of the crude oil curve has also moved steadily lower and lower and its discount to the 5yr contract is now $6.8/b. A solid contango. The Brent 3mth contract did actually dip into the $50ies/b intraday on Friday when it traded to a low point of $59.93/b.
More weakness to come as lots of oil at sea comes to ports. Mid-East OPEC countries have boosted exports along with lower post summer consumption and higher production. The result is highly visibly in oil at sea which increased by 17 mb to 1,311 mb over the week to Sunday. Up 185 mb since mid-August. On its way to discharge at a port somewhere over the coming month or two.
Don’t forget that the oil market path ahead is all down to OPEC+. Remember that what is playing out in the oil market now is all by design by OPEC+. The group has decided that the unwind of the voluntary cuts is what it wants to do. In a combination of meeting demand from consumers as well as taking back market share. But we need to remember that how this plays out going forward is all at the mercy of what OPEC+ decides to do. It will halt the unwinding at some point. It will revert to cuts instead of unwind at some point.
A few months with Brent at $55/b and 40-50 US shale oil rigs kicked out may be what is needed. We think OPEC+ needs to see the exit of another 40-50 drilling rigs in the US shale oil patches to set US shale oil production on a path to of a 1 mb/d year on year decline Dec-25 to Dec-26. We are not there yet. But a 2-3 months period with Brent crude averaging $55/b would probably do it.
Oil on water increased 17 mb over the week to Sunday while oil in transit increased by 23 mb. So less oil was standing still. More was moving.

Crude oil floating storage (stationary more than 7 days). Down 11 mb over week to Sunday

The lowest point of the Brent crude oil curve versus the 5yr contract. Weakest so far this year.

Crude oil 1mth to 3mth time-spreads. Dubai held out strongly through summer, but then that center of strength fell apart in late September and has been leading weakness in crude curves lower since then.


Brent slips to USD 64.5: sanction doubts and OPEC focus reduce gains

Ett samtal om guld, silver, olja och skog
Sell the rally. Trump has become predictable in his unpredictability

Gruvbolaget Boliden överträffade analytikernas förväntningar

Australien och USA investerar 8,5 miljarder USD för försörjningskedja av kritiska mineraler

Goldman Sachs höjer prognosen för guld, tror priset når 4900 USD

Blykalla och amerikanska Oklo inleder ett samarbete

Guld nära 4000 USD och silver 50 USD, därför kan de fortsätta stiga

Leading Edge Materials är på rätt plats i rätt tid

Nytt prisrekord, guld stiger över 4000 USD
-
 Nyheter3 veckor sedan
Goldman Sachs höjer prognosen för guld, tror priset når 4900 USD
-
 Nyheter4 veckor sedan
Blykalla och amerikanska Oklo inleder ett samarbete
-
 Nyheter4 veckor sedan
Guld nära 4000 USD och silver 50 USD, därför kan de fortsätta stiga
-
 Nyheter2 veckor sedan
Leading Edge Materials är på rätt plats i rätt tid
-
 Nyheter3 veckor sedan
Nytt prisrekord, guld stiger över 4000 USD
-

 Nyheter4 veckor sedan
Ett samtal om guld, olja, koppar och stål
-
Analys4 veckor sedan
OPEC+ will likely unwind 500 kb/d of voluntary quotas in October. But a full unwind of 1.5 mb/d in one go could be in the cards
-

 Nyheter4 veckor sedan
Neptune Energy bekräftar enorma litiumfyndigheter i Tyskland