

Analys
SEB – Råvarukommentarer, 28 april 2014

Rekommendationer
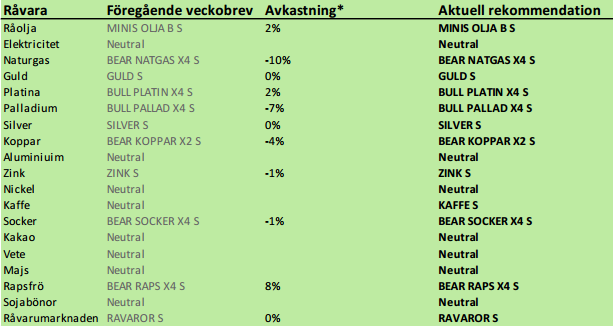
Kort sammanfattning
Basmetallerna stigit överlag med nickel i täten. Ädelmetallerna har också utvecklats positivt den senaste veckan. Faktorerna som påverkar marknaden är Ryssland/Ukraina, frågetecken kring Kinas ekonomi, väder för jordbruksprodukterna, Indonesiens exportförbud på malm och strejkerna och olönsamheten i Sydafrikas platinagruvor (men även andra ädelmetaller).
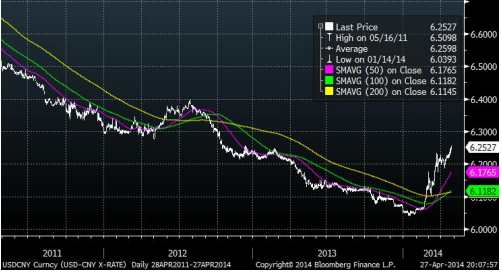
Inköpschefsindex för tillverkningsindustrin i Kina kom in på 48.3 i april, upp obetydligt från 48 i mars. Ett PMI under 50 innebär att tillverkningssektorn krymper, eller kommer att krympa, eftersom PMI är en framåtblickande indikator. Siffran fick renminbin (CNY), Kinas officiella valuta, att falla ytterligare mot andra valutor. Att allt inte står rätt till i Kina ser man av att den stadiga trenden av starkare valuta bröts i slutet av februari. Sedan dess har valutan försvagats hastigt. En svagare valuta gör att importvaror, som t ex sojabönor blir dyrare, vilket sänker efterfrågan. USDCNY har gått från 6 till 6.25 sedan början av året. Nedan ser vi kursutvecklingen på USDCNY.
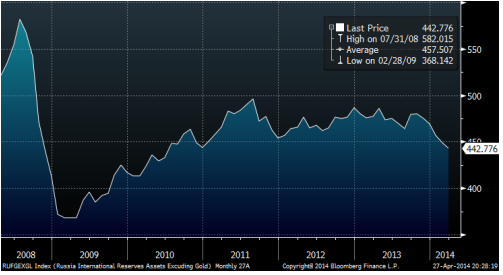
Försvagningen i den ryska rubeln har varit stor sedan början av året, men avviker inte från trenden som den haft sedan 2011. Rysslands valutareserv (exklusive guld) har sedan november minskat med 40 miljarder dollar till 442 miljarder. Detta har skett trots att oljepriset har varit stabilt och att centralbanken höjt räntan. Vi ser utvecklingen nedan.
Våra främsta rekommendationer är köpt position i platina och palladium, men även silver och guld (sist bland ädelmetallerna). Kaffe tror vi kan ha mer uppsida, även om huvuddelen av haussen förmodligen är över. Olja är en råvara som borde gå ner så småningom.
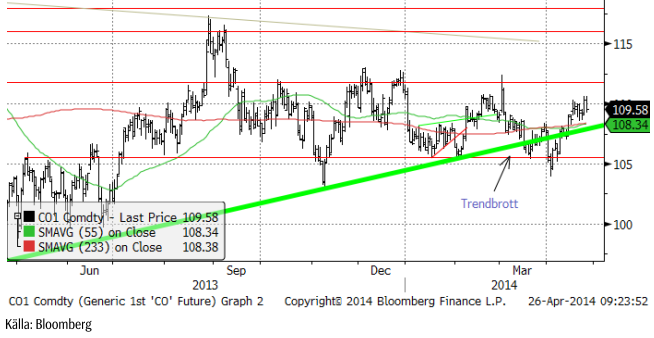
Råolja – Brent
Oljepriset har stigit då Libyen faktiskt inte fått igång oljeexporten än, som marknaden hoppats på. Tekniskt är priset uppe igen på 110 dollar, som är i den övre delen av det senaste halvårets prisintervall. Vi tror att man ska sälja på dessa nivåer.
Råoljelagren nådde i veckan rekordhöga 397.66 miljoner fat. Lagersiffran exkluderar olja som finns i strategiska lager.
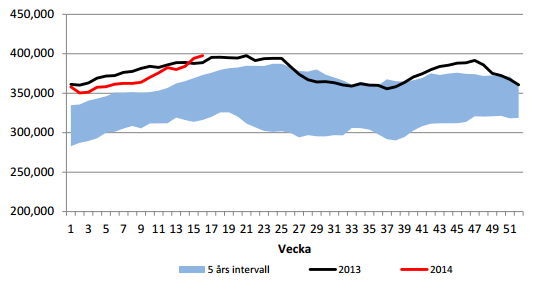
Importen sjönk från förra veckan; högre import var alltså inte den drivande faktorn bakom de rekordhöga lagren.
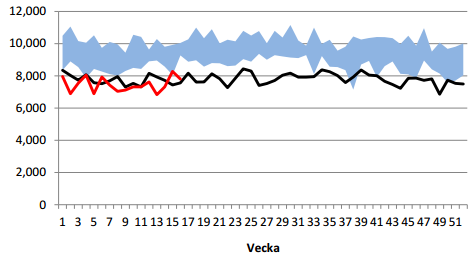
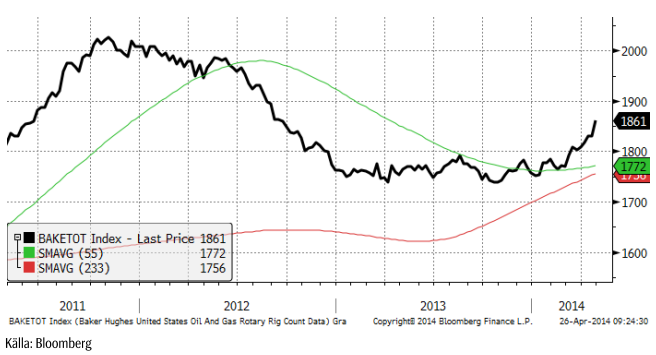
Baker Hughes rig count tog ett jättekliv med 30 riggar i fredagens statistik, till 1861 riggar i drift. USA har nu 107 fler oljeriggar som borrar jämfört med för ett år sedan.
Petrobras nådde rekordproduktion både i sina Campos och Santos-fält, med 428,000 fat per dag.
Vi rekommenderar en kort position i olja, t ex med MINIS OLJA B S eller MINIS OLJA A S.
Elektricitet
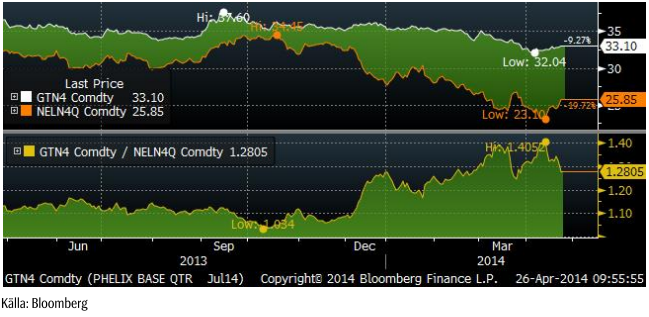
Elpriset gick i veckan upp och testade motståndet för det senaste halvårets fallande pristrend. Än har dock inte ett brott skett. Om priset stiger på måndag har vi dock ett trendbrott och går över till köprekommendation på elen.
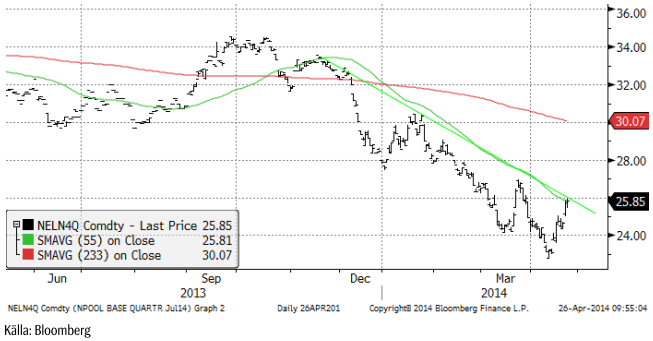
Phelix Baseload för det tredje kvartalet, Tysklands motsvarande kontrakt som tredje kvartalet på Nasdaq Commodities, ligger nu 40.5% över det nordiska. Förra veckan var skillnaden 34%. Den nordiska marknaden är alltså rekordbillig i jämförelse med den kontinentala.
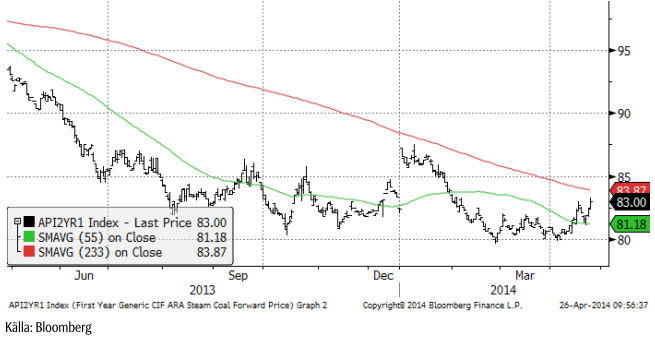
Priset på utsläppsrätter föll relativt kraftigt i veckan som gick, men priset på kol tycks ha funnit en botten, åtminstone på kort sikt.
I förra veckobrevet för två veckor sedan, skrev vi att elmarknaden söker en botten. Det är möjligt att marknaden har gjort det, men det är ännu lite för tidigt att gå över till köprekommendation, så vi behåller neutral.
Naturgas
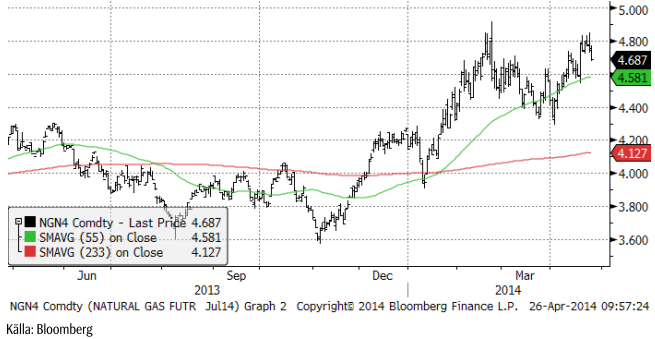
Tekniskt noterar vi att priset vänt ner igen i fredags från 4.80-nivån. Ökningen av borr-riggar enligt Baker Hughes rig count avser till stor del riggar för gas, vilket naturligtvis beror på att priset är attraktivt nu. Vi fortsätter med säljrekommendation (köp av BEAR NATGAS X4 S).
Koppar
Efter det dramatiska prisfallet i mars, har kopparpriset etablerat en botten mellan 6600 och 6700 dollar per ton. Sentimentet har successivt förbättrats, då den lagerökning som följde på (och förmodligen föranledde) prisfallet, inte har blivit mer än en rekyl i en fallande lagertrend. Det är förmodligen en missräkning för de eller den person som sålde ner koppar från 7200 till 6500 dollar…
Nyheten att Kinas Reservbyrå köpte 200,000 ton koppar i mars – efter prisfallet – skickar signalen att ”SRB” kan köpa mer om priset är attraktivt. Den fysiska premien har ökat med 70-80 dollar CIF Shanghai också. The International Copper Study Group publicerade statistik som visar ett förvånande underskott på 53 kt i januari. I december hade marknaden ett överskott på 17 kt.
Tekniskt är det kortisktiga motståndet brutet och allt pekar på en rekyl upp mot 7000 dollar.
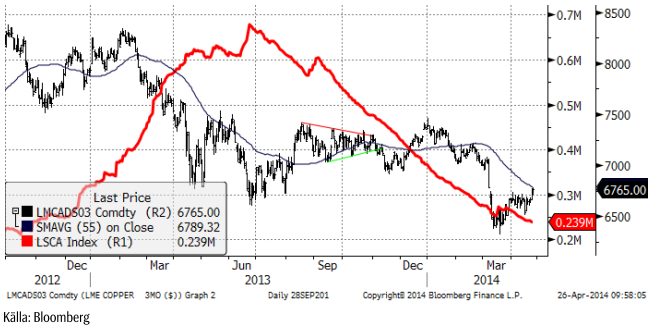
Vi går över till köprekommendation på koppar.
Aluminium
Den senaste prisuppgången på aluminium har tappat momentum. Prisuppgången startade när LME informerade om att lösningen på kö-problemet för att få ut fysisk metall, skjuts på framtiden efter att RUSAL klandrat förslaget och fått rätt i domstolen. Marknaden har identifierat ett nytt prisintervall av stöd på 1850 och motstånd på 1900. Den senaste tiden är folk i marknaden lite vänligare inställda till aluminium med olika intressen på köpsidan. Både konsumenter och investerare tycks vara redo att successivt öka köpta positioner. Tekniskt kan ett brott av motståndet vid 1900 signalera ytterligare potential på uppsidan, till nästa motstånd vid 1950. Som vi har noterat tidigare, kommer det att vara en tidskrävande process att ta hand om de mycket stora lagren, som skapats under flera år av överproduktion. Marknaden har blivit mer positiv och tagit ett kliv uppåt prismässigt, men man ska vara beredd på att priset kan fastna inom ett prisintervall ett tag.
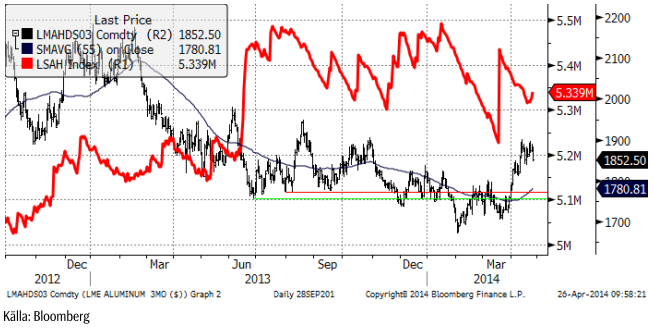
Vi fortsätter med neutral rekommendation på aluminium.
Zink
Zinkpriset balanserar på ett motstånd och marknaden försöker ta priset över det. Efterfrågan tycks ha ökat den senaste tiden med ILZG:s senaste prognos om en 4.5% ökning av efterfrågan under 2014. Fredagens handel var dock en besvikelse för dem som ville se ett högre pris. Mot slutet av handelsdagen ökade säljintresset och veckans slutkurs var i närheten av veckans lägsta pris vid 2054 dollar. Det förefaller som om aluminium liksom zink är marknader där fundamenta förbättras långsamt, samtidigt som det finns en oro för att det finns stora lager utanför börserna och börsernas lagerstatistik. Liksom med koppar har det gått rykten om att metall finns i lager, pantsatt i finansieringsaffärer i Kina. Oron gäller att dessa lager plötsligt ska dumpas på marknaden. Marknaden är känslig för detta, eftersom det under så lång tid varit lagerökningar och lagren kommer att ta lång tid att beta av.
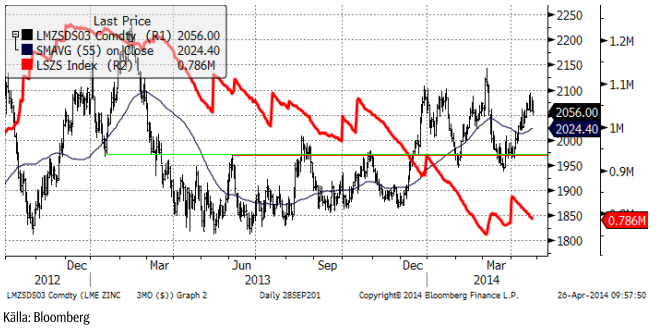
Vi rekommenderar köp av ZINK S.
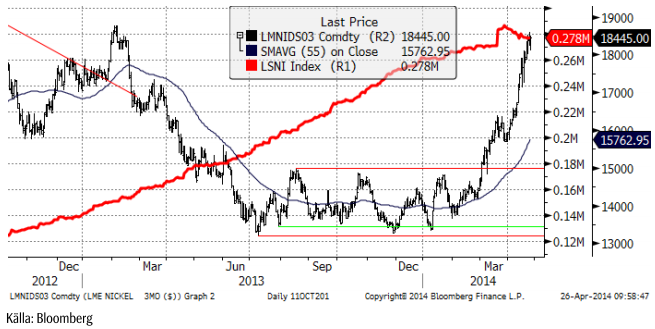
Nickel
Nickelpriset steg ytterligare 3% under förra veckan. Det blev den fjärde veckan i rad med stigande priser. Av de senaste 12 veckorna, är det bara en när priset sjönk. Det finns inte mycket nyheter att förtälja om den här veckan. Det är samma faktorer som verkar på marknaden som tidigare: Indonesien och Ryssland. På SEB:s råvarumarknadsdag i torsdags, var nickel ett hett samtalsämne. Flera delegater framhöll att Ryssland och Indonesien tillsammans står för ungefär hälften av det globala utbudet. Ur den synvinkeln är det inte förvånande att priset stiger.
De senaste årens prisintervall går mellan 10,000 och 30,000 dollar. 10,000 utgör botten efter Lehman-krisen. Haussen efter monetär- och infrastrukturstimulan fick upp priset till 30,000 dollar. Dagens pris på 18,500 dollar ser inte så utmanande ut, ur det perspektivet. Det sammanfattades dock att priset kan ha stigit för fort och att en stor del av prisuppgången består av en riskpremie för den eventualitet att de två riskfaktorerna ”Ryssland” och ”Indonesien” skulle förvärras. Så länge det indonesiska exportförbudet är på plats, stängs dock möjligheten för en rekyl successivt och snabbare om lageruppbyggnaden hos bruken för rostfritt stål fortsätter.
Guld
Guldpriset vände uppåt vid en teknisk stödnivå i veckan som gick, vilket är positivt.
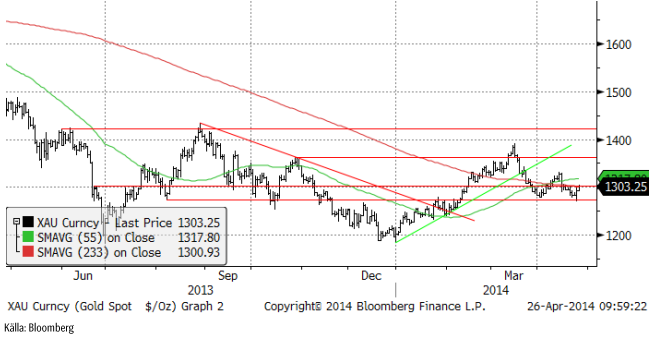
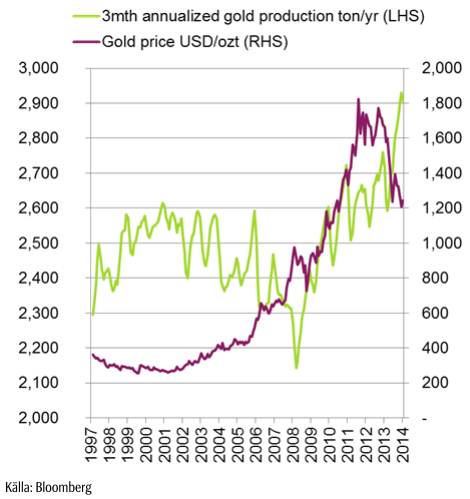
Global guldproduktion har nu kommit upp till en årstakt på 2900 ton enligt de senaste uppgifterna från januari 2014. Guldpriset började stiga år 2000 när global gruvproduktion började falla efter att ha varit stigande sedan början av 80-talet. När gruvproduktionen började stiga år 2009 var det många som drog slutsatsen att boomen för guld var slut, liksom 1980, men då drog guldpriset vidare uppåt på grund av finanskrisen och ökningen av penningmängden. Nu lägger vi successivt finanskrisen bakom oss, samtidigt som gruvproduktionen stiger.
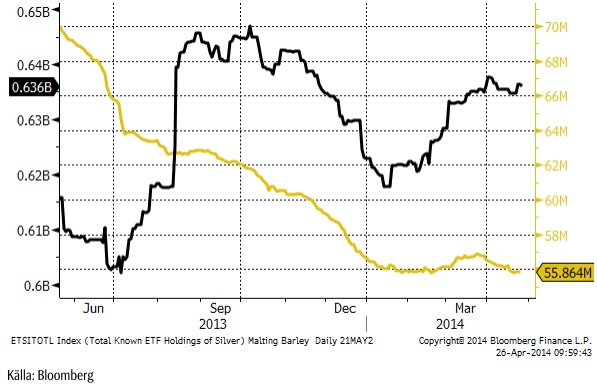
ETF-investerare har sålt både guld och silver hittills i april, som vi ser av diagrammet nedan.
Vi är dock försiktigt positiva till guld och rekommenderar köp av GULD S.
Silver
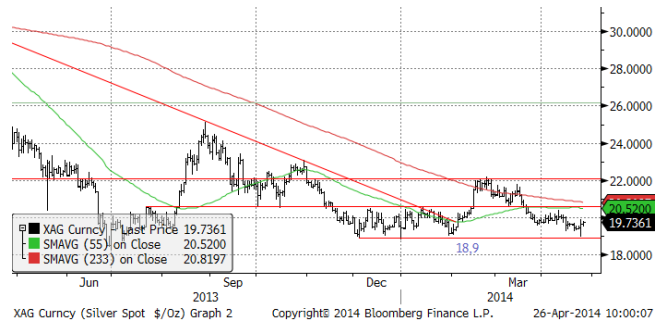
Silverpriset uppvisar ett starkare tekniskt stöd på 18.9 dollar per ozt än vad guldet gör. Med tanke på att silver är åt det ”billiga” hållet i relation till guldpriset, föredrar vi att köpa silver istället för guld, om vi får välja mellan de två ädelmetallerna.
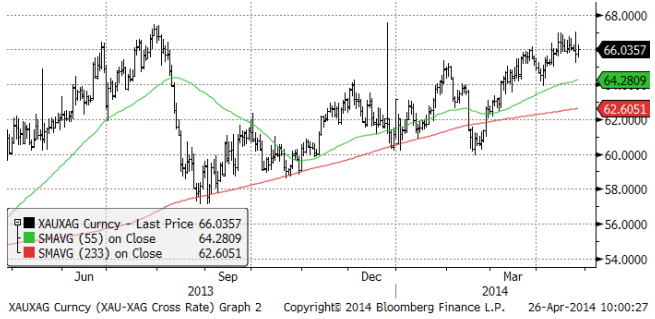
Nedan ser vi ett diagram över priset på guld uttryckt i silver. Det går alltså över 66 finuns silver på varje fin-uns av guld. Som vi ser är det en hög nivå, dvs silver är billigt i förhållande till guld.
Vi anser att silver är mer köpvärt än guld och skulle vilja köpa på de här nivåerna. Vi rekommenderar köp av SILVER S.
Platina & Palladium
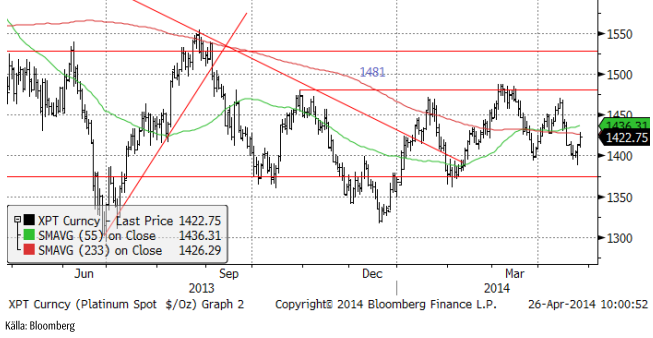
Marknaden orkade inte, eller ville inte, handla upp platina till över det tekniska motståndet vid 1481 dollar per ozt. Reaktionen blev att priset föll ner till 1400 dollar, där det dock fanns köpare. Nu är priset återigen på väg uppåt, kanske för att testa 1481 igen.
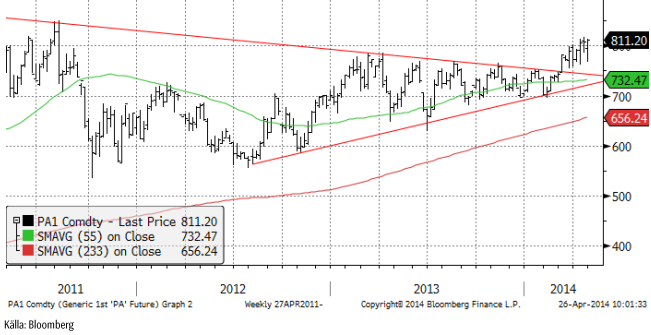
Priset på palladium har svårt at lämna utbrottsnivån, men har tagit sig förbi 810 dollar. I fredags kväll stängde marknaden på veckans högsta pris, 811.20 dollar. All-time-high är 861 dollar och den är inom räckhåll nu.
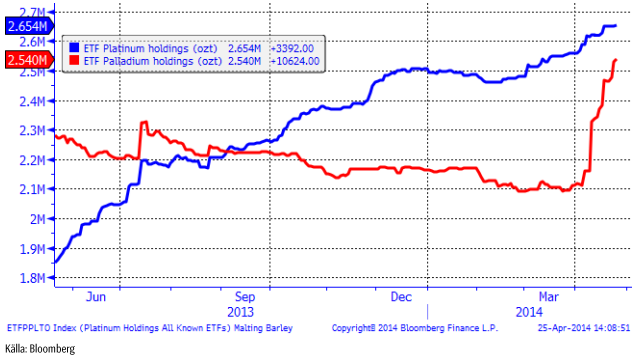
Nedan ser vi hur många finuns platina och palladium som investerare innehar via börshandlade fonder. Platina attraherar successivt mer pengar. Det är inte konstigt, med tanke på att aktiemarknaden gått upp i ett och ett halvt år, utan att vinsterna har ökat. Räntemarknaden erbjuder nära noll i ränta och på kreditmarknaden måste man placera i junk-junk för att få några procents ränta. Platina erbjuder då en asymmetrisk risk, där man vet att gruvindustrin inte går runt på dagens metallpris. Det finns ingen trigger egentligen för högre pris, annat än att priset är för lågt i förhållande till produktionskostnaden. Å andra sidan är förmodligen nedsidan väldigt begränsad, åtminstone på lång sikt.
Medan pengar har gått in i platina successivt, har de forsat in i palladium den här månaden. Ryssland är den viktigaste och dominerande producenten av palladium.
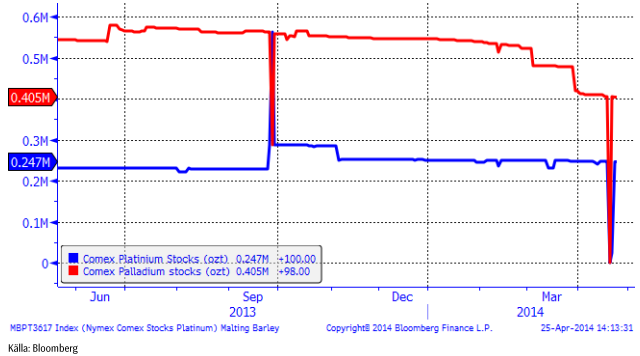
Nedan ser vi lagren av metall vid COMEX i New York.
Arbetsmarknadskonflikten i Sydafrika har ännu inte närmat sig en lösning. Ett erbjudande från de tre största platina-producenterna, förkastades av AMCU-fackföreningen tidigare i veckan. Det var ännu ett försök att få slut på den konflikt som pågått i tre månader och sänker produktionen. Efter att anbudet förkastades, har gruvbolagen börjat skicka SMS till var och en av de strejkande, med ett erbjudande att ta ställning till. Konflikten har alltså nått en helt ny nivå.
Inget av de tre stora gruvbolagen Anglo American Platinum Ltd., Impala Platinum Holdings Ltd. and Lonmin Plc går med vinst.
Hittills har konflikten kostat gruvbolagen ytterligare 1.3 miljarder dollar i förlorade försäljningsintäkter och gruvarbetarna nästan hälften så mycket i förlorade löner. De som har insyn i säger till media att det verkar som om gruvbolagen och fackföreningen står långt ifrån varandra och att det i grund och botten är en bransch som fundamentalt sätt är i kris. Det innebär med andra ord att produktionen behöver dras ner och frågan är vem av de tre stora gruvbolagen som drar sig ur. I vilket fall lär detta innebära att utbudet minskar. Om utbudet minskar, så lär detta innebära att priset på platina stiger.
Vi rekommenderar köp av PLATINA S och PALLADIUM S, eller BULL PLATINA X4 S eller BULL PALLAD X4 S.
För den som vill ta ännu mer risk, finns nu även BULL PALLAD X5 S.
Kaffe
Kaffepriset steg kraftigt i tisdags efter att det schweiziska företaget Volcafe, en del av den stora råvaruhandelskoncernen ED&F Man, emailat ut en analys som sade att torkan i Brasilien tidigare i år resulterar i en 18% lägre produktion i landet än vad som tidigare väntats. Detta orsakar i sin tur ett globalt underskott på 11 miljoner säckar av kaffe (arabica och robusta sammantaget). En säck väger 60 Kg.
Volcafe sänkte skördeestimatet avseende Arabica i Brasilien med 6.2 miljoner säckar till 28.4 miljoner. Däremot höjde Volcafe estimatet för hur mycket av robusta-sorten som landet kommer att producera 2014/15 med 1 miljon säckar till 17.1 miljoner. Sammantaget väntar sig alltså Volcafe en skörd på 45.5 miljoner säckar.
Detta är förvisso en högre siffra än vad den brasilianska producentgruppen CNC estimerade för ett par veckor sedan, och som vi skrev om i förra veckobrevet, men som alltid spelar det roll vem som säger något och Volcafe har mycket gott anseende och mångas öra. CNC estimerade skörden till 40.1 – 43.3 miljoner säckar.
Skörden i Brasilien började nu i april och ökar normalt i intensitet fram till juni och juli. Just nu är det skyfall över odlingarna, vilket fördröjer arbetet.
På lite längre sikt har produktionen fått en knäck. Enligt Hackett Financial Advisors kommer det globala underskottet av kaffe (produktion – konsumtion) att bli 10 miljoner säckar även för nästa marknadsföringsår, 2015-16.
Vi har skrivit om allt detta i tidigare veckobrev, men när nu en ny våg av varningar kommer från marknadskännare med etablerat renommé, ger det marknaden ytterligare stöd och befäster prisnivån.
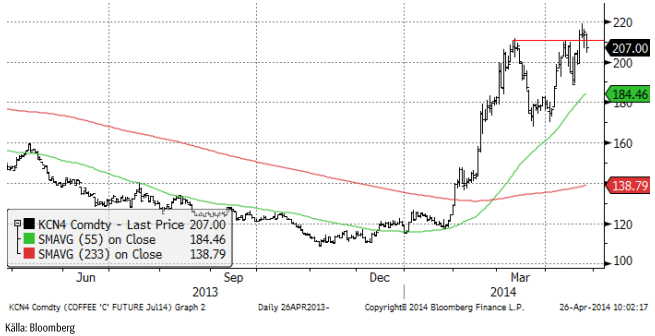
Vi byter fot och går in i KAFFE S igen. Om priset faller under 200 tar vi dock en stop-loss.
Kakao
Priset på kakao ligger i ett etablerat prisintervall med botten på 2895 och tak på 3047. Som vi har skrivit förut, verkar det som om priset lockat fram större utbud och även om det talas om ökande efterfrågan på kakao, t ex i USA, pekar marknadens beteende på att prisets stimulans på utbudet kan väga tyngre. Priset föll ganska tungt i torsdags och fredags.
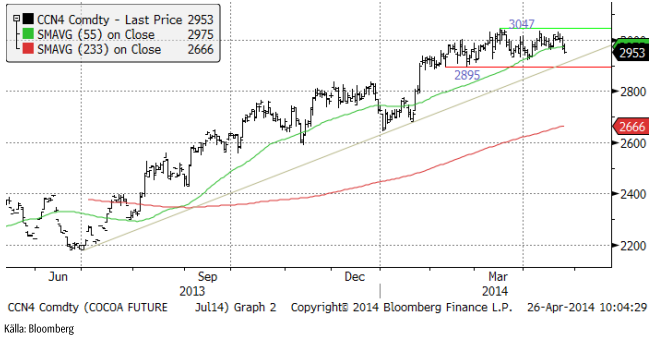
Vi rekommenderar en neutral position vid dagens situation.
[box]SEB Veckobrev Veckans råvarukommentar är producerat av SEB Merchant Banking och publiceras i samarbete och med tillstånd på Råvarumarknaden.se[/box]
Disclaimer
The information in this document has been compiled by SEB Merchant Banking, a division within Skandinaviska Enskilda Banken AB (publ) (“SEB”).
Opinions contained in this report represent the bank’s present opinion only and are subject to change without notice. All information contained in this report has been compiled in good faith from sources believed to be reliable. However, no representation or warranty, expressed or implied, is made with respect to the completeness or accuracy of its contents and the information is not to be relied upon as authoritative. Anyone considering taking actions based upon the content of this document is urged to base his or her investment decisions upon such investigations as he or she deems necessary. This document is being provided as information only, and no specific actions are being solicited as a result of it; to the extent permitted by law, no liability whatsoever is accepted for any direct or consequential loss arising from use of this document or its contents.
About SEB
SEB is a public company incorporated in Stockholm, Sweden, with limited liability. It is a participant at major Nordic and other European Regulated Markets and Multilateral Trading Facilities (as well as some non-European equivalent markets) for trading in financial instruments, such as markets operated by NASDAQ OMX, NYSE Euronext, London Stock Exchange, Deutsche Börse, Swiss Exchanges, Turquoise and Chi-X. SEB is authorized and regulated by Finansinspektionen in Sweden; it is authorized and subject to limited regulation by the Financial Services Authority for the conduct of designated investment business in the UK, and is subject to the provisions of relevant regulators in all other jurisdictions where SEB conducts operations. SEB Merchant Banking. All rights reserved.


The latest weekly report from the US DOE showed a substantial drawdown across key petroleum categories, adding more upside potential to the fundamental picture.

Commercial crude inventories (excl. SPR) fell by 5.8 million barrels, bringing total inventories down to 415.1 million barrels. Now sitting 11% below the five-year seasonal norm and placed in the lowest 2015-2022 range (see picture below).
Product inventories also tightened further last week. Gasoline inventories declined by 2.1 million barrels, with reductions seen in both finished gasoline and blending components. Current gasoline levels are about 3% below the five-year average for this time of year.
Among products, the most notable move came in diesel, where inventories dropped by almost 4.1 million barrels, deepening the deficit to around 20% below seasonal norms – continuing to underscore the persistent supply tightness in diesel markets.
The only area of inventory growth was in propane/propylene, which posted a significant 5.1-million-barrel build and now stands 9% above the five-year average.
Total commercial petroleum inventories (crude plus refined products) declined by 4.2 million barrels on the week, reinforcing the overall tightening of US crude and products.


A classic case of “buy the rumor, sell the news” played out in oil markets, as Brent crude has dropped sharply – down nearly USD 10 per barrel since yesterday evening – following Iran’s retaliatory strike on a U.S. air base in Qatar. The immediate reaction was: “That was it?” The strike followed a carefully calibrated, non-escalatory playbook, avoiding direct threats to energy infrastructure or disruption of shipping through the Strait of Hormuz – thus calming worst-case fears.
After Monday morning’s sharp spike to USD 81.4 per barrel, triggered by the U.S. bombing of Iranian nuclear facilities, oil prices drifted sideways in anticipation of a potential Iranian response. That response came with advance warning and caused limited physical damage. Early this morning, both the U.S. President and Iranian state media announced a ceasefire, effectively placing a lid on the immediate conflict risk – at least for now.
As a result, Brent crude has now fallen by a total of USD 12 from Monday’s peak, currently trading around USD 69 per barrel.
Looking beyond geopolitics, the market will now shift its focus to the upcoming OPEC+ meeting in early July. Saudi Arabia’s decision to increase output earlier this year – despite falling prices – has drawn renewed attention considering recent developments. Some suggest this was a response to U.S. pressure to offset potential Iranian supply losses.
However, consensus is that the move was driven more by internal OPEC+ dynamics. After years of curbing production to support prices, Riyadh had grown frustrated with quota-busting by several members (notably Kazakhstan). With Saudi Arabia cutting up to 2 million barrels per day – roughly 2% of global supply – returns were diminishing, and the risk of losing market share was rising. The production increase is widely seen as an effort to reassert leadership and restore discipline within the group.
That said, the FT recently stated that, the Saudis remain wary of past missteps. In 2018, Riyadh ramped up output at Trump’s request ahead of Iran sanctions, only to see prices collapse when the U.S. granted broad waivers – triggering oversupply. Officials have reportedly made it clear they don’t intend to repeat that mistake.
The recent visit by President Trump to Saudi Arabia, which included agreements on AI, defense, and nuclear cooperation, suggests a broader strategic alignment. This has fueled speculation about a quiet “pump-for-politics” deal behind recent production moves.
Looking ahead, oil prices have now retraced the entire rally sparked by the June 13 Israel–Iran escalation. This retreat provides more political and policy space for both the U.S. and Saudi Arabia. Specifically, it makes it easier for Riyadh to scale back its three recent production hikes of 411,000 barrels each, potentially returning to more moderate increases of 137,000 barrels for August and September.
In short: with no major loss of Iranian supply to the market, OPEC+ – led by Saudi Arabia – no longer needs to compensate for a disruption that hasn’t materialized, especially not to please the U.S. at the cost of its own market strategy. As the Saudis themselves have signaled, they are unlikely to repeat previous mistakes.
Conclusion: With Brent now in the high USD 60s, buying oil looks fundamentally justified. The geopolitical premium has deflated, but tensions between Israel and Iran remain unresolved – and the risk of missteps and renewed escalation still lingers. In fact, even this morning, reports have emerged of renewed missile fire despite the declared “truce.” The path forward may be calmer – but it is far from stable.
Analys
A muted price reaction. Market looks relaxed, but it is still on edge waiting for what Iran will do
Brent crossed the 80-line this morning but quickly fell back assigning limited probability for Iran choosing to close the Strait of Hormuz. Brent traded in a range of USD 70.56 – 79.04/b last week as the market fluctuated between ”Iran wants a deal” and ”US is about to attack Iran”. At the end of the week though, Donald Trump managed to convince markets (and probably also Iran) that he would make a decision within two weeks. I.e. no imminent attack. Previously when when he has talked about ”making a decision within two weeks” he has often ended up doing nothing in the end. The oil market relaxed as a result and the week ended at USD 77.01/b which is just USD 6/b above the year to date average of USD 71/b.

Brent jumped to USD 81.4/b this morning, the highest since mid-January, but then quickly fell back to a current price of USD 78.2/b which is only up 1.5% versus the close on Friday. As such the market is pricing a fairly low probability that Iran will actually close the Strait of Hormuz. Probably because it will hurt Iranian oil exports as well as the global oil market.
It was however all smoke and mirrors. Deception. The US attacked Iran on Saturday. The attack involved 125 warplanes, submarines and surface warships and 14 bunker buster bombs were dropped on Iranian nuclear sites including Fordow, Natanz and Isfahan. In response the Iranian Parliament voted in support of closing the Strait of Hormuz where some 17 mb of crude and products is transported to the global market every day plus significant volumes of LNG. This is however merely an advise to the Supreme leader Ayatollah Ali Khamenei and the Supreme National Security Council which sits with the final and actual decision.
No supply of oil is lost yet. It is about the risk of Iran closing the Strait of Hormuz or not. So far not a single drop of oil supply has been lost to the global market. The price at the moment is all about the assessed risk of loss of supply. Will Iran choose to choke of the Strait of Hormuz or not? That is the big question. It would be painful for US consumers, for Donald Trump’s voter base, for the global economy but also for Iran and its population which relies on oil exports and income from selling oil out of that Strait as well. As such it is not a no-brainer choice for Iran to close the Strait for oil exports. And looking at the il price this morning it is clear that the oil market doesn’t assign a very high probability of it happening. It is however probably well within the capability of Iran to close the Strait off with rockets, mines, air-drones and possibly sea-drones. Just look at how Ukraine has been able to control and damage the Russian Black Sea fleet.
What to do about the highly enriched uranium which has gone missing? While the US and Israel can celebrate their destruction of Iranian nuclear facilities they are also scratching their heads over what to do with the lost Iranian nuclear material. Iran had 408 kg of highly enriched uranium (IAEA). Almost weapons grade. Enough for some 10 nuclear warheads. It seems to have been transported out of Fordow before the attack this weekend.
The market is still on edge. USD 80-something/b seems sensible while we wait. The oil market reaction to this weekend’s events is very muted so far. The market is still on edge awaiting what Iran will do. Because Iran will do something. But what and when? An oil price of 80-something seems like a sensible level until something do happen.


Sommarvädret styr elpriset i Sverige

Samtal om flera delar av råvarumarknaden
Tightening fundamentals – bullish inventories from DOE

Jonas Lindvall är tillbaka med ett nytt oljebolag, Perthro, som ska börsnoteras

Oljan, guldet och marknadens oroande tystnad

Stor uppsida i Lappland Guldprospekterings aktie enligt analys

Brookfield ska bygga ett AI-datacenter på hela 750 MW i Strängnäs
Silverpriset släpar efter guldets utveckling, har mer uppsida

Tradingfirman XTX Markets bygger datacenter i finska Kajana för 1 miljard euro

Uppgången i oljepriset planade ut under helgen
-
 Nyheter3 veckor sedan
Stor uppsida i Lappland Guldprospekterings aktie enligt analys
-
 Nyheter4 veckor sedan
Brookfield ska bygga ett AI-datacenter på hela 750 MW i Strängnäs
-
 Nyheter3 veckor sedan
Silverpriset släpar efter guldets utveckling, har mer uppsida
-
 Nyheter4 veckor sedan
Tradingfirman XTX Markets bygger datacenter i finska Kajana för 1 miljard euro
-
 Nyheter2 veckor sedan
Uppgången i oljepriset planade ut under helgen
-

 Nyheter2 veckor sedan
Låga elpriser i sommar – men mellersta Sverige får en ökning
-
Analys2 veckor sedan
Very relaxed at USD 75/b. Risk barometer will likely fluctuate to higher levels with Brent into the 80ies or higher coming 2-3 weeks
-

 Nyheter1 vecka sedan
Mahvie Minerals växlar spår – satsar fullt ut på guld