

Analys
SEB – Råvarukommentarer, 26 maj 2014

Rekommendationer
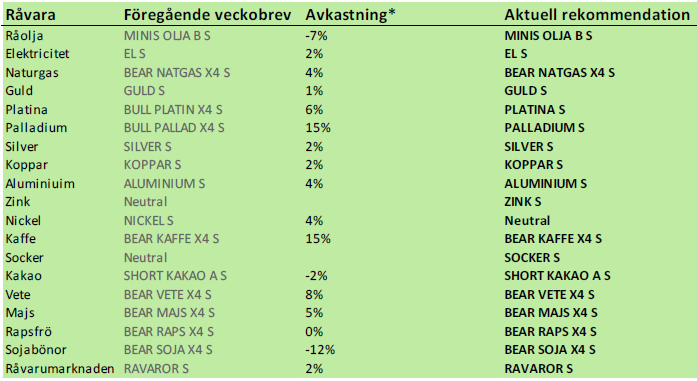
Kort sammanfattning
Fredagens stängde med oro inför vad som kan hända i Ukraina under helgen, där det är presidentval. I EU är det val till Europaparlamentet, med vad som ser ut att kunna bli ett något annorlunda sammansatt parlament. I USA och Storbritannien är marknaderna stängda måndagen den 26 maj, så att det är en långhelg innebär också att viljan att ha riskpositioner över helgen är mindre än normalt.
Efter ett par veckors fokus på den ovanliga volatiliteten i nickelmarknaden, har blickarna vänts mot andra metaller, som kanske håller på att vakna till liv. Kopparmarknaden går allt mer in i brist, vilket återspeglas både av fortsatt sjunkande lager och mer backwardation i terminskurvan (terminspriser lägre än spotpriset). Aluminiumpriset steg under fast handel i veckan, med stöd från stängning av korta positioner. På en del håll argumenteras att aluminium är nästa metall att drivas av utbudsfaktorer, efter nickel och PGM-metallerna. Zink har en intressant teknisk bild, som talar för högre priser. Frågan är om det är motiverat av fundamenta i dagens marknad.
På makrofronten kom de viktigaste siffrorna från Markits – de preliminära inköpschefsindexen. För Kina steg PMI oväntat från 48.1 till 49.7. Ett PMI under 50 innebär visserligen att tillverkningsindustrin krymper, men förbättringen av PMI var överraskande stor. I Europa var PMI lite sämre, men indikerar fortfarande expansion vid 52.5. I USA steg PMI oväntat från 55.5 förra månaden till 56.2.
Odlingsvädret fortsätter att vara mycket bra runtom i världen. Nu får även den torkdrabbade veteodlingen i USA nederbörd. Detta fick vete- och majsterminerna att falla med 2% i veckan som gick. Förvånande positivt inköpschefsindex för Kina publicerades också i veckan, som nämnt ovan. Eftersom mer pengar i Kina innebär mer protein i maten, steg sojabönorna med 5% i Chicago under ledning av sojamjölet. Haussen i sojabönorna påverkade rapsfrömarknaden under en dag. Sedan föll priset på raps tillbaka. Raps ser väldigt svagt ut och när rekylen kommer i sojan, kan rapsen falla ner mot 350 euro, en nivå som marknaden uppfattar som den absoluta botten för rapsen.
Sådden av majs går framåt i USA och är nu nästan färdig. Ukrainas produktion av majs ser ut att bli ungefär lika stor som förra året enligt de uppgifter som publicerats i veckan. Prisuppgången på spannmål tidigare i år motiverades av oro för Ukrainas produktion, där gissningarna låg på 20 – 25 mt. Nu ser produktionen ut att hamna kring 30 mt, exkl Krim, alltså i nivå med förra året. I skrivande stund har det inte kommit några alarmerande uppgifter om våldsamheter från presidentvalets Ukraina idag.
Marknaderna i USA och i England är som sagt stängda på måndag, så det blir en lugn start på en kort vecka, beroende förstås på det riktiga utfallet av valen i EU och Ukraina.
Råolja – Brent
Oljehandlare tyckte att de överlag bättre PMI-siffrorna motiverade ett högre oljepris. Samtidigt har förhoppningarna om att Libyen ska komma tillbaka som oljeexportör grusats. Väpnad konflikt med flera döda mellan rebellstyrkor och regeringssoldater har återupptagits. Det har också varslats om strejk på Nordsjön. Minskningen av oljelagren i USA i onsdagens DOE-statistik var också större än väntat.
Tekniskt är priset uppe vid den nivå där uppgångar slutat de senaste åren. De historiska oddsen är goda för att även den här uppgången ska sluta ungefär vid dagen nivå på oljepriset.
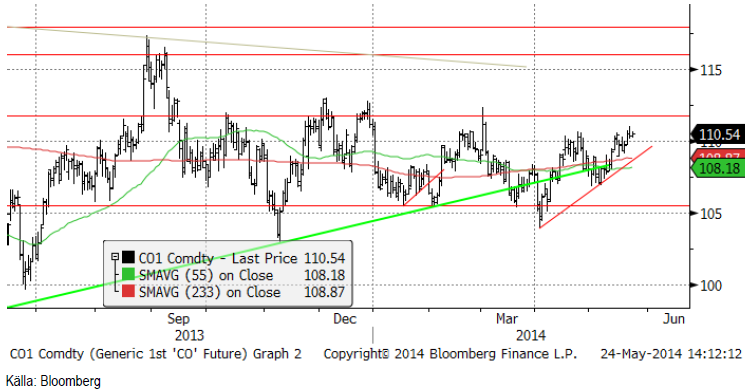
Råoljelagren minskade som nämnt ovan, med drygt 7 miljoner fat, vilket var oväntat mycket och gav marknaden stöd. Till viss del förklaras lagerminskningen av att importen för veckan låg på den lägsta nivån sedan 1996.
Vi rekommenderar en kort position i olja, t ex med MINIS OLJA B S eller MINIS OLJA A S.
Elektricitet
Hydrologisk balans är något under det normala och 60% av kärnkraften är ur drift pga planerat underhåll. Nederbördsprognosen har svängt om till torrare än normalt för de kommande 14 dagarna. Under lång tid har Norden fått väsentligt mycket mer nederbörd än normalt, samtidigt som det varit mycket varmare än normalt.
Det är möjligt att marknaden tar fasta på detta och handlar upp priset. Tekniskt ser marknaden ut att bilda en så kallad ”huvudskuldra” formation med nacklinje ungefär vid 27 euro. Om den nivån bryts, signaleras en trendvändning uppåt.
Vi behåller köprekommendationen. Stöd finns på 24 euro och motstånd på 27.
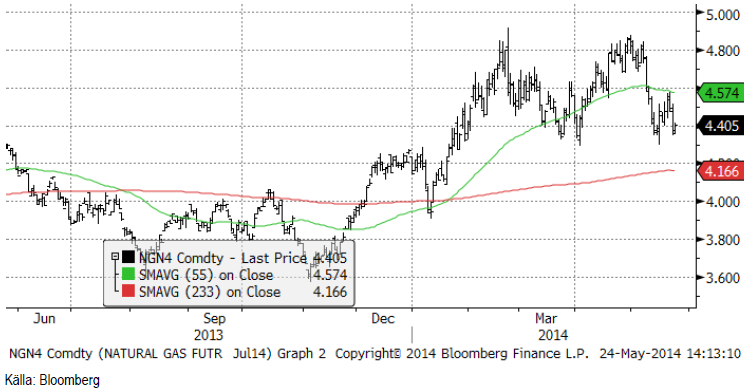
Naturgas
Priset på naturgas befinner sig i en fallande trend. Prisfallet gick återigen ner till stödet vid 4.40 dollar per MMBtu. Rent tekniskt ”borde” den nivån brytas. Under 4.40 finns stöd först vid 4.20 och sedan vid 4 dollar.
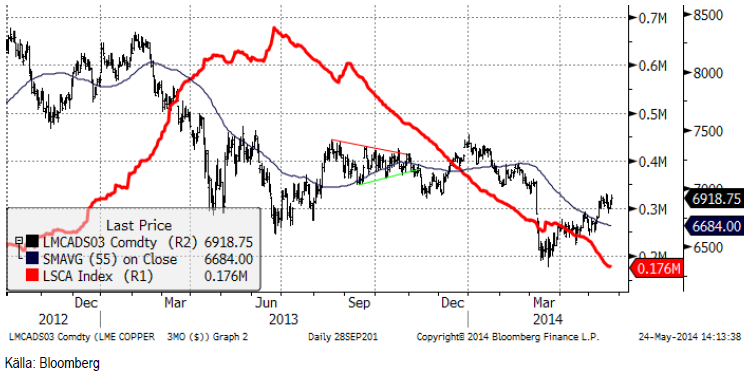
Koppar
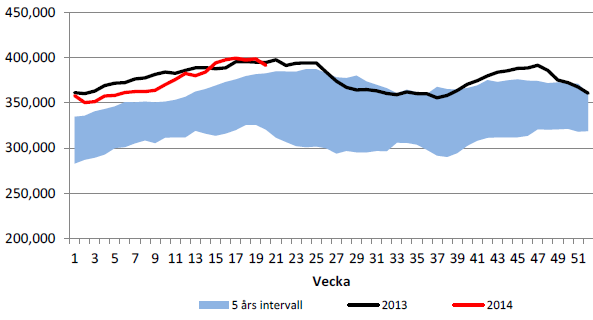
Tremånadersterminen har strävat på uppåt hela veckan, men utan några fyrverkerier. Intresset har huvudsakligen handlat om kurvan, särskilt den korta sidan. Cash mot 3-månaders terminspris handlades i fredags på runt 90 dollar per ton i backwardation. Vi har inte sett den spreaden sedan maj 2012. Bristen i marknaden har (inte förvånande) hand i hand med det fallande LME-lagret, som för närvarande sjunkit till 175,000 ton. Så låg nivå har inte setts sedan sommaren 2008, på toppen av konjunkturen. Lägger vi till Comex och Shanghai är det totala lagret runt 350 kt. Det är fortfarande lite i förhållande till marknaden för koppar som omsluter 20 miljoner ton per år. Det här är naturligtvis inte hela sanningen. Som vi har nämnt förut, anser de flesta marknadsbedömare att det finns stora mängder metall i lagerhus i Kina. Det senaste estimatet är 800-900 kt. De totala lagren uppgår enligt Metal Bulletin till 1.2 miljoner ton, vilket utgör 2.9 veckors konsumtion. Även detta innebär att det råder brist på koppar. Det innebär att den senaste förändringen i terminskurvan förmodligen är motiverad. Marknaden fokuserar emellertid på hoten: alla nya projekt i pipelinen (ungefär 5 miljoner ton i årlig produktion fram till 2020), kombinerat med oro för den kinesiska efterfrågan, kopplat till riskerna i fastighetssektorn. Sammanfattningen enligt vår åsikt är högre volatilitet i terminspriserna framöver och särskilt på uppsidan. Pga de låga lagren, får förändringar i utbud och efterfrågan mer omedelbar effekt på priserna, uppåt eller nedåt.
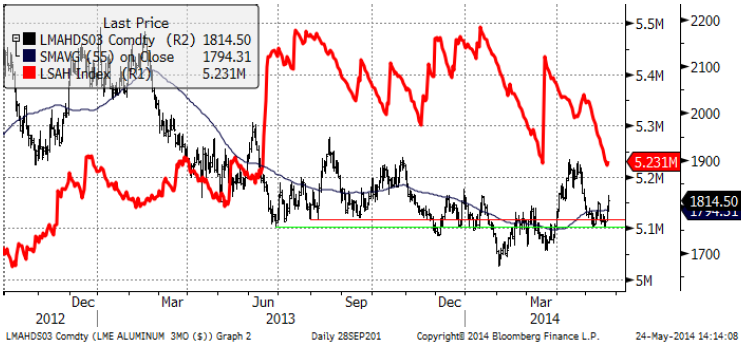
Aluminium
Nickel utvecklades mycket positivt i veckan, endast slagen av nickel. Givet det negativa sentimentet i början av veckan, när priset höll på att gå genom stödet på 1750 dollar, kom haussen som en överraskning för somliga. Vi har varit långsiktigt positiva till marknaden, med anledning av den gradvisa förbättringen av den fundamentala balansen, så i det avseendet var vi inte förvånade. Takten i uppgången var dock förvånande. En artikel i Financial Times i veckan handlar om att aluminium kan vara nästa metall att rusa i kölvattnet av det indonesiska exportförbudet. Rusal kommenterade att marknaden kommer att vara 1.3 mt i underskott i år och det gav uppgången extra bränsle. Vi har diskuterat effekterna av det indonesiska exportförbudet tidigare här, och kommit fram till att volymen som sådan är stor, men det finns goda alternativ för Kina (som är den största importören). Alternativen kan innebära högre kostnader, estimerade av flera olika analytiker till 30 – 50 dollar per ton för kinesiska smältverk. Så den indonesiska effekten borde vara liten.
Den starka efterfrågesituationen med minskande produktion borde i sig självt kunna leda till en gradvis återhämtning i priset. En annan positiv faktor är marknaden för fysiska premier. Den här veckan steg premien för metall i Europa med 10 dollar till runt 400 dollar.
Vi fortsätter alltså med köprekommendation på ALUMINIUM S.
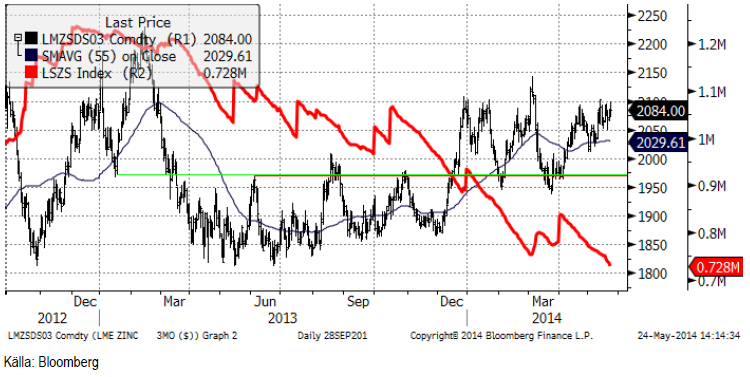
Zink
Zinkpriset har potential att nå 2200 dollar per ton från dagens nivå på 2084 dollar. Den enda nyheten från zinkmarknaden i veckan att notera är mars-statistiken från ILZSG, som visade ett underskott på 17 kt i marknaden. Det bekräftar den positiva pristrenden i marknaden. Lagren är fortfarande höga, och räcker till 8 veckors konsumtion enligt Metal Bulletin (jämför med koppar ovan). I det avseendet liknar zink situationen i aluminium – allt bättre fundamenta – men en bit kvar att gå. Om vi tittar på den tekniska bilden, tycker vi att det börjar se mer intressant ut. Priset har flera gånger försökt att gå genom motståndet på 2100 dollar. Ett brott kommer förmodligen att ge uppgången en del momentum, med potential att nå 2200 dollar per ton.
Vi återgår till köprekommendation på ZINK S.
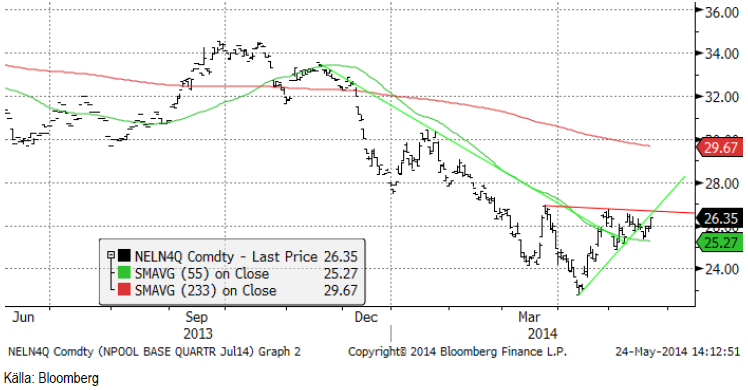
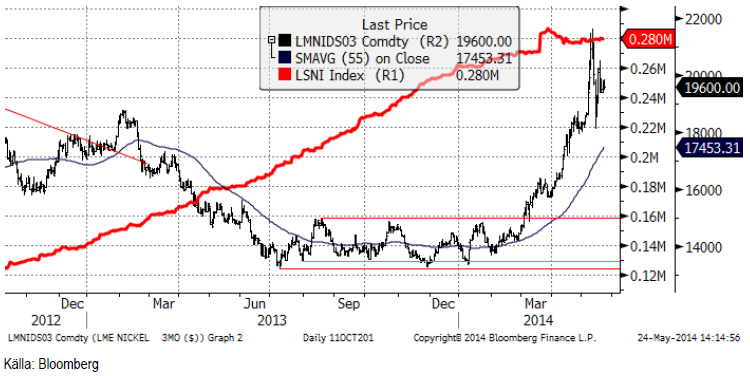
Nickel
Intradagrörelserna i priset på nickel har återvänt till nästan normala nivåer. Prisrörelserna bildar en triangel, en känd teknisk formation, som förebådar en ny stor rörelse uppåt eller nedåt, kanske i veckan som kommer. Vi lutar mot att det blir nedåt, till de nivåer vi såg som hastigast förrförra veckan runt 18500 dollar. Presidentkandidater i Indonesien säger enligt lokala tidningar att de planerar att behålla exportförbudet. Det är vad marknaden förväntar sig. Kommentarer om att de masugnar som talats om kommer att vara färdiga snart eller senare, debatteras. De flesta observatörer tycks vara överens om att några förmodligen kommer att var klara senare i år. Men det förhindrar inte att nickelmarknaden kommer att vara i underskott de kommande åren.
Vi fick den prisrörelse vi väntade oss förra veckan, från stödet vid runt 18,500 dollar. Haussen fick priset att nå 20,495 vid mitten av veckan. Om marknaden skulle rekylera nedåt, håller vi fast vid vår åsikt att ett pris på mellan 18,000 och 19,000 dollar per ton förmodligen är bra att köpa till. Just nu tycker vi att man inte ska ha någon position.
Guld
Guldmarknaden fortsatte att hålla sig lugn i veckan. World Gold Council publicerade sin kvartalsvisa Gold Demand Trends, som visade på stark efterfrågan på smycken i Kina och att ETF-utflödet avstannat under det första kvartalet. Efterfrågan globalt på fysiskt investeringsguld har dock minskat. Vad vi hör om detta i Sverige, så verkar det inte gälla här.
Eftersom inget har hänt på marknaden är situationen densamma som för en vecka sedan. Vi är fortfarande svagt positiva till guld.
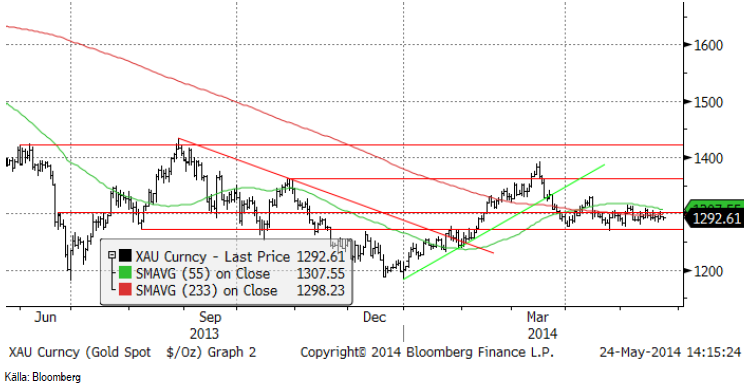
Vi rekommenderar köp av GULD S.
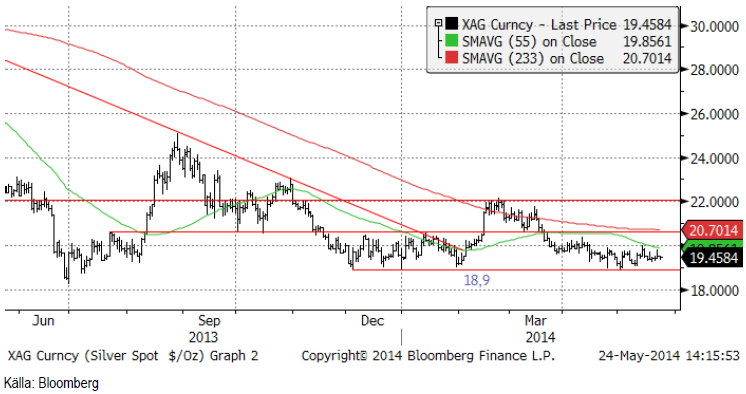
Silver
Silverpriset har inte heller uppvisat någon annan tendens än att vara stabilt.
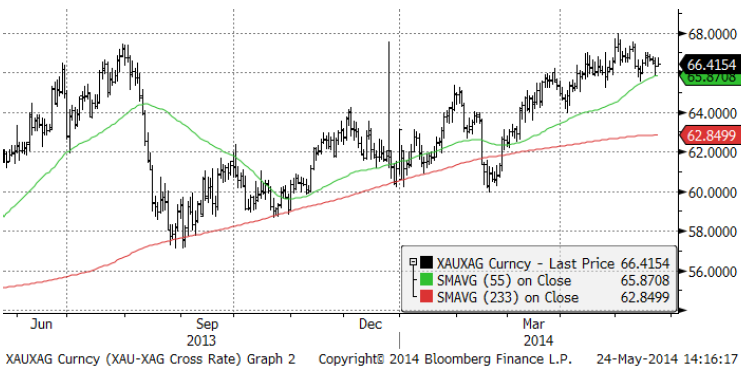
Nedan ser vi ett diagram över priset på guld uttryckt i silver.
Vi anser att silver är mer köpvärt än guld och skulle vilja köpa på de här nivåerna. Vi rekommenderar köp av SILVER S.
Platina & Palladium
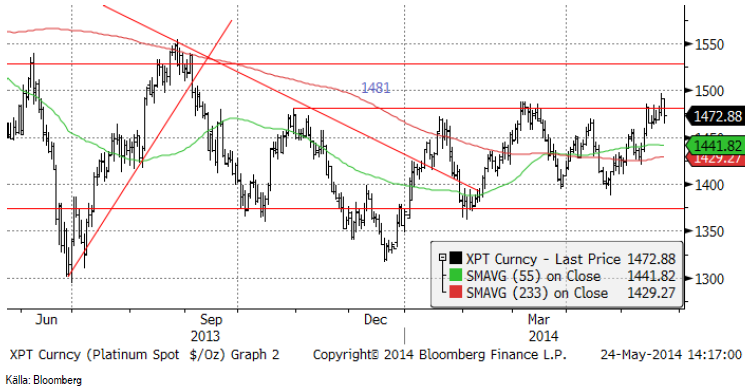
Platina steg över motståndet på 1481 i veckan men vid 1500 dollar fanns uppenbarligen säljare i väntan och kontakten med dessa fick marknaden att falla tvärt in i stängning på fredagen. Strejkerna pågår fortfarande i Sydafrika och den ryska situationen är inte förändrad heller. När marknaden har testat att handla upp platina och även palladium har det alltid funnits säljare på högre nivåer. Detta innebär att aktörer är väldigt försiktiga när priset verkar stöta på motstånd.
Prisdiagrammet på palladium ser vi nedan. Sedan förra veckan har terminen stigit från 815 dollar till 831 dollar. Frågan är om marknaden orkar ta priset upp till 850 dollar utan en rekyl. Risken för en rekyl är påtaglig.
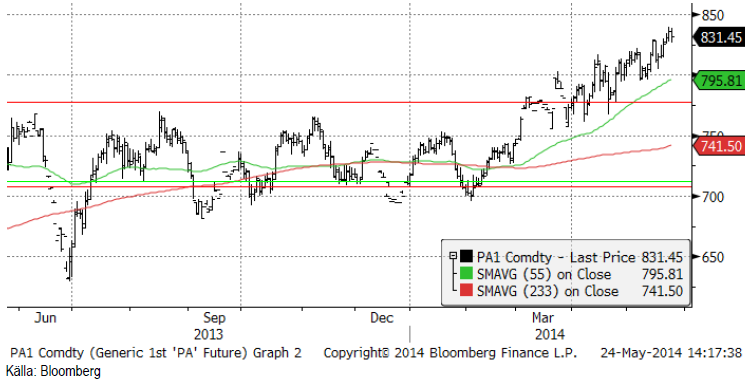
Vi rekommenderar att man minskar på hävstången och kanske behåller 1:1-certikaten PLATINA S och PALLADIUM S.
Kaffe
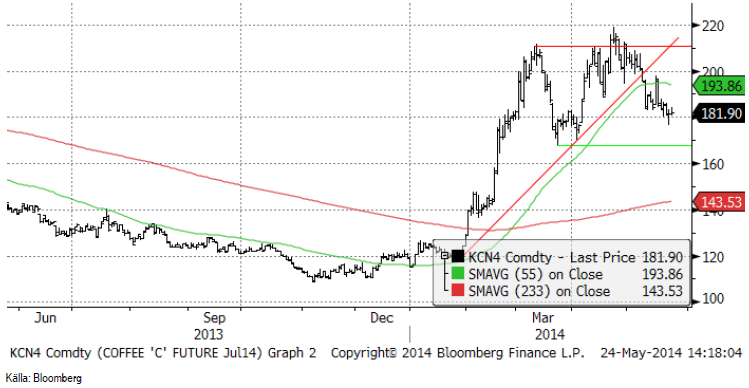
Kaffemarknaden har successivt rört sig nedåt. Stöd finns vid 170-centsnivån och motstånd på ca 200 cent i första hand. Tekniskt ser det överlag negativt ut, varför behåller en försiktig position i BEAR KAFFE X4 S.
Kakao
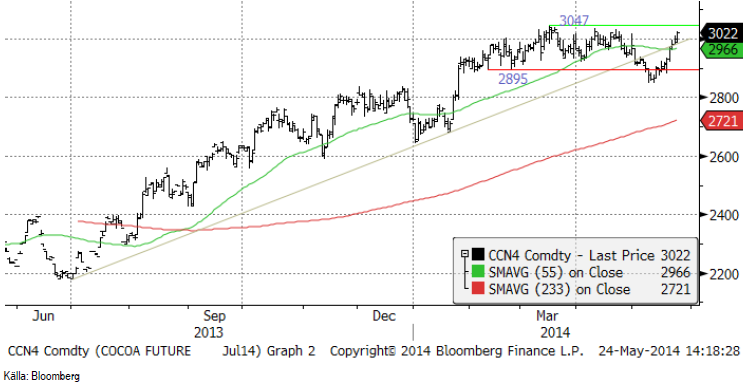
Priset på kakao rekylerade uppåt efter att priset för drygt två veckor sedan föll under det tekniska stödet vid 2895 dollar per ton. Vi tolkar uppgången som ett tillfälle att sälja på.
Vi rekommenderar köp av SHORT KAKAO A S, som har en hävstång strax under -1.
[box]SEB Veckobrev Veckans råvarukommentar är producerat av SEB Merchant Banking och publiceras i samarbete och med tillstånd på Råvarumarknaden.se[/box]
Disclaimer
The information in this document has been compiled by SEB Merchant Banking, a division within Skandinaviska Enskilda Banken AB (publ) (“SEB”).
Opinions contained in this report represent the bank’s present opinion only and are subject to change without notice. All information contained in this report has been compiled in good faith from sources believed to be reliable. However, no representation or warranty, expressed or implied, is made with respect to the completeness or accuracy of its contents and the information is not to be relied upon as authoritative. Anyone considering taking actions based upon the content of this document is urged to base his or her investment decisions upon such investigations as he or she deems necessary. This document is being provided as information only, and no specific actions are being solicited as a result of it; to the extent permitted by law, no liability whatsoever is accepted for any direct or consequential loss arising from use of this document or its contents.
About SEB
SEB is a public company incorporated in Stockholm, Sweden, with limited liability. It is a participant at major Nordic and other European Regulated Markets and Multilateral Trading Facilities (as well as some non-European equivalent markets) for trading in financial instruments, such as markets operated by NASDAQ OMX, NYSE Euronext, London Stock Exchange, Deutsche Börse, Swiss Exchanges, Turquoise and Chi-X. SEB is authorized and regulated by Finansinspektionen in Sweden; it is authorized and subject to limited regulation by the Financial Services Authority for the conduct of designated investment business in the UK, and is subject to the provisions of relevant regulators in all other jurisdictions where SEB conducts operations. SEB Merchant Banking. All rights reserved.

Rebounding along with most markets. But concerns over solidity of Gaza peace may also contribute. Brent crude fell 0.8% yesterday to $61.91/b and its lowest close since May this year. This morning it is bouncing up 0.9% to $62.5/b along with a softer USD amid positive sentiment with both equities and industrial metals moving higher. Concerns that the peace in Gaza may be less solid than what one might hope for also yields some support to Brent. Bets on tech stocks are rebounding, defying fears of trade war. Money moving back into markets. Gold continues upwards its strong trend and a softer dollar helps it higher today as well.

US crude & products probably rose 5.6 mb last week (API) versus a normal seasonal decline of 2.4 mb. The US API last night partial and thus indicative data for US oil inventories. Their data indicates that US crude stocks rose 7.4 mb last week, gasoline stocks rose 3.0 mb while Distillate stocks fell 4.8 mb. Altogether an increase in commercial crude and product stocks of 5.6 mb. Commercial US crude and product stocks normally decline by 2.4 mb this time of year. So seasonally adjusted the US inventories rose 8 mb last week according to the indicative numbers by the API. That is a lot. Also, the counter seasonal trend of rising stocks versus normally declining stocks this time of year looks on a solid pace of continuation. If the API is correct then total US crude and product stocks would stand 41 mb higher than one year ago and 6 mb higher than the 2015-19 average. And if we combine this with our knowledge of a sharp increase in production and exports by OPEC(+) and a large increase in oil at sea, then the current trend in US oil inventories looks set to continue. So higher stocks and lower crude oil prices until OPEC(+) switch to cuts. Actual US oil inventory data today at 18:00 CET.
US commercial crude and product stocks rising to 1293 mb in week 41 if last nights indicative numbers from API are correct.

Crude oil soon coming to a port near you. OPEC has lifted production sharply higher this autumn. At the same time demand for oil in the Middle-East has fallen as we have moved out of summer heat and crude oil burn for power for air-conditioning. The Middle-East oil producers have thus been able to lift exports higher on both accounts. Crude oil and condensates on water has shot up by 177 mb since mid-August. This oil is now on its way to ports around the world. And when they arrive, it will likely help to lift stocks onshore higher. That is probably when we will lose the last bit of front-end backwardation the the crude oil curves. That will help to drive the front-month Brent crude oil price down to the $60/b line and revisit the high $50ies/b. Then the eyes will be all back on OPEC+ when they meet in early November and then again in early December.
Crude oil and condensates at sea have moved straight up by 177 mb since mid-August as OPEC(+) has produced more, consumed less and exported more.

When it starts to move lower it moves rather quickly. Gaza, China, IEA. Brent crude is down 2.1% today to $62/b after having traded as high as $66.58/b last Thursday and above $70/b in late September. The sell-off follows the truce/peace in Gaze, a flareup in US-China trade and yet another bearish oil outlook from the IEA.
A lasting peace in Gaze could drive crude oil at sea to onshore stocks. A lasting peace in Gaza would probably calm down the Houthis and thus allow more normal shipments of crude oil to sail through the Suez Canal, the Red Sea and out through the Bab-el-Mandeb Strait. Crude oil at sea has risen from 48 mb in April to now 91 mb versus a pre-Covid normal of about 50-60 mb. The rise to 91 mb is probably the result of crude sailing around Africa to be shot to pieces by the Houthis. If sailings were to normalize through the Suez Canal, then it could free up some 40 mb in transit at sea moving onshore into stocks.
The US-China trade conflict is of course bearish for demand if it continues.
Bearish IEA yet again. Getting closer to 2026. Credibility rises. We expect OPEC to cut end of 2025. The bearish monthly report from the IEA is what it is, but the closer we get to 2026, the more likely the IEA is of being ball-park right in its outlook. In its monthly report today the IEA estimates that the need for crude oil from OPEC in 2026 will be 25.4 mb/d versus production by the group in September of 29.1 mb/d. The group thus needs to do some serious cutting at the end of 2025 if it wants to keep the market balanced and avoid inventories from skyrocketing. Given that IEA is correct that is. We do however expect OPEC to implement cuts to avoid a large increase in inventories in Q1-26. The group will probably revert to cuts either at its early December meeting when they discuss production for January or in early January when they discuss production for February. The oil price will likely head yet lower until the group reverts to cuts.
Dubai: The Mid-East anchor dragging crude oil lower. Surplus emerging in Mid-East pricing. Crude oil prices held surprisingly strong all through the summer. A sign and a key source of that strength came from the strength in the front-end backwardation of the Dubai crude oil curve. It held out strong from mid-June and all until late September with an average 1-3mth time-spread premium of $1.8/b from mid-June to end of September. The 1-3mth time-spreads for Brent and WTI however were in steady deterioration from late June while their flat prices probably were held up by the strength coming from the Persian Gulf. Then in late September the strength in the Dubai curve suddenly collapsed. Since the start of October it has been weaker than both the Brent and the WTI curves. The Dubai 1-3mth time-spread now only stands at $0.25/b. The Middle East is now exporting more as it is producing more and also consuming less following elevated summer crude burn for power (Aircon) etc.
The only bear-element missing is a sudden and solid rise in OECD stocks. The only thing that is missing for the bear-case everyone have been waiting for is a solid, visible rise in OECD stocks in general and US oil stocks specifically. So watch out for US API indications tomorrow and official US oil inventories on Thursday.
No sign of any kind of fire-sale of oil from Saudi Arabia yet. To what we can see, Saudi Arabia is not at all struggling to sell its oil. It only lowered its Official Selling Prices (OSPs) to Asia marginally for November. A surplus market + Saudi determination to sell its oil to the market would normally lead to a sharp lowering of Saudi OSPs to Asia. Not yet at least and not for November.
The 5yr contract close to fixed at $68/b. Of importance with respect to how far down oil can/will go. When the oil market moves into a surplus then the spot price starts to trade in a large discount to the 5yr contract. Typically $10-15/b below the 5yr contract on average in bear-years (2009, 2015, 2016, 2020). But the 5yr contract is usually pulled lower as well thus making this approach a moving target. But the 5yr contract price has now been rock solidly been pegged to $68/b since 2022. And in the 2022 bull-year (Brent spot average $99/b), the 5yr contract only went to $72/b on average. If we assume that the same goes for the downside and that 2026 is a bear-year then the 5yr goes to $64/b while the spot is trading at a $10-15/b discount to that. That would imply an average spot price next year of $49-54/b. But that is if OPEC doesn’t revert to cuts and instead keeps production flowing. We think OPEC(+) will trim/cut production as needed into 2026 to prevent a huge build-up in global oil stocks and a crash in prices. But for now we are still heading lower. Into the $50ies/b.
Some rebound but not much. Brent crude rebounded 1.5% yesterday to $65.47/b. This morning it is inching 0.2% up to $65.6/b. The lowest close last week was on Thursday at $64.11/b.
The curve structure is almost as week as it was before the weekend. The rebound we now have gotten post the message from OPEC+ over the weekend is to a large degree a rebound along the curve rather than much strengthening at the front-end of the curve. That part of the curve structure is almost as weak as it was last Thursday.
We are still on a weakening path. The message from OPEC+ over the weekend was we are still on a weakening path with rising supply from the group. It is just not as rapidly weakening as was feared ahead of the weekend when a quota hike of 500 kb/d/mth for November was discussed.
The Brent curve is on its way to full contango with Brent dipping into the $50ies/b. Thus the ongoing weakening we have had in the crude curve since the start of the year, and especially since early June, will continue until the Brent crude oil forward curve is in full contango along with visibly rising US and OECD oil inventories. The front-month Brent contract will then flip down towards the $60/b-line and below into the $50ies/b.
At what point will OPEC+ turn to cuts? The big question then becomes: When will OPEC+ turn around to make some cuts? At what (price) point will they choose to stabilize the market? Because for sure they will. Higher oil inventories, some more shedding of drilling rigs in US shale and Brent into the 50ies somewhere is probably where the group will step in.
There is nothing we have seen from the group so far which indicates that they will close their eyes, let the world drown in oil and the oil price crash to $40/b or below.
The message from OPEC+ is also about balance and stability. The world won’t drown in oil in 2026. The message from the group as far as we manage to interpret it is twofold: 1) Taking back market share which requires a lower price for non-OPEC+ to back off a bit, and 2) Oil market stability and balance. It is not just about 1. Thus fretting about how we are all going to drown in oil in 2026 is totally off the mark by just focusing on point 1.
When to buy cal 2026? Before Christmas when Brent hits $55/b and before OPEC+ holds its last meeting of the year which is likely to be in early December.
Brent crude oil prices have rebounded a bit along the forward curve. Not much strengthening in the structure of the curve. The front-end backwardation is not much stronger today than on its weakest level so far this year which was on Thursday last week.

The front-end backwardation fell to its weakest level so far this year on Thursday last week. A slight pickup yesterday and today, but still very close to the weakest year to date. More oil from OPEC+ in the coming months and softer demand and rising inventories. We are heading for yet softer levels.


Vad guldets uppgång egentligen betyder för världen

Spotpriset på guld över 4300 USD och silver över 54 USD
Crude oil soon coming to a port near you

Guld och silver stiger hela tiden mot nya höjder
The Mid-East anchor dragging crude oil lower

OPEC+ missar produktionsmål, stöder oljepriserna

Ett samtal om guld, olja, fjärrvärme och förnybar energi

Goldman Sachs höjer prognosen för guld, tror priset når 4900 USD
Guld nära 4000 USD och silver 50 USD, därför kan de fortsätta stiga
Are Ukraine’s attacks on Russian energy infrastructure working?
-
 Nyheter3 veckor sedan
OPEC+ missar produktionsmål, stöder oljepriserna
-
 Nyheter4 veckor sedan
Ett samtal om guld, olja, fjärrvärme och förnybar energi
-
 Nyheter2 veckor sedan
Goldman Sachs höjer prognosen för guld, tror priset når 4900 USD
-
 Nyheter2 veckor sedan
Guld nära 4000 USD och silver 50 USD, därför kan de fortsätta stiga
-
Analys3 veckor sedan
Are Ukraine’s attacks on Russian energy infrastructure working?
-

 Nyheter2 veckor sedan
Blykalla och amerikanska Oklo inleder ett samarbete
-

 Nyheter4 veckor sedan
Guldpriset uppe på nya höjder, nu 3750 USD
-
Nyheter2 veckor sedan
Ett samtal om guld, olja, koppar och stål