

Analys
SEB – Råvarukommentarer, 17 februari 2014

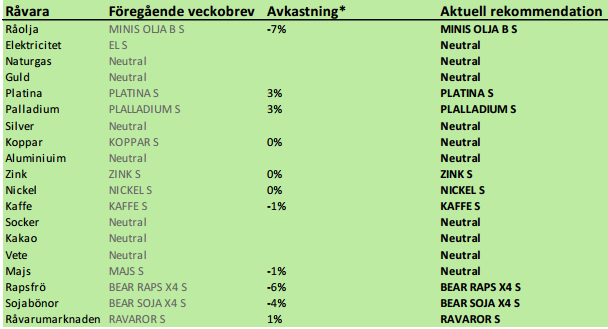
Rekommendationer
Råolja – Brent
Oljepriset fick styrka i veckan av att El Sharara-fältet i Libyen fick stängas igen. Marknaden har till viss del räknat in att Iran och Libyen ökar sin produktion i år. Gör de det, så faller priset. Gör de inte det, så stiger priset. Stängningen av El Sharara var alltså inte positiv ur den aspekten.
Kinas import av råolja var på rekordnivå i januari (liksom importstatistiken var för en rad råvaror).
Tekniskt är det möjligt att den konsolidering av priset vi sett efter uppgången från 106 dollar till 109 är en så kallad ”vimpel”. Om det är det, ska vi vänta oss ett utbrott på uppsidan, som har potential att ta priset till 111 dollar.
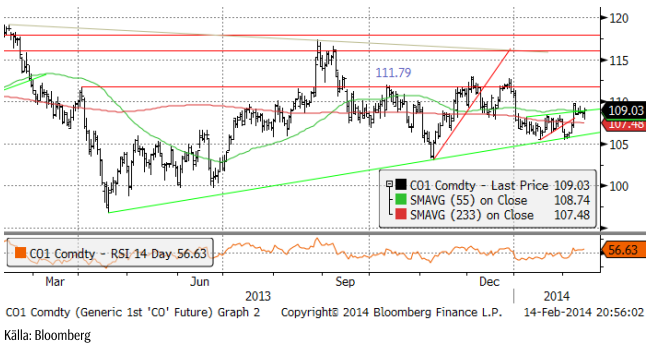
Fundamentalt genomgår oljemarknaden ett paradigmskifte där fracking radikalt ökar utbudet av råolja och minskar OPEC:s monopolställning. På längre sikt är det svårt att se något annat än ett stort prisfall på olja och vi vill handla oljemarknaden från den korta sidan. Tekniskt och i det mycket korta perspektivet av en vecka är det dock inte uteslutet, rentav troligt, att priset bryter upp och testar den övre delen av det ”gamla” prisintervallet. Med den reservationen behåller vi säljrekommendation, men rekommenderar inte att man går in i nya korta positioner på den här nivån, utan avvaktar bättre säljtillfällen.
Elektricitet
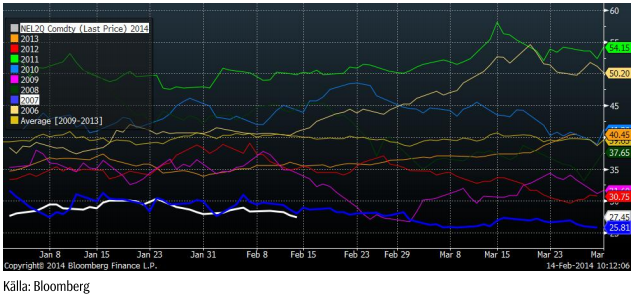
Elpriset bröt bröt stödet på 28.50 i fredags, vilket innebär att marknaden säger att skyddet mot ytterligare nedgångar har brutits. Det innebär att marknaden med hög sannolikhet kommer att handla ner priset ytterligare. Samtidigt är priset på en mycket låg nivå, som vi ser nedan.
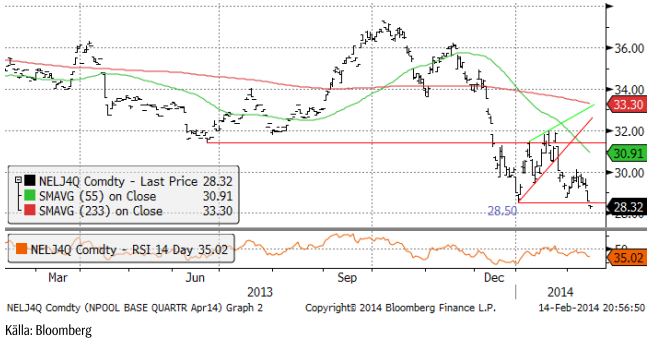
Det är omöjligt att säga var botten är. Det lägsta priset på Q2-kontraktet år 2007 var 25.8 euro per MWh, som vi ser i nedanstående diagram över det vid var tid kortaste Q2-kontraktets pris.
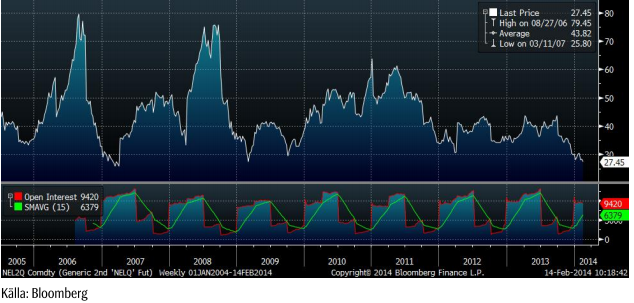
I diagrammet nedan ser vi prisutvecklingen på Q2-kontrakten under det första kvartalet varje år sedan 2006. Det andra kvartalets kontrakt är på den lägsta nivån sedan åtminstone 2006. I diagrammet nedan ser vi prisutvecklingen på Q2 2014 som den vita kurvan och Q2 2007 som den blå kurvan. Som vi ser, ser prisutvecklingen i år ut att röra sig snarlikt prisutvecklingen under 2007 sedan början av året. Om detta fortsätter kommer prisnedgången att fortsätta.
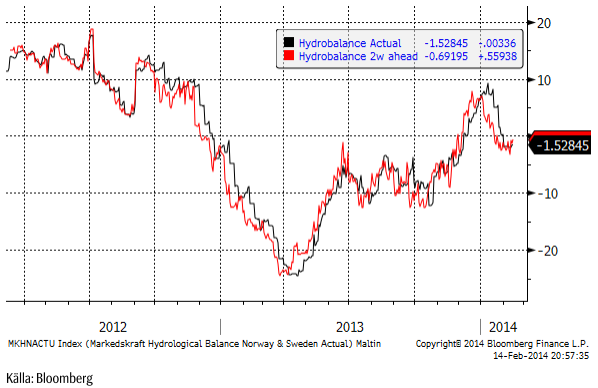
Prognosen för hydrologisk balans är enligt Markedskraft mer eller mindre oförändrad från förra veckan. Vädret i Norden är dock milt och nederbördsrikt just nu.
Terminspriset för leverans av kol nästa år har fallit från 87 dollar till 82.30. Priset är alltså tillbaka på bottennivåerna från oktober. Priset ligger under produktionskostnaden för gruvorna i Australien, Sydamerika och Kanada. Den australiensiska dollar har under samma period fallit med 8% mot US-dollarn, så där är en av förklaringarna till varför kolpriset inte har stigit i US-dollartermer. Som vi ser handlade kolpriset upp i fredags. Kanske är det en vändning?
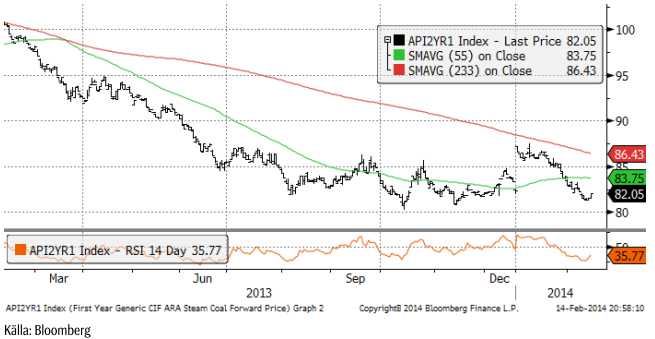
Risken är stor att de stora kollagren (”kolhögar överallt”) i Europa och det milda vädret i Norden fortsätter att påverka elpriset nedåt resten av vårvintern. Tekniskt är stödet vid 28.50 brutet, vilket är en signal att ta stoppar. Rekommendationen kan inte bli annat än neutral som högst just nu. Man ska dock vara observant på om priset går tillbaka över 28.50 euro per MWh, med tanke på att priset är på absoluta bottennivåer i ett historiskt perspektiv.
Naturgas
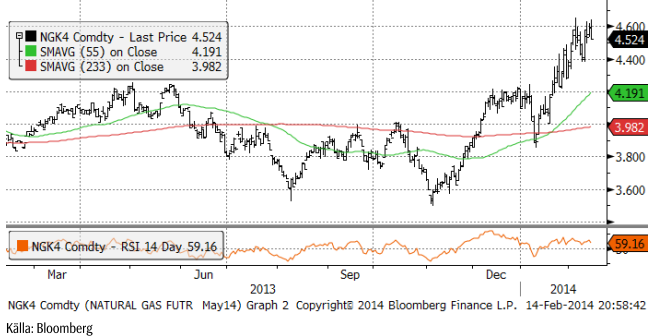
Det har fortsatt att vara kallt i USA, men nu börjar man se en omsvängning. Naturgaspriset har faktiskt backat lite från förra veckans 4.60 till 4.52 i fredags.
Basmetaller
Vi har en mer eller mindre positiv pristrend i basmetallerna som helhet, men med svag tendens sedan början av året. Den nedgången ”borde” vara nära sitt slut (eller inte). Den väntade optimismen efter det kinesiska nyåret har inte infunnit sig. Marknadens aktörer väntar fortfarande på ny information om tillståndet i den kinesiska efterfrågan. En pusselbit delades ut den här veckan. Januari månads importstatistik visade ovanligt hög import (+10%) och export (+10.6%). Importen intresserar naturligtvis råvarumarknaden mest. Importen av koppar och järnmalm nådde rekordnivåer. Marknaden blev dock inte fullt så imponerad, eftersom den höga importen hänger ihop med årsskifteseffekter. Som vanligt byggs det lager innan året och en del tyder på att varor har bokats och registrerats tidigare, men levereras på det nya året. Det finns en klar risk att februari-statistiken inte kommer att vara lika imponerande. Marknaden behöver se februaristatstiken för att få ökat förtroende.
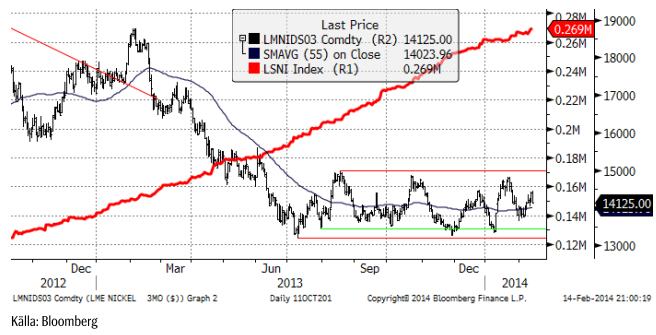
Från ett tradingperspektiv, föredrar vi fortfarande att handla nickel som om den var inom ett prisintervall, och inte i en trend, även om vi favoriserar den långa sidan mer än den korta.
Koppar
Som du kunnat läsa i inledningen till basmetallsegmentet här ovan, är vi lite oroade för kopparmarknaden. Risken för ökat utbud i kombination med skuldproblemen i Kina och risken för bankrutter inom den svarta banksektorn där, utgör en klar risk för nedsidan i kopparpriset. Just nu ser det dock inte ut att ske, i närtid i alla fall. Marknaden visar stark efterfrågan med backwardation i terminskurvan. Kinas import är extremt stark. Dessutom är vi just nu i de säsongsmässigt starka första och andra kvartalen. Vi skulle inte bli förvånade om kopparpriset testar de senaste toppnoteringarna någon gång de kommande månaderna.
Ur ett tradingperspektiv, gör osäkerheterna att vi inte vill ta någon position i metallen just nu. I vår fundamentala prognos för det genomsnittliga priset för året (7450), väntar vi oss en stark marknad under det första halvåret, sedan att priset handlar svagare i Q3 och med en möjlig återhämtning under Q4.
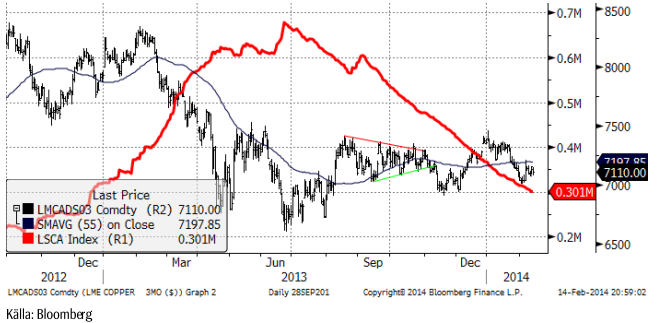
Vi rekommenderar neutral position i koppar.
Aluminium
Aluminium har handlat starkare sedan priset noterade femårslägsta den 3 februari vid 1671 dollar. Det är alltid riskabelt att vara kort råvaror som handlar så långt ner i förhållande till produktionskostnaden. Den fundamentala balansen visar äntligen på konstruktiva tendenser. Som väntat har blankarna börjat köpa tillbaka positioner.
Konsumenter har varit på köpsidan. De tar tillvara varje prisnedgång för att köpa ytterligare hedgar. Sammantaget har detta tagit tillbaka priset till den ”gamla” tekniska stödnivån vid ca 1750 dollar. Premierna i den amerikanska marknaden har planat ut vid de extrema nivåer kring 440 dollar per ton. Enligt våra källor i den fysiska marknaden skeppas nu aluminium från Mellanöstern till USA för att dra fördel av de höga premierna. CME har startat ett nytt terminskontrakt på den fysiska premien och det visar redan snabbt ökande öppen balans. LME planerar fortfarande att introducera ett kontrakt. De nya LME-reglerna för lagerhanteringen kommer på lite längre sikt att dämpa premierna. En annan effekt av den höga premien är att finansieringsaffärer inte rullas framåt, när contangot mellan cash + premium till termin (utan premium) på LME inte ger tillräckligt avans. Risken för högre räntor i och med att FED har inlett tapering och att klockan tickar för nästa räntehöjningscykel påverkar sannolikt också.
I vilket fall, finns ett behov för ytterligare minskning i produktionen av aluminium. Så länge detta inte materialiseras, finns risken att aluminiummarknaden går in i överskott igen, om vi inte får se starkare efterfrågan än förväntat.
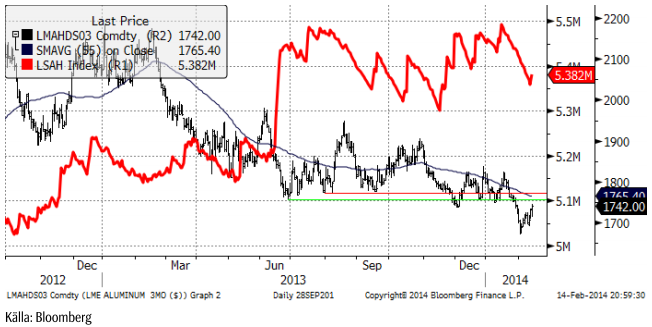
Vi fortsätter med neutral rekommendation på aluminium.
Zink
Zink har gjort imponerande vinster de senaste veckorna. Samtidigt, som vi noterade för ett par veckor sedan, har styrkan mattats av oron i tillväxtländerna. Terminsmarknaden handlar fortfarande cash till 3-månaders på samma nivå och längre kontrakt med ett litet contango. Givet att balanserna på längre sikt förbättras från 2015 och framåt, tycker vi att kurvan är ganska billig.
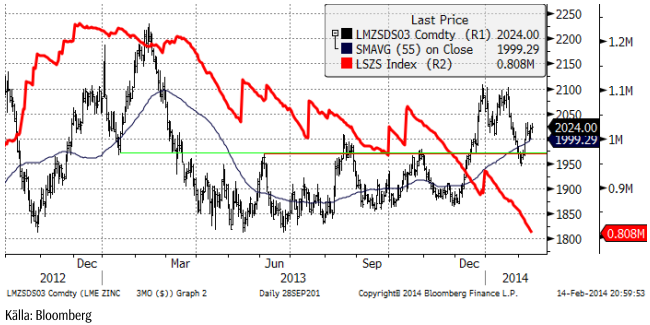
Vi rekommenderar köp av ZINK S eller BULL ZINK X4 S.
Nickel
Nickel handlar mitt i prisintervallet, vid 14,200 dollar. Det återspeglar osäkerheten kring det indonesiska exportförbudet. Marknadens aktörer drar sig för att ta positioner i avvaktan på nyheter från den indonesiska regeringen. Värt att notera är att priset på nickelmalm från Malaysia, som delvis är ett alternativ för NPI-producenter, har gått upp i pris. Malm inom Kina blir också dyrare. Scenariot vi beskrivit tidigare för nickel är i stort sett fortfarande relevant och innebär att det finns en begränsad nedsida i nickelpriset. Risken är på uppsidan för resten av året.
Guld
Det är nu tydligt att guld verkligen noterade en botten vid 1200 dollar per uns. Fredagens handel var haussartad. Det är dock vanligt att det sista man ser av en prisuppgång i guld är en ”spik” av det slaget. Det känns inte rätt att så här sent i en uppgång som pågått i två månader, gå in och köpa. Vi tycker det är bättre att avvakta den rekyl som brukar följa.
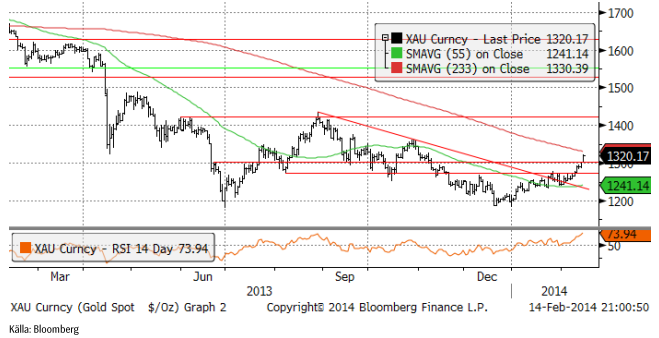
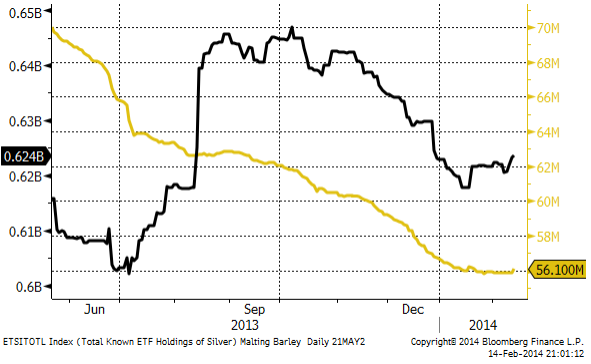
ETF-statistiken visar infllöden i silver-ETF:er (svart kurva) men inte lika tydligt i ETF-er på guld (gul kurva).
Vi fortsätter tills vidare med neutral vy på guld.
Silver
Silver bröt motståndet i fredags och steg kraftigt. Prisrörelsen var mycket snabb och priset är nu nästan uppe vid nästa motstånd, vilket gör att det är för sent att rekommendera köp.
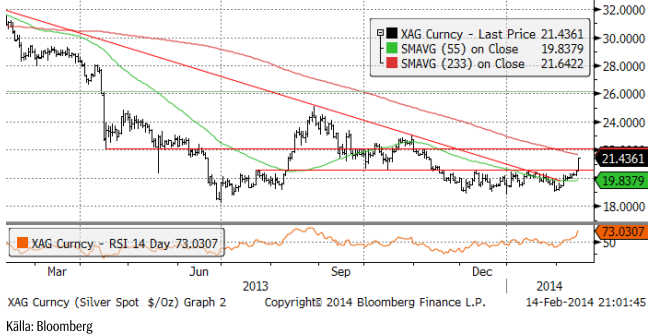
Vi fortsätter med neutral vy på silver.
Platina & Palladium
Platina, trots sin mycket lugnare utveckling än både guld och silver, har ett marknadsbeteende som i början av en trendvändning uppåt. Rekylen nedåt efter uppgången i början på året stannade på en högre nivå än botten i december. Det är ett positivt tecken. Trendlinjen för den fallande pristrenden bröts i början av januari. Även om det skulle komma en liten rekyl nedåt nu, skulle det inte förändra bilden av att en större trendvändning är på gång.
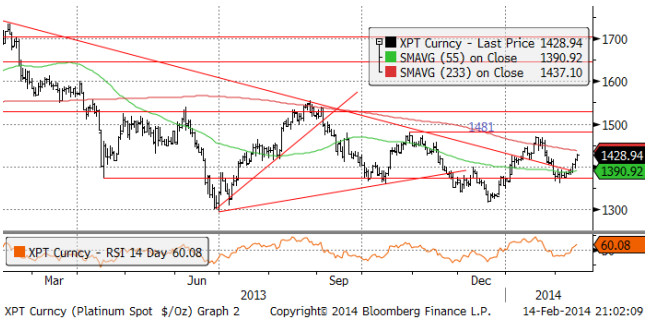
Palladium, där prisuppgången varit snabb seden botten för ett par veckor sedan, mötte säljare i fredags, vilket fick priset att stänga långt under dagens högsta notering. Palladium är alltså fortsatt ”cappad” på uppsidan och eftersom priset redan är ”högt” inom intervallet, rekommenderar vi neutral position.
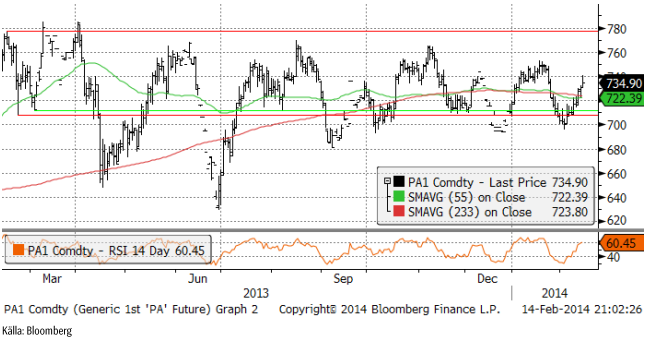
Vi rekommenderar alltså köp av både platina och neutral i palladium.
Kaffe
Det har varit skyfall i Sao Paulo de senaste dagarna. Regnvädret rör sig norrut mot kaffeodlingarna i Minas Gerais. Prisuppgången stannade vid en nivå kring 140 cent per pund när väderleksprognoserna visade att regnvädret faktiskt var på väg norrut. Tekniskt har priset bildat en ”vimpel” vid 140 cent och en sådan formation brukar följas av antingen ett brott uppåt (mot 160 cent) eller ett fall tillbaka. Marknaden försöker nu som bäst få grepp om vad den långsiktiga effekten av torkan är på kaffeskörden i Brasilien. Det är möjligt att man kommer fram till att minskningen i skörd de kommande åren är så stor att priset borde gå upp. Vi ska komma ihåg att USDA genom en survey under hösten räknat ut att den genomsnittliga produktionskostnaden i Brasilien är 147 cent. Priset på 140 cent idag är alltså inte så högt att det skulle locka så många kaffeodlare att expandera. Bortfallen produktion kanske inte ersätts. Det talar för en fortsatt prisuppgång.
Vietnam rapporterade att exporten i januari var 36% lägre än förra året.
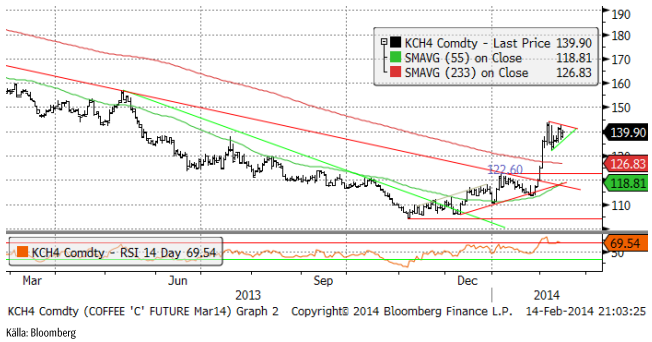
Vi fortsätter med köprekommendation.
Det finns nu också mini futures på kaffe, som erbjuder högre hävstång. Se SEB-bankens utbud.
[box]SEB Veckobrev Veckans råvarukommentar är producerat av SEB Merchant Banking och publiceras i samarbete och med tillstånd på Råvarumarknaden.se[/box]
Disclaimer
The information in this document has been compiled by SEB Merchant Banking, a division within Skandinaviska Enskilda Banken AB (publ) (“SEB”).
Opinions contained in this report represent the bank’s present opinion only and are subject to change without notice. All information contained in this report has been compiled in good faith from sources believed to be reliable. However, no representation or warranty, expressed or implied, is made with respect to the completeness or accuracy of its contents and the information is not to be relied upon as authoritative. Anyone considering taking actions based upon the content of this document is urged to base his or her investment decisions upon such investigations as he or she deems necessary. This document is being provided as information only, and no specific actions are being solicited as a result of it; to the extent permitted by law, no liability whatsoever is accepted for any direct or consequential loss arising from use of this document or its contents.
About SEB
SEB is a public company incorporated in Stockholm, Sweden, with limited liability. It is a participant at major Nordic and other European Regulated Markets and Multilateral Trading Facilities (as well as some non-European equivalent markets) for trading in financial instruments, such as markets operated by NASDAQ OMX, NYSE Euronext, London Stock Exchange, Deutsche Börse, Swiss Exchanges, Turquoise and Chi-X. SEB is authorized and regulated by Finansinspektionen in Sweden; it is authorized and subject to limited regulation by the Financial Services Authority for the conduct of designated investment business in the UK, and is subject to the provisions of relevant regulators in all other jurisdictions where SEB conducts operations. SEB Merchant Banking. All rights reserved.

Brent is climbing higher. Front-month is at USD 106.3/bl this morning, close to a weekly high and a USD 9/bl jump from Mondays open. This is the move we flagged as a risk earlier in the week: the market shifting from ”a deal is around the corner” to ”this is going to take longer than we thought”.

Analyst Commodities, SEB
During April, rest-of-year Brent remained remarkably stable around USD 90/bl. A stability which rested on one single assumption: the SoH reopens around 1 May. That assumption is now slowly falling apart.
As we highlighted yesterday: every week of delay beyond 1 May adds (theoretically) ish USD 5/bl to the rest-of-year average, as global inventories draw 100 million barrels per week. i.e., a mid-May reopening implies rest-of-year Brent closer to USD 100/bl, and anything pushing into June or July takes us meaningfully higher.
What’s changed in the last 48 hours:
#1: The US military has formally warned that clearing suspected sea mines from SoH could take up to six months. That is a completely different timescale from what the financial market is pricing. Even a political deal tomorrow does not immediately reopen the strait.
#2: Trump has shifted his tone from urgency to ”strategic patience”. In yesterday’s press conference: ”Don’t rush me… I want a great deal.” The market is reading this as a president no longer feeling pressured by timelines, with the naval blockade running in the background.
#3: So far, the military activity is escalating, not de-escalating. Axios reports Iran is laying more mines in SoH. The US 3rd carrier strike group (USS George H.W. Bush) is arriving with two countermine vessels. Trump yesterday ordered the US Navy to destroy any Iranian boats caught laying mines. While CNN reports that the Pentagon is actively drawing up plans to strike Iranian SoH capabilities and individual Iranian military leaders if the ceasefire collapses. i.e., NOT a attitude consistent with an imminent deal!
Spot crude and product prices eased off the early-April highs on a combination of system rerouting and deal optimism. Both now weakening. Goldman estimates April Gulf output is reduced by 14.5 mbl/d, or 57% of pre-war supply, a number that keeps getting worse the longer this drags on.
Demand-side adaptation is ongoing: S. Korea has cut its Middle East crude dependence from 69% to 56% by pulling more from the Americas and Africa, and Japan is kicking off a second round of SPR releases from 1 May. But SPRs are finite.
Ref. to the negotiations, we should not bet on speed. The current Iranian leadership is dominated by genuine hardliners willing to absorb economic pain and run the clock to extract concessions. That is not a setup for a rapid resolution. US/Israeli media briefings keep framing the delay as ”internal Iranian divisions”, the reality is more complicated and points toward weeks and months, not days.
Our point is that the complexity is large, and higher prices have only just started (given a scenario where the negotiations drag out in time). The market spent April leaning on the USD 90/bl rest-of-year assumption; that case is diminishing by the hour. If ”early May reopening” is replaced by ”June, July or later” over the next week or two, both crude and products have meaningful room to reprice higher from here. There is a high risk being short energy and betting on any immediate political resolution(!).
Down on Friday. Up on Monday. The Brent June crude oil contract traded down 5.1% last week to a close of $90.38/b. It reached a high of $103.87/b last Monday and a low of $86.09/b on Friday as Iran announced that the Strait of Hormuz was fully open for transit. That quickly changed over the weekend as the US upheld its blockade of Iranian oil exports while Iran naturally responded by closing the SoH again. The US blew a hole in the engine room of the Iranian ship TOUSKA and took custody of the ship on Sunday. Brent crude is up 5.6% this morning to $95.4/b.

The cease-fire is expiring tomorrow. The US has said it will send a delegation for a second round of negotiations in Islamabad in Pakistan. But Iran has for now rejected a second round of talks as it views US demands as unrealistic and excessive while the US is also blocking the Strait of Hormuz.
While Brent is up 5% this morning, the financial market is still very optimistic that progress will be made. That talks will continue and that the SoH will fully open by the start of May which is consistent with a rest-of-year average Brent crude oil price of around $90/b with the market now trading that balance at around $88/b.
Financial optimism vs. physical deterioration. We have a divergence where the financial market is trading negotiations, improvements and resolution while at the same time the physical market is deteriorating day by day. Physical oil flows remain constrained by disrupted flows, longer voyage times and elevated freight and insurance costs.
Financial markets are betting that a US/Iranian resolution will save us in time from violent shortages down the road. But every day that the SoH remains closed is bringing us closer to a potentially very painful point of shortages and much higher prices.
The US blockade is also a weapon of leverage against its European and Asian allies. When Iran closed the SoH it held the world economy as a hostage against the US. The US blockade of the SoH is of course blocking Iranian oil exports. But it is also an action of disruption directed towards Europe and Asia. The US has called for the rest of the world to engaged in the war with Iran: ”If you want oil from the Persian Gulf, then go and get it”. A risk is that the US plays brinkmanship with the global oil market directed towards its European and Asian allies and maybe even towards China to force them to engage and take part. Maybe unthinkable. But unthinkable has become the norm with Trump in the White House.
Wild moves yesterday. Brent crude traded to a high of $114.43/b and a low of $96.0/b and closed at $99.94/b yesterday.
US – Iran negotiations ongoing or not? What a day. Donald Trump announced that good talks were ongoing between Iran and the US and that the 48 hour deadline before bombing Iranian power plants and energy infrastructure was postponed by five days subject to success of ongoing meetings. Iranian media meanwhile stated that no meetings were ongoing at all.
Today we are scratching our heads trying to figure out what yesterday was all about.
Friends and family playing the market? Was it just Trump and his friends and family who were playing with oil and equity markets with $580m and $1.46bn in bets being placed by someone in oil and equity markets just 15 minutes before Trump’s announcement?
Was Trump pulling a TACO as he reached his political and economic pain point: Brent at $112/b, US Gas at $4/gal, SPX below 200dma and US 10yr above 4.4%?
Different Iranian factions with Trump talking with one of them? Are there real negotiations going on but with the US talking to one faction in Iran while another, the hardliners, are not involved and are denying any such negotiations going on?
Extending the ultimatum to attack and invade Kharg island next weekend? Or, is the five day delay of the deadline a tactical decision to allow US amphibious assault ships and marines to arrive in the Gulf in the upcoming weekend while US and Israeli continues to degrade Iranian military targets till then. And then next weekend a move by the US/Israel to attack and conquer for example the Kharg island?
We do not really know which it is or maybe a combination of these.
We did get some kind of TACO ydy. But markets have been waiting for some kind of TACO to happen and yesterday we got some kind of TACO. And Brent crude is now trading at $101.5/b as a result rather than at $112-114/b as it did no the high yesterday.
But what really matters in our view is the political situation on the ground in Iran. Will hardliners continue to hold power or will a more pragmatic faction gain power?
If the hardliners remain in power then oil pain should extend all the way to US midterm elections. The hardliners were apparently still in charge as of last week. Iran immediately retaliated and damaged LNG infrastructure in Qatar after Israel hit Iranian South Pars. The SoH was still closed and all messages coming out of Iran indicated defiance. Hardliners continues in power has a huge consequence for oil prices going forward. The regime has played its ’oil-weapon’ (closing or chocking the Strait of Hormuz). It is using it to achieve political goals. Deterrence: it needs to be so politically and economically expensive to attack Iran that it won’t happen again in the future. Or at least that the US/Israel thinks 10-times over before they attack again. The highest Brent crude oil closing price since the start of the war is $112.19/b last Friday. In comparison the 20-year inflation adjusted Brent price is $103/b. So Brent crude last Friday at $112.19/b isn’t a shockingly high price. And it is still far below the nominal high of $148/b from 2008 which is $220/b if inflation adjusted. So once in a lifetime Iran activates its most powerful weapon. The oil weapon. It needs to show the power of this weapon and it needs to reap political gains. Getting Brent to $112/b and intraday high of $119.5/b (9 March) isn’t a display of the power of that weapon. And it is not a deterrence against future attacks.
So if the hardliners remain in power in Iran, then the SoH will likely remain chocked all the way to US midterm elections and Brent crude will at a minimum go above the historical nominal high of $148/b from 2008.
Thus the outlook for the oil price for the rest of the year doesn’t depend all that much of whether Trump pulls a TACO or not. Stops bombing or not. It depends more on who is in charge in Iran. If it is the hardliners, then deterrence against future attacks via chocking of the SoH and high oil prices is the likely line of action. It is impacting the world but the Iranian ’oil-weapon’ is directed towards the US president and the the US midterm elections.
If a pragmatic faction gets to power in Iran, then a very prosperous future is possible. However, if power is shifting towards a more pragmatic faction in Iran then a completely different direction could evolve. Such a faction could possibly be open for cooperation with the US and the GCC and possibly put its issues versus Israel aside. Then the prosperity we have seen evolving in Dubai could be a possible future also for Iran.
So far it looks like the hardliners are fully in charge. As far as we can see, the hardliners are still fully in control in Iran. That points towards continued chocking of the SoH and oil prices ticking higher as global inventories (the oil market buffers) are drawn lower. And not just for a few more weeks, but possibly all the way to the US midterm elections.


Brent crude up USD 9/bl on the week… ”deal around the corner” narrative fades
Market Still Betting on Timely Resolution, But Each Day Raises Shortage Risk

Christian Kopfer om läget för oljan

Marknaden måste börja betrakta de höga kopparpriserna som det nya normala

Det fysiska spotpriset på brentolja har slagit nytt rekord

40 minuter med Javier Blas om hur världen verkligen påverkas av energikrisen
Det fysiska spotpriset på brentolja har slagit nytt rekord
Marknaden måste börja betrakta de höga kopparpriserna som det nya normala
Christian Kopfer om läget för oljan

Efter tillväxten: Guldbrev satsar på expansion i Europa
-
 Nyheter3 veckor sedan
40 minuter med Javier Blas om hur världen verkligen påverkas av energikrisen
-
 Nyheter3 veckor sedan
Det fysiska spotpriset på brentolja har slagit nytt rekord
-
 Nyheter3 veckor sedan
Marknaden måste börja betrakta de höga kopparpriserna som det nya normala
-
 Nyheter2 veckor sedan
Christian Kopfer om läget för oljan
-
 Nyheter3 veckor sedan
Efter tillväxten: Guldbrev satsar på expansion i Europa
-
Analys5 dagar sedan
Market Still Betting on Timely Resolution, But Each Day Raises Shortage Risk
-
Analys1 dag sedan
Brent crude up USD 9/bl on the week… ”deal around the corner” narrative fades