

Analys
SEB – Råvarukommentarer, 15 september 2014

Rekommendationer
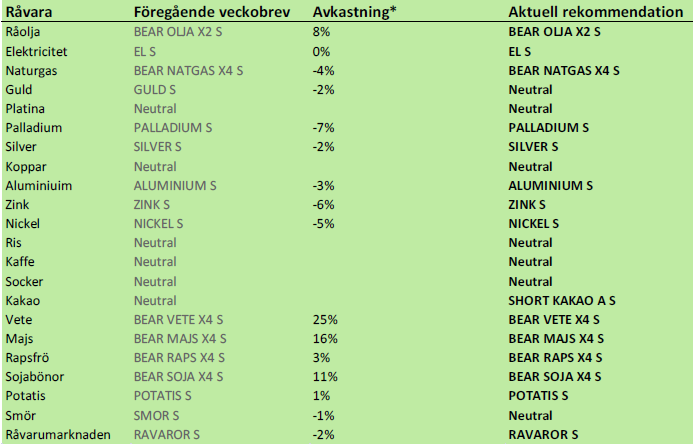
Råolja – Brent
OPECs strategi är att hålla oljepriset på en nivå där ökningen av global efterfrågan på olja kan mättas med en ökning av produktionen av olja utanför OPEC. OPEC kan fortsätta att producera på nuvarande nivå i många år, utan allt för stora investeringar.
Oljepriset ska alltså enligt OPEC balansera på den nivå där break-even ligger utanför OPEC. OPEC själva producerar på i genomsnitt 20 dollar per fat, utan tillväxt. Det finns många olika produktionskostnader utanför OPEC, inte minst beroende på olika höga produktionsskatter. Om global ökning av oljeefterfrågan är hög, måste priset vara högre, för att stimulera produktionstillväxt utanför OPEC. Om global efterfrågetillväxt är låg, så behöver stimulansen utanför OPEC inte vara lika hög. Så här ser prognosen ut från OPEC:
(Non-OPEC supply growth) jämfört med (Global demand growth)
2013: +1.3 mb/d versus +1.2 mb/d
2014: +1.6 mb/d versus +0.9 mb/d
2015: +1.3 mb/d versus +1.2 mb/d
I dagens scenario av relativt svag global efterfrågeökning har vi alltså en situation där 100 dollar per fat ger en stark stimulans till produktionsökning utanför OPEC under 2014 med +1.6 mb/d. Samtidigt leder 100 dollar per fat till en svag konsumtionsökning på bara 0.9 mb/d under 2014, dvs OPEC:s del av kakan krymper med 0.7 mb/d under året.
100 dollar per fat är alltså för högt i år, enligt OPEC. OPEC kan dra ner produktionen för att upprätthålla 100 dollar per fat. Saudiarabien sänkte också helt följdriktigt produktionen med 400 kb/d i augusti. Detta skedde också samtidigt som Libyen kom tillbaka som producent med 7-800 kb/d i produktionstakt.
Så vad kommer OPEC att göra framöver? Saudiarabien kommer knappast att vilja ta på sig hela ransoneringsjobbet. De andra måste också komma in på banan. Ska man komma till förhandlingsbordet är det bäst att komma med så upp-pumpad produktion som möljigt, en hög nivå att förhandla ner ifrån. Således är det ogynnsamt även för Saudiarabien att dra ner allt för mycket.
Vid en svag global efterfrågesituation ska oljepriset vara 80 dollar per fat för att dämpa produktionstillväxten utanför OPEC. Denna sanning förändras dock snabbt, eftersom ”frackingtekniken” förbättras i så snabb takt, och för att stimulera global tillväxt i efterfrågan.
Om efterfrågan är stark ska priset vara 100 dollar per fat.
MENA-risken är fortsatt väldigt hög vad gäller utbudssidan. Libyens oljeproduktion kan försvinna med kort varsel lika fort som den tillkommit.
Raffinaderierna håller just nu på att ställa om till vinterproduktion och de kommer tillbaka till full kapacitet under den andra halvan av oktober. Då kan oljemarknaden stramas upp igen.
Irans premiärminister Rouhani måste få avtalet om kärnvapen/kärnkraft i hamn innan årets slut. Efter det kan det bli politiskt svårt att köra processen vidare.
Brent crude är nu på 98.7 dollar par fat, alltså bara 1.3 dollar under 100 dollar, som är den tydligt önskade nivån för OPEC. Strukturen i marknaden är emellertid markant annorlunda än den vi sett det senaste året. Det råder produktionsöverskott i marknaden och den är i starkt contango i början av terminskurvan. Notera också att priset har fallit samtidigt som dollarn har stärkts. Dollarförstärkningen motsvarar ett prisfall på 5 dollar per fat.
Det kom också en ny IEA-rapport i veckan. Den karaktäriserades av svag tillväxt i oljeefterfrågan. Svagheten är störst i EU och i Kina. Ökningen i efterfrågan under det andra kvartalet i år stannade på bara 0.5 mb/d mätt på årsbasis!
Samtidigt var non-OPEC-supply growth +1.6 mb/d. OPEC:s kaka krymper.
Detta beror på den tekniska revolution som fracking innebär, som har ersatt den gamla utbudskurvan med en helt ny. Lägg därtill att USA.s energipolitik med välvilja ser på när frackingtekniken ökar inhemsk produktion och sänker beroendet av MENA och OPEC. Med ett oberoende vad gäller olja slipper USA rycka ut för att stabilisera den kroniskt instabila MENA-regionen. Värdet av att slippa kostnaderna för att agera global polismakt är naturligtvis mycket, mycket stort. Väldigt många globala bråkmakare får sin finansiering från ett högt oljepris och fracking är det bästa, och ändå fredliga vapnet mot dessa. Det finns alltså även en säkerhetspolitisk anledning till att via fracking, ta knäcken på det höga oljepriset.
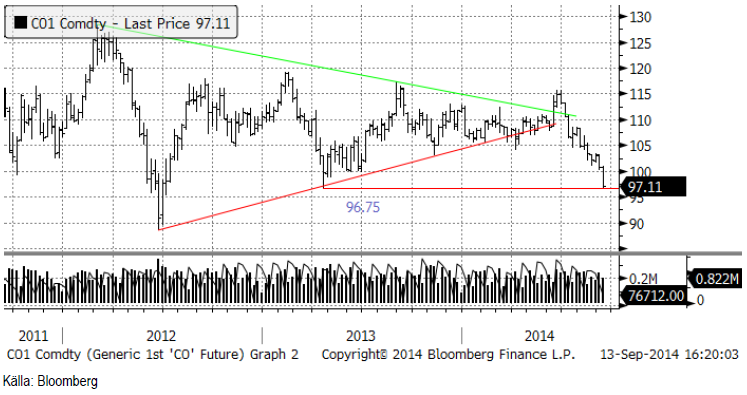
Nedan ser vi oljepriset i ett vecko-chart. Priset är nästan nere på 96.75, som är ett tekniskt stöd från botten under våren förra året. Under det stödet finns nästa stöd vid 90 dollar per fat.
Råoljelagren i USA sjönk 1 mbbl till 358.6 mbbl.
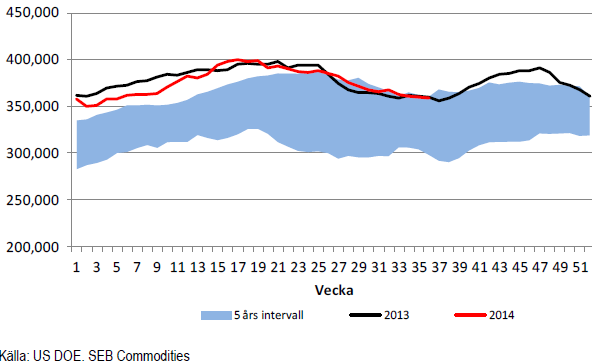
Importen av olja minskade marginellt i veckan till 7.621 miljoner fat.
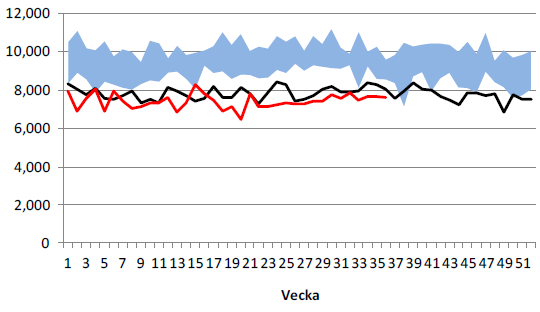
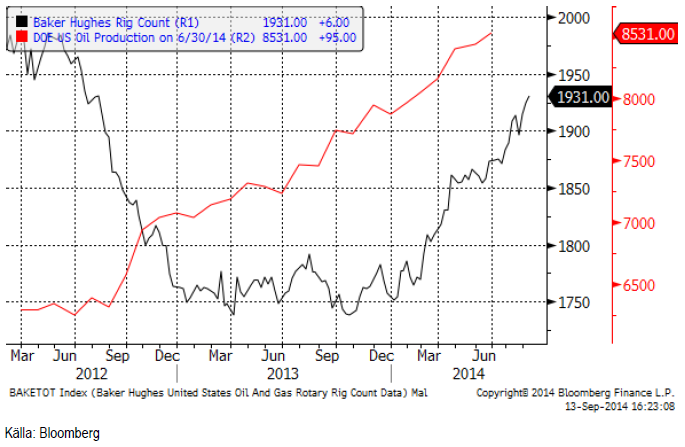
Nedan ser vi ett diagram på antalet oljeriggar i USA, enligt Baker Hughes statistik (svart) och USA:s oljeproduktion enligt US DOE på 8.357 mbpd. Antalet borr-riggar steg i veckan från 1925 till 1931.
Vi rekommenderar alltså på kort sikt en försiktig kortposition t ex med BEAR OLJA X2 S.
Elektricitet
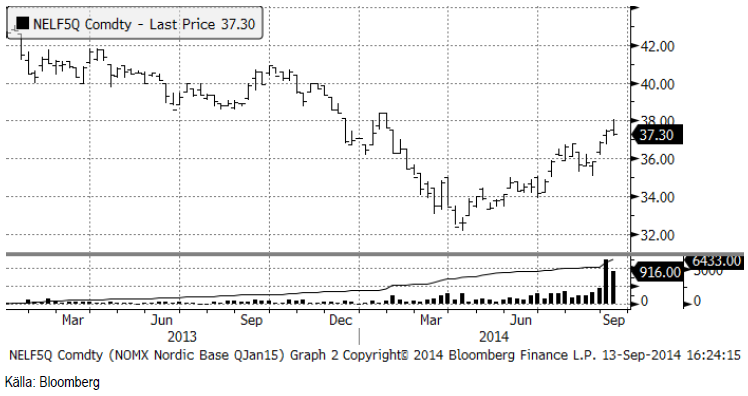
Certifikaten har nu bytt till att följa det första kvartalets kontrakt för år 2015. I veckochartet nedan ser vi att priset på det backade under förra veckan. Uppgången bromsas av att det finns ett tekniskt motstånd precis ovanför vid ca 38.5 euro per MWh.
Marknaden handlar nu lite sidledes, men vi tror det är större sannolikhet för en fortsatt prisuppgång, än att priset ska gå ner.
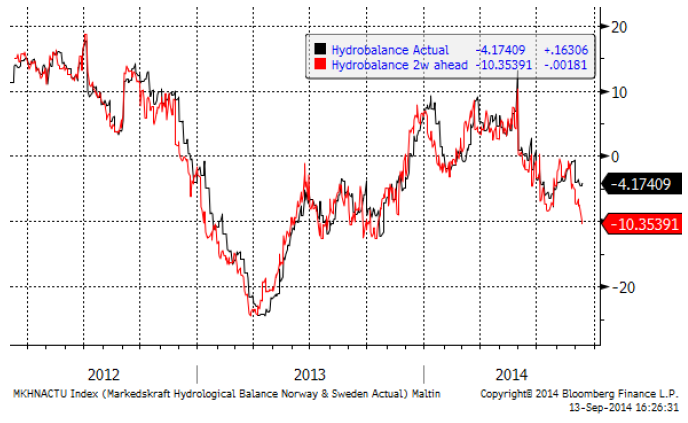
Hydrologisk balans har enligt 2-veckors prognosen försvagats. Från förra veckans underskott på -7.6 TWh har den sjunkit till ett underskott på 10.4 TWh.
Vi rekommenderar köp av EL S om priset kommer ner lite.
Naturgas
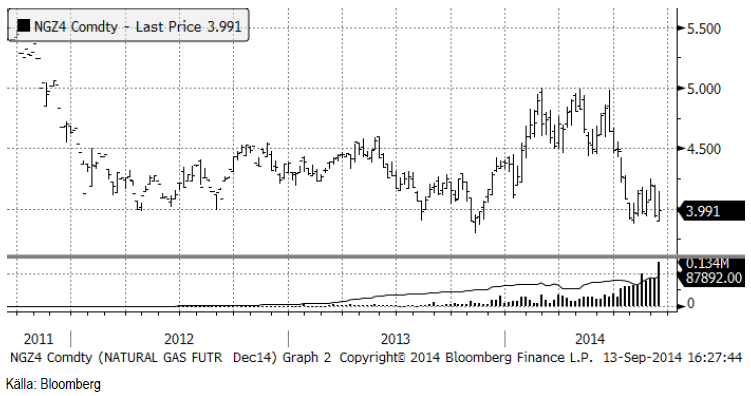
Naturgaspriset (decemberkontraktet) var ganska volatilt i veckan, men stängde bara marginellt över förra veckans stängningspris. Priset står och väger, men vi tror att det mest sannolika trots allt är att priset lämnar de senaste veckornas konsolideringsfas och sjunker ner mot 3.50. Vi håller fast vid vår investering i BEAR NATGAS X4 S.
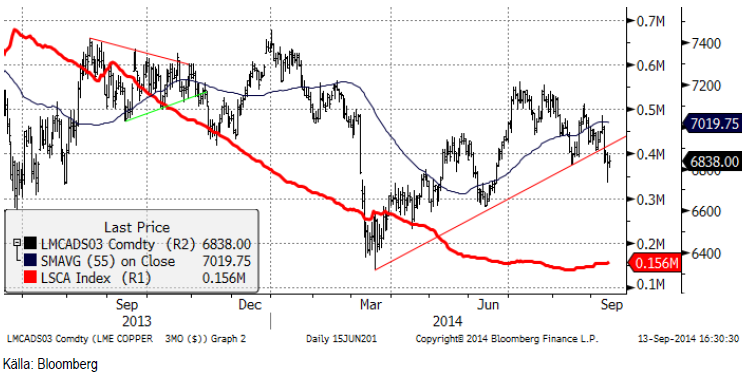
Koppar
Den stigande pristrenden är bruten. Koppar är den udda medlemmen av LME-familjen. Vi är inte särskilt positiva, snarare något negativa i vår vy av prisutvecklingen framöver. Vi tror att prisutvecklingen det närmaste året blir mer eller mindre ”sideways”.
Ryssland tar bort sin exportskatt på 10% på koppar. Detta är inte någon nyhet, men i dagens sanktionsfixerade omvärld, kan det vara en viktig faktor. Det ger Ryska producenter ett incitament att exportera katoder till EU.
Importen till Kina visar en årsvis förändring på -12%. Det förklaras delvis av Qingdao-skandalen tidigare i år. Det är emellertid inte något som marknaden tycker om att se, eftersom Kina är så central för kopparmarknadens efterfrågan. Dessutom kom Grasberggruvans (Freeport McMoRan). koncentratexport igång igen i juli. Kopparmarknadens fundamentala balans försämras alltså från två håll.
Vi rekommenderar neutral position i koppar.
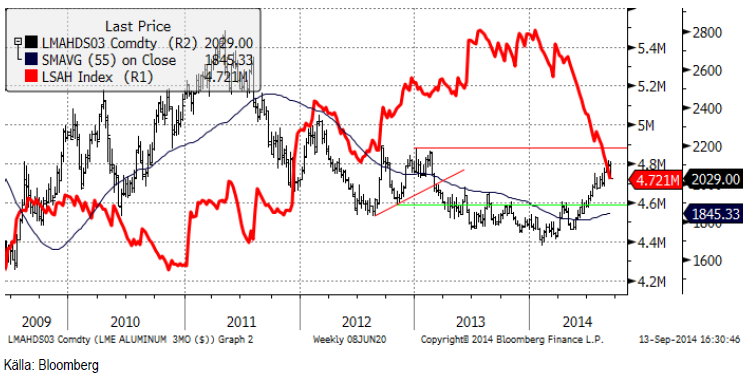
Aluminium
Vi tror att aluminiummarknaden kommer att röra sig ”sidledes” ett tag. Den branta uppåtgående pristrenden är bruten. Vi tycker att det är rimligt att det sker eftersom marknaden har varit något ”överhettad”. Den mest troliga utvecklingen är att priset nu fluktuerar inom intervallet 2000 – 2150 dollar. Det finns en möjlighet att utbudet ökar som svar på de lite högre priserna och det begränsar uppsidan. Å andra sidan är efterfrågan på aluminium relativt stark och borde bli ännu starkare när vi kommer in i det fjärde kvartalet, så nersidan borde vara begränsad i priset. Taktiskt, talar det för en strategi där man försöker köpa på nedgångar (mot 2000 dollar) och sälja på uppgångar (mot 2150).
Vi fortsätter alltså med köprekommendation på ALUMINIUM S.
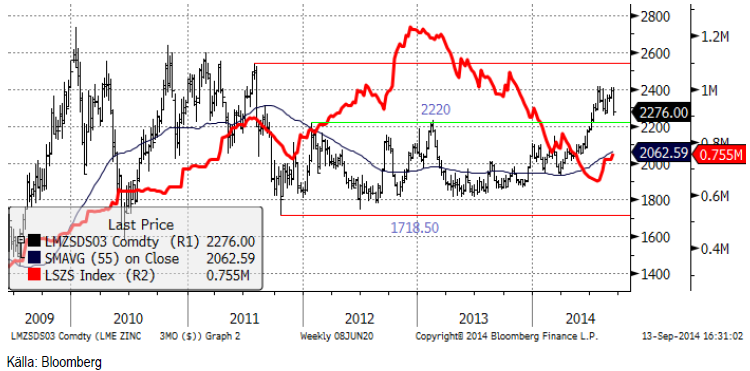
Zink
Zinkmarknaden är tillbaka på ruta ett. Zinkmarknaden har varit i en positiv pristrend sedan förra året. Detta är fundamentalt motiverat av successivt förbättrad balans. Den bästa källan och där detta syns tydligast finner man i the International Lead and Zinc Study Groups (ILZSG) rapporter. Vår rekommendation att öka på köpta positioner i zink vid rekylen nedåt i augusti till 2250 dollar visade sig rätt. Därifrån gick marknaden hela vägen upp till 2400 dollar på kort tid. Men på bara en vecka föll priset hela vägen tillbaka ner igen! Rapporter från marknaden antyder att många producenter tog tillfället i akt att prissäkra på de attraktiva höga nivåerna.
Tekniskt vände priset ner från tidigare motståndsnivåer. Det var inte konstigt att prisuppgången skulle stöta på patrull där. Rekylen nedåt inträffade samtidigt som andra marknader utvecklades svagt. Basmetaller, ädelmetaller, olja och hela jordbruksproduktsegmentet utvecklades svagt i veckan och det är inte bara en stark dollar som ligger bakom. Även om rekylen i zink kan vara oroväckande, anser vi att zinkmarknadens fundamentala situation med gradvis förbättring, gör zink till en av de mer köpvärda råvarorna och vi tycker att metallen är köpvärd på de här nuvarande nivåerna.
Vi rekommenderar köp av ZINK S.
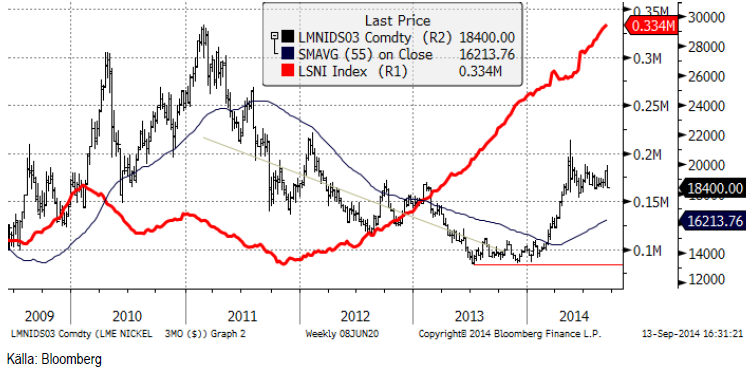
Nickel
Vi skrev för en vecka sedan att vi tyckte att haussen upp mot 20,000 dollar var lite för tidig. Veckans högsta pris på 19,940 dollar per ton noterades direkt på morgonen i måndags. Marknaden orkade inte ta sig över motståndet från förra toppen, utan vände därefter direkt nedåt. Veckans lägsta pris noterades under asiatisk handel på fredag morgon, på 18320 dollar. Så marknaden är tillbaka på ruta ett. Priset är nere på samma nivå som förra rekylen nedåt bottnade ut på.
Reuters rapporterar att en Filippinsk politiker propagerar för att ett eventuellt exportförbud av malm från landet ska skjutas upp i fem år, för att ge industrin en möjlighet att bygga upp smältverkskapacitet inom landet. Så inget har egentligen förändrats. Det viktiga för nickelmarknaden är hur situationen i Indonesien förändras. Det mesta tyder på en gradvis förbättring i de fundamentala balanserna (mindre utbud, större efterfrågan). Som vi har påpekat förut, det är avgörande att detta också börjar visa sig i den viktigaste indikatorn av alla, i LME-lagret. För närvarande går det att med lite god vilja skönja en utplaning i lagerutvecklingen, men knappast någon klar trendförändring än.
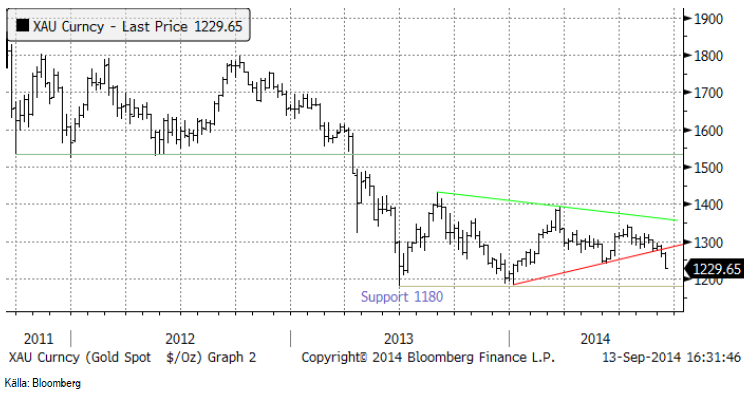
Guld
Priset på guld, som bröt den tekniska triangelformationen för ett par veckor sedan, har fortsatt att rasa i pris. Vi rekommenderar såld position av guld i dollartermer.
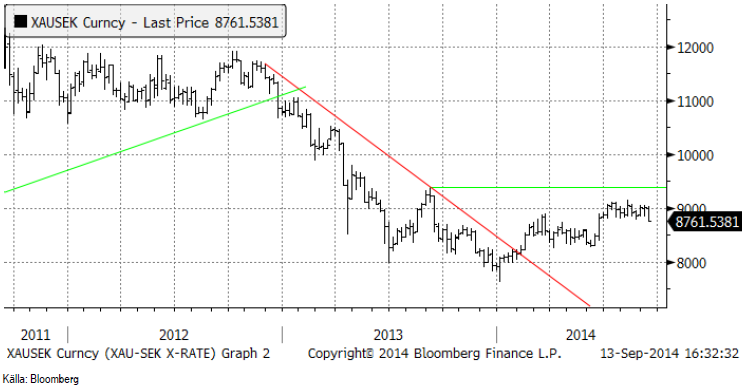
Chartet för guld i kronor (och i euro med för den delen) ser närmast ut som en omvänd head-and-shouldersformation, som alltså indikerar att stigande pris kan vara förestående. Vad detta kanske egentligen säger är att USD/SEK och USD/EUR kan vara köpvärd.
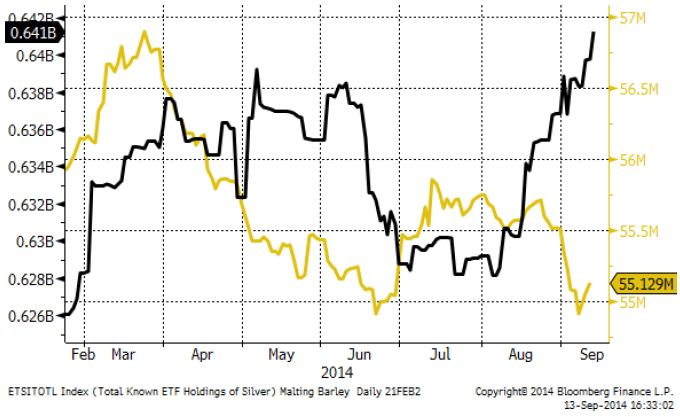
Det har fortsatt att vara inflöden i silver som investering. Även guld fick en släng av sleven i veckan som gick.
Vi rekommenderar sälj av guld i dollartermer. Eftersom GULD S är en investering i guld i kron-termer väljer vi att stanna vid neutral vy. Den som vill kanske kan köpa en BEAR GULD X4 S, som till största delen har en kort position i guld i dollartermer. Den är dock också köpt med hävstång 1 USD/SEK.
Silver
Silverpriset, i dollartermer, har brutit det tekniska stödet på 18.70 dollar per uns. Silverpriset stängde på 18.64 dollar i fredags. Vi har tidigare skrivit att stop-loss-nivån ligger vid ca 18.50. Det ser just nu inte särskilt ljust ut.
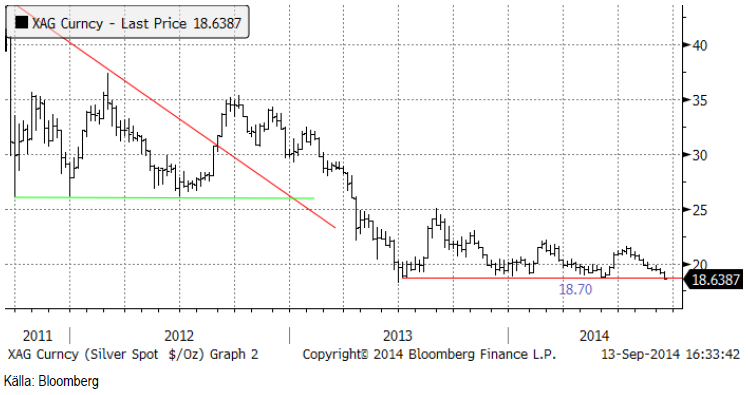
Silver är dock fortfarande ”billigt” i jämförelse med guld.
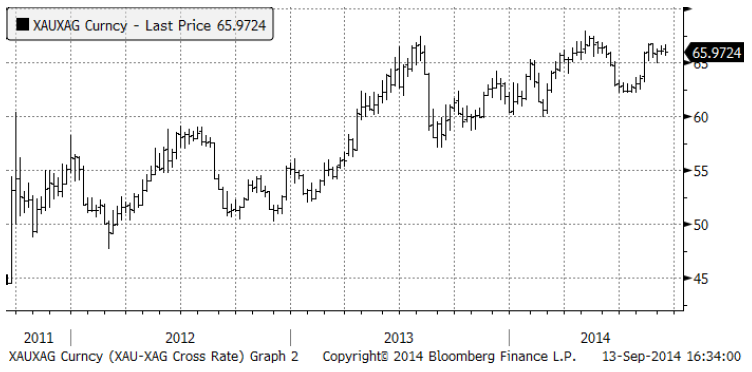
Vi rekommenderar fortfarande köp av silver, men stop-loss bör tas vid 18.50.
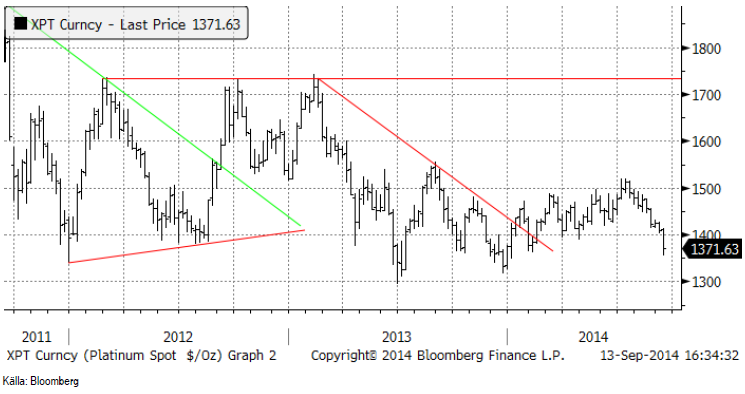
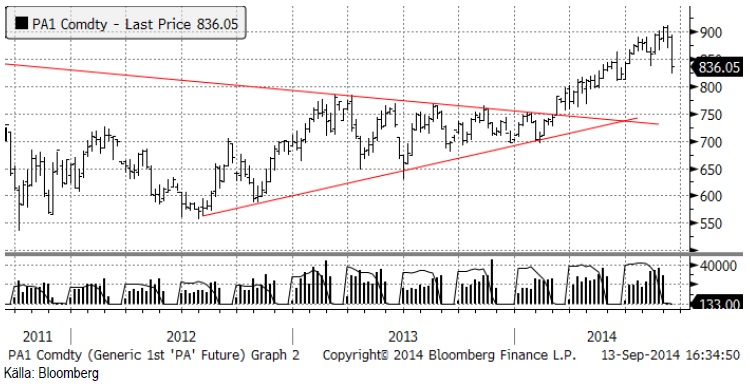
Platina & Palladium
Platinapriset passerade 1400 dollar och föll kraftigt i veckan som gick. Nästa stödnivå är 1300.
Palladium som förra veckan föll under 900 dollar, föll betydligt mycket mer i veckan som gick, ända ner till 836 dollar. Tekniskt stöd finns strax under den kursen.
Nedanför ser vi hur mycket metall som finns i börshandlade fonder för platina respektive palladium. Det har varit små utflöden i båda metallerna.
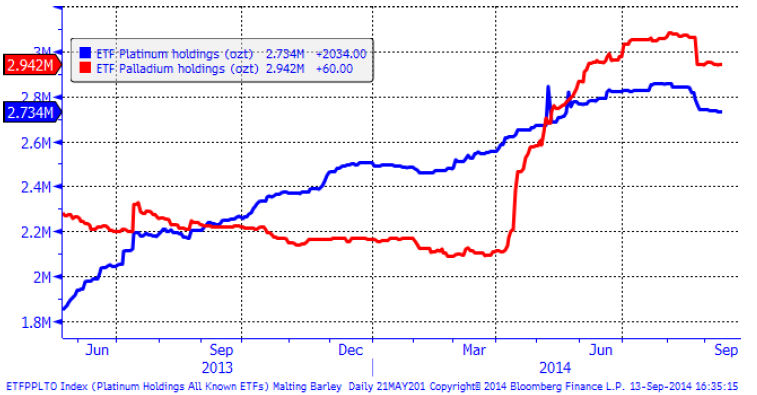
Vi fortsätter med neutrala vy på platina men rekommenderar en köpt position i palladium, helst om man kan köpa på en rekyl nära 800 dollar.
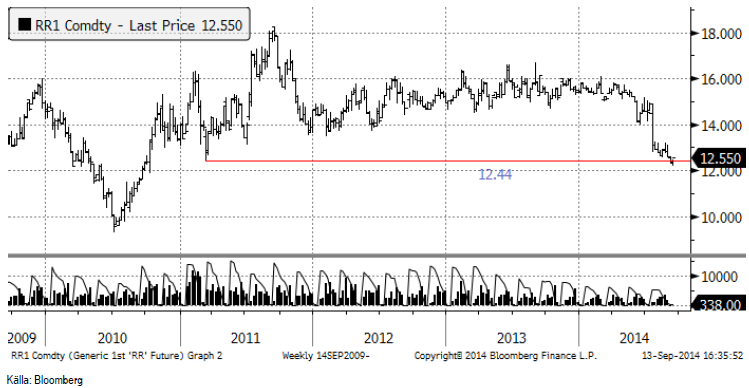
Ris
Priset på ris ligger kvar strax över det tekniska stödet på 12.44 dollar.
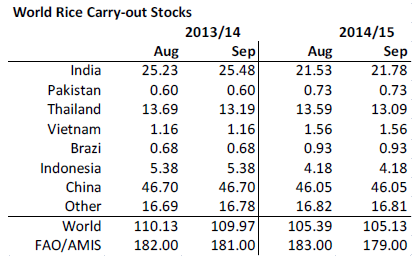
WASDE sänkte global produktion och det gjorde även FAO / AMIS.
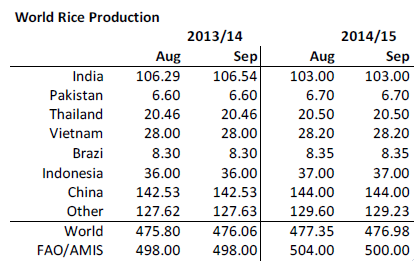
Utgående lager sänktes lika mycket. Både USDA och FAO sänker utgående lager lika mycket som produktionen minskar.
Vi fortsätter med neutral rekommendation.
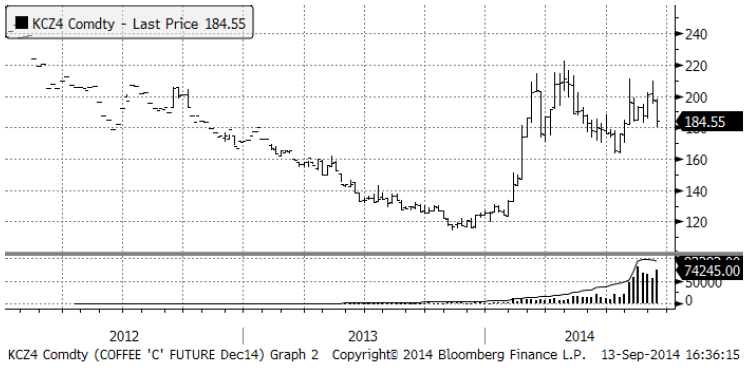
Kaffe
Regn över Minas Gerais gav prisfall på kaffet. 180 cent är ett visst tekniskt stöd. Vi ser väl inte någon trigger åt något håll. Sidledes rörelse tror vi kommer att fortsätta.
Vi rekommenderar neutral position i kaffe.
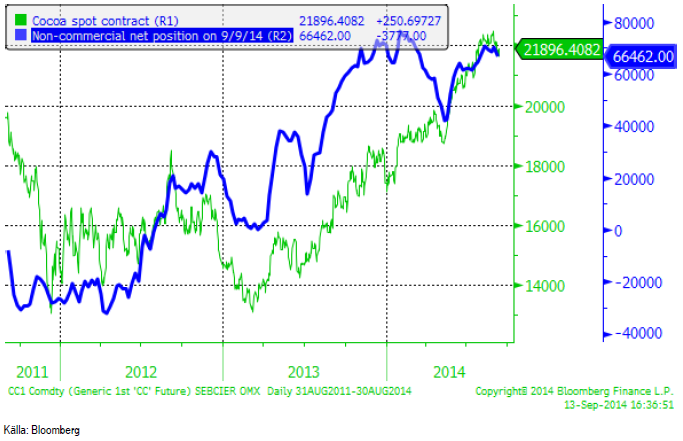
Kakao
Kakao har brutit uppgången och det är nu läge att ligga kort, t ex via ”SHORT KAKAO A S”.
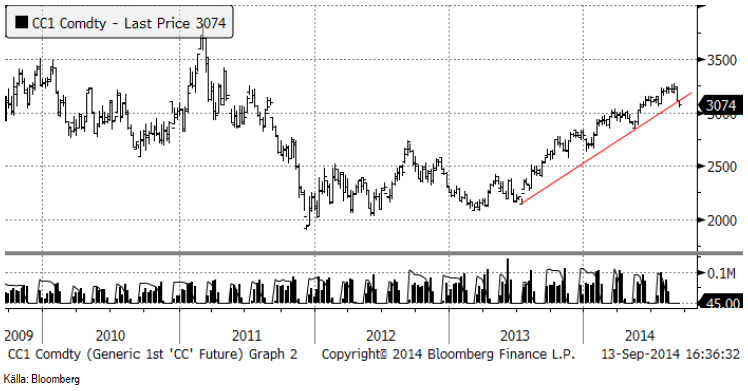
Spekulativ position ligger väldigt högt, historiskt sett. Det kan bli ”trångt i dörren” om trenden vänder nedåt.
För analyser av fler jordbruksråvaror se SEBs jordbruksanalysbrev.
[box]SEB Veckobrev Veckans råvarukommentar är producerat av SEB Merchant Banking och publiceras i samarbete och med tillstånd på Råvarumarknaden.se[/box]
Disclaimer
The information in this document has been compiled by SEB Merchant Banking, a division within Skandinaviska Enskilda Banken AB (publ) (“SEB”).
Opinions contained in this report represent the bank’s present opinion only and are subject to change without notice. All information contained in this report has been compiled in good faith from sources believed to be reliable. However, no representation or warranty, expressed or implied, is made with respect to the completeness or accuracy of its contents and the information is not to be relied upon as authoritative. Anyone considering taking actions based upon the content of this document is urged to base his or her investment decisions upon such investigations as he or she deems necessary. This document is being provided as information only, and no specific actions are being solicited as a result of it; to the extent permitted by law, no liability whatsoever is accepted for any direct or consequential loss arising from use of this document or its contents.
About SEB
SEB is a public company incorporated in Stockholm, Sweden, with limited liability. It is a participant at major Nordic and other European Regulated Markets and Multilateral Trading Facilities (as well as some non-European equivalent markets) for trading in financial instruments, such as markets operated by NASDAQ OMX, NYSE Euronext, London Stock Exchange, Deutsche Börse, Swiss Exchanges, Turquoise and Chi-X. SEB is authorized and regulated by Finansinspektionen in Sweden; it is authorized and subject to limited regulation by the Financial Services Authority for the conduct of designated investment business in the UK, and is subject to the provisions of relevant regulators in all other jurisdictions where SEB conducts operations. SEB Merchant Banking. All rights reserved.

Some rebound but not much. Brent crude rebounded 1.5% yesterday to $65.47/b. This morning it is inching 0.2% up to $65.6/b. The lowest close last week was on Thursday at $64.11/b.

The curve structure is almost as week as it was before the weekend. The rebound we now have gotten post the message from OPEC+ over the weekend is to a large degree a rebound along the curve rather than much strengthening at the front-end of the curve. That part of the curve structure is almost as weak as it was last Thursday.
We are still on a weakening path. The message from OPEC+ over the weekend was we are still on a weakening path with rising supply from the group. It is just not as rapidly weakening as was feared ahead of the weekend when a quota hike of 500 kb/d/mth for November was discussed.
The Brent curve is on its way to full contango with Brent dipping into the $50ies/b. Thus the ongoing weakening we have had in the crude curve since the start of the year, and especially since early June, will continue until the Brent crude oil forward curve is in full contango along with visibly rising US and OECD oil inventories. The front-month Brent contract will then flip down towards the $60/b-line and below into the $50ies/b.
At what point will OPEC+ turn to cuts? The big question then becomes: When will OPEC+ turn around to make some cuts? At what (price) point will they choose to stabilize the market? Because for sure they will. Higher oil inventories, some more shedding of drilling rigs in US shale and Brent into the 50ies somewhere is probably where the group will step in.
There is nothing we have seen from the group so far which indicates that they will close their eyes, let the world drown in oil and the oil price crash to $40/b or below.
The message from OPEC+ is also about balance and stability. The world won’t drown in oil in 2026. The message from the group as far as we manage to interpret it is twofold: 1) Taking back market share which requires a lower price for non-OPEC+ to back off a bit, and 2) Oil market stability and balance. It is not just about 1. Thus fretting about how we are all going to drown in oil in 2026 is totally off the mark by just focusing on point 1.
When to buy cal 2026? Before Christmas when Brent hits $55/b and before OPEC+ holds its last meeting of the year which is likely to be in early December.
Brent crude oil prices have rebounded a bit along the forward curve. Not much strengthening in the structure of the curve. The front-end backwardation is not much stronger today than on its weakest level so far this year which was on Thursday last week.

The front-end backwardation fell to its weakest level so far this year on Thursday last week. A slight pickup yesterday and today, but still very close to the weakest year to date. More oil from OPEC+ in the coming months and softer demand and rising inventories. We are heading for yet softer levels.

Down to the lowest since early May. Brent crude has fallen sharply the latest four days. It closed at USD 64.11/b yesterday which is the lowest since early May. It is staging a 1.3% rebound this morning along with gains in both equities and industrial metals with an added touch of support from a softer USD on top.
What stands out the most to us this week is the collapse in the Dubai one to three months time-spread.
Dubai is medium sour crude. OPEC+ is in general medium sour crude production. Asian refineries are predominantly designed to process medium sour crude. So Dubai is the real measure of the balance between OPEC+ holding back or not versus Asian oil demand for consumption and stock building.
A sharp weakening of the front-end of the Dubai curve. The front-end of the Dubai crude curve has been holding out very solidly throughout this summer while the front-end of the Brent and WTI curves have been steadily softening. But the strength in the Dubai curve in our view was carrying the crude oil market in general. A source of strength in the crude oil market. The core of the strength.
The now finally sharp decline of the front-end of the Dubai crude curve is thus a strong shift. Weakness in the Dubai crude marker is weakness in the core of the oil market. The core which has helped to hold the oil market elevated.
Facts supports the weakening. Add in facts of Iraq lifting production from Kurdistan through Turkey. Saudi Arabia lifting production to 10 mb/d in September (normal production level) and lifting exports as well as domestic demand for oil for power for air con is fading along with summer heat. Add also in counter seasonal rise in US crude and product stocks last week. US oil stocks usually decline by 1.3 mb/week this time of year. Last week they instead rose 6.4 mb/week (+7.2 mb if including SPR). Total US commercial oil stocks are now only 2.1 mb below the 2015-19 seasonal average. US oil stocks normally decline from now to Christmas. If they instead continue to rise, then it will be strongly counter seasonal rise and will create a very strong bearish pressure on oil prices.
Will OPEC+ lift its voluntary quotas by zero, 137 kb/d, 500 kb/d or 1.5 mb/d? On Sunday of course OPEC+ will decide on how much to unwind of the remaining 1.5 mb/d of voluntary quotas for November. Will it be 137 kb/d yet again as for October? Will it be 500 kb/d as was talked about earlier this week? Or will it be a full unwind in one go of 1.5 mb/d? We think most likely now it will be at least 500 kb/d and possibly a full unwind. We discussed this in a not earlier this week: ”500 kb/d of voluntary quotas in October. But a full unwind of 1.5 mb/d”
The strength in the front-end of the Dubai curve held out through summer while Brent and WTI curve structures weakened steadily. That core strength helped to keep flat crude oil prices elevated close to the 70-line. Now also the Dubai curve has given in.

Brent crude oil forward curves

Total US commercial stocks now close to normal. Counter seasonal rise last week. Rest of year?

Total US crude and product stocks on a steady trend higher.

Analys
OPEC+ will likely unwind 500 kb/d of voluntary quotas in October. But a full unwind of 1.5 mb/d in one go could be in the cards
Down to mid-60ies as Iraq lifts production while Saudi may be tired of voluntary cut frugality. The Brent December contract dropped 1.6% yesterday to USD 66.03/b. This morning it is down another 0.3% to USD 65.8/b. The drop in the price came on the back of the combined news that Iraq has resumed 190 kb/d of production in Kurdistan with exports through Turkey while OPEC+ delegates send signals that the group will unwind the remaining 1.65 mb/d (less the 137 kb/d in October) of voluntary cuts at a pace of 500 kb/d per month pace.
Signals of accelerated unwind and Iraqi increase may be connected. Russia, Kazakhstan and Iraq were main offenders versus the voluntary quotas they had agreed to follow. Russia had a production ’debt’ (cumulative overproduction versus quota) of close to 90 mb in March this year while Kazakhstan had a ’debt’ of about 60 mb and the same for Iraq. This apparently made Saudi Arabia angry this spring. Why should Saudi Arabia hold back if the other voluntary cutters were just freeriding? Thus the sudden rapid unwinding of voluntary cuts. That is at least one angle of explanations for the accelerated unwinding.
If the offenders with production debts then refrained from lifting production as the voluntary cuts were rapidly unwinded, then they could ’pay back’ their ’debts’ as they would under-produce versus the new and steadily higher quotas.
Forget about Kazakhstan. Its production was just too far above the quotas with no hope that the country would hold back production due to cross-ownership of oil assets by international oil companies. But Russia and Iraq should be able to do it.
Iraqi cumulative overproduction versus quotas could reach 85-90 mb in October. Iraq has however steadily continued to overproduce by 3-5 mb per month. In July its new and gradually higher quota came close to equal with a cumulative overproduction of only 0.6 mb that month. In August again however its production had an overshoot of 100 kb/d or 3.1 mb for the month. Its cumulative production debt had then risen to close to 80 mb. We don’t know for September yet. But looking at October we now know that its production will likely average close to 4.5 mb/d due to the revival of 190 kb/d of production in Kurdistan. Its quota however will only be 4.24 mb/d. Its overproduction in October will thus likely be around 250 kb/d above its quota with its production debt rising another 7-8 mb to a total of close to 90 mb.
Again, why should Saudi Arabia be frugal while Iraq is freeriding. Better to get rid of the voluntary quotas as quickly as possible and then start all over with clean sheets.
Unwinding the remaining 1.513 mb/d in one go in October? If OPEC+ unwinds the remaining 1.513 mb/d of voluntary cuts in one big go in October, then Iraq’s quota will be around 4.4 mb/d for October versus its likely production of close to 4.5 mb/d for the coming month..
OPEC+ should thus unwind the remaining 1.513 mb/d (1.65 – 0.137 mb/d) in one go for October in order for the quota of Iraq to be able to keep track with Iraq’s actual production increase.
October 5 will show how it plays out. But a quota unwind of at least 500 kb/d for Oct seems likely. An overall increase of at least 500 kb/d in the voluntary quota for October looks likely. But it could be the whole 1.513 mb/d in one go. If the increase in the quota is ’only’ 500 kb/d then Iraqi cumulative production will still rise by 5.7 mb to a total of 85 mb in October.
Iraqi production debt versus quotas will likely rise by 5.7 mb in October if OPEC+ only lifts the overall quota by 500 kb/d in October. Here assuming historical production debt did not rise in September. That Iraq lifts its production by 190 kb/d in October to 4.47 mb/d (August level + 190 kb/d) and that OPEC+ unwinds 500 kb/d of the remining quotas in October when they decide on this on 5 October.


Samtal om sällsynta jordartsmetaller, guld och silver

Brookfield köper bränsleceller för 5 miljarder USD av Bloom Energy för att driva AI-datacenter

Teck Resources kan förse Nordamerika och kanske hela G7 med all germanium som behövs

Leading Edge Materials är på rätt plats i rätt tid

Oljepriset faller efter ny handelskonflikt mellan USA och Kina

Kinas elproduktion slog nytt rekord i augusti, vilket även kolkraft gjorde

Tyskland har så höga elpriser att företag inte har råd att använda elektricitet

OPEC+ missar produktionsmål, stöder oljepriserna

Ett samtal om guld, olja, fjärrvärme och förnybar energi
Brent crude ticks higher on tension, but market structure stays soft
-
 Nyheter4 veckor sedan
Kinas elproduktion slog nytt rekord i augusti, vilket även kolkraft gjorde
-
Nyheter4 veckor sedan
Tyskland har så höga elpriser att företag inte har råd att använda elektricitet
-
 Nyheter3 veckor sedan
OPEC+ missar produktionsmål, stöder oljepriserna
-
 Nyheter3 veckor sedan
Ett samtal om guld, olja, fjärrvärme och förnybar energi
-
Analys4 veckor sedan
Brent crude ticks higher on tension, but market structure stays soft
-
Analys3 veckor sedan
Are Ukraine’s attacks on Russian energy infrastructure working?
-

 Nyheter2 veckor sedan
Guld nära 4000 USD och silver 50 USD, därför kan de fortsätta stiga
-

 Nyheter3 veckor sedan
Guldpriset uppe på nya höjder, nu 3750 USD