

Analys
SEB Råvarubrev 5 december 2017

 Råvaror: Beskedet om att OPEC/icke OPEC redan nu bestämt sig för att förlänga innevarande produktionsbegränsningar mottogs inte med några större kursrörelser i oljepriset. I princip kan man nog säga att de förlängda begränsningarna fick tummen upp av innehavarna av långa terminskontrakt då nära nog ingen vinsthemtagning noterats. Det är också intressant hur samarbetet mellan Ryssland och Saudiarabien utvecklats och förstärkts vilket ger ytterligare tyngd till överenskommelsen. Det finns dock starka krafter i Ryssland (där ju oljeindustrin till skillnad mot Saudiarabien inte är statlig) för att öka produktionen. Kanske kontrollpunkten i juni kan vara ett tillfälle för Ryssland och övriga icke OPEC att hoppa av? En sådan utveckling skulle också göra att den olja som så småningom ska tillbaka till marknaden kan gör så än mer gradvis. Basmetallerna har fortsatt korrektionerna nedåt ledda av nickel och aluminium som också gav negativa månadssignaler. Kinesiskt stål har stigit kraftigt och nått nivåer vi inte sett på cirka tio år. Ädelmetaller fortsätter att befinna sig i bakvattnet. CO2 glider nedåt.

Anders Söderberg, Redaktör
Valuta: Dollarn har, understödd av en amerikansk skatteöverenskommelse och en kommande räntehöjning, fortsatt att ta tillbaka tidigare förlorad mark. Rörelsen är särskilt märkbar i USD/SEK då vi fått både en starkare dollar men också en allt svagare krona givet den allt oroligare bostadsmarknaden samt kommande PPM flöden, där en majoritet placeras i utländska fonder (= kronförsäljningar).
En placering i certifikat och warranter är förknippat med risker. Du kan förlora hela ditt investerade kapital. Läs mer om riskerna i SEB:s offentliggjorda Grundprospekt för certifikat- och warrantprogram på seb.se/cert eller seb.se/mini
OLJA BRENT
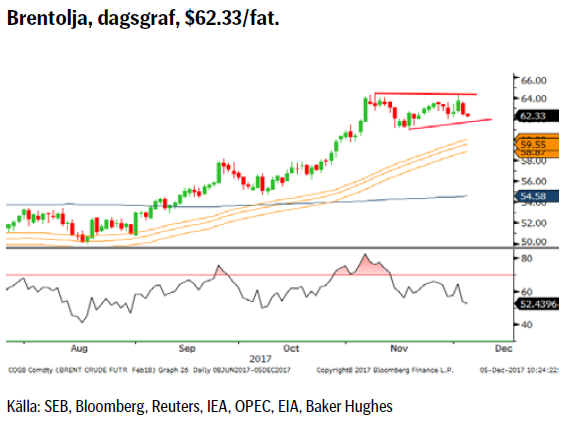 Lite överraskande, i alla fall för oss, att OPEC/icke OPEC redan vid förra veckans möte beslutade om en förlängning av innevarande produktionsbegränsningar från 31/3 till 31/12 2018. Dessutom klargjorde man att när överenskommelsen upphör kommer man inte att tillåta att de globala lagren ökar dvs. de kommer att skruva på kranen i lämplig takt. Dessutom lägger man in en kontrollpunkt vid mötet i juni. Beskedet bör ta bort en del nedåtrisk då framför allt Saudiarabien deklarerade att det inte kommer att bli fråga om ett plötsligt ökat utbud av 1,8m fpd utan en gradvis och övervakad produktionsökning. Saudierna har ju också allt intresse av att hålla priset uppe inför börsnoteringen av 5 % av Aramco (~100 miljarder USD). Det återstår dock nu att se hur de amerikanska skifferproducenterna tar in beskedet om förlängningen. Tillfrågade säger tre av de större fristående aktörerna att de inte har någon plan på att kraftigt öka antalet borriggar.
Konklusion: Positiv konsolidering efter OPEC’s besked.
OBSERVATIONER
+ Att OPEC redan nu förlängde produktionsbegränsningarna.
+ Att förlängningen nu också omfattar Libyen och Nigeria.
+ OPEC’s besked om exitstrategi, att gradvis öka produktionen.
+ Geopolitikens återkomst
+ Dollarkorrektionen har tappat fart.
+ Kurvans negativa lutning (backwardation) då det lättare att ligga lång.
+ Långa spekulativa nettopositioner är mycket stora.
+ Både IEA och OPEC har nu uppgraderat prognoserna för efterfrågan på olja (OPEC ser nu ett underskott 20185).
+ Situationen i Venezuela är kaotisk.
+ Tekniskt ligger vi i en positiv konsolidering.
– Nettopositioneringen är väldigt stor = framtida utbud.
– Om den geopolitiska situationen lugnar sig.
– EIA och OPEC justerar upp am. skifferoljeproduktion för 2018.
– Antalet borrade men inte igångsatta oljebrunnar, s.k. DUC’s (Drilled but UnCompleted) bara ökar.
Tillgängliga certifikat:
BULL OLJA X1, X2, X4, X5, & X10 S
BEAR OLJA X1, X2, X4, X5 & X10 S
ALUMINIUM
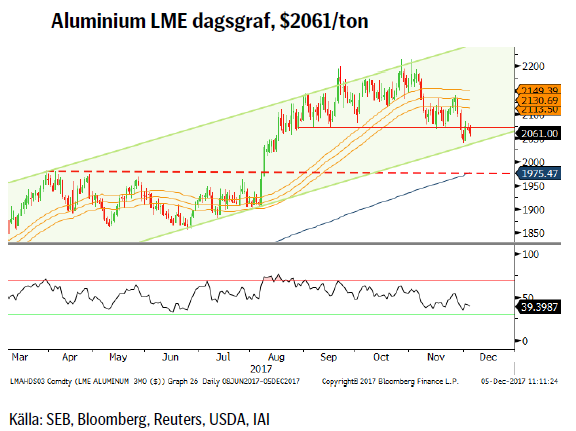 Så har då korrektionen nått ett förstahandsmål, golvet i den stigande kanalen. Givet att vi nu är inne i den period av året (15/11- 15/3) där kinesiska myndigheter i år för första gången kan tvinga fram stängningar i de fyra provinser med största luftföroreningsproblemen bör göra att nedsidan nu bör vara något begränsad. Effekten av de tidigare nedslagen på ”illegal” produktion börjar nu synas i statistiken då kinesisk produktion under september minskade med 6,6 %. Dock bör man betänka att nedstängningar av produktion inte är någon snabb och billig åtgärd varför myndigheterna sannolikt kommer att vara rätt restriktiva med dessa åtgärder.
Konklusion: Än så länge kvar i den stigande kanalen.
OBSERVATIONER
+ Ökad risk för att brist på el (kol) och aluminiumoxid pga. miljömässiga neddragningar pressar upp priset på alu.
+ Signaler om lägre utbyggnadplaner för 2018 än 2017.
+ Positiv dollarreaktion på skatteuppgörelsen.
+ Global efterfrågeökning är fortsatt stark (troligen den starkaste av de vanliga basmetallerna kommande år).
+ Den kinesiska kampen för en bättre miljö, det s.k. Blue Sky Inititative är mycket allvarligt och långsiktigt menat.
+ Kostnadsgolvet har flyttats upp med nästan 25 % i år.
+ Risken för temporära framtvingade stängningar av smältverk och kolkraftverk under den kinesiska vintersäsongen (15/11-15/3).
+ Tekniskt fortsatt i den stigande trendkanalen.
– Begränsningarna i Kina bör pressa tillväxten något nedåt.
– Ökad produktion (från statliga bolag) i pipen för nästa år.
– Återuppstart i flera länder bl.a. USA.
– Omallokering av kinesiska smältverk till inre Mongoliet där luftföroreningsproblematiken är ringa.
– Kinesisk skulduppbyggnad oroande snabb/hög vilken möts av stigande räntor.
– Lägre infrastruktur och bostadsinvesteringar i Kina.
– Tekniskt så utgör 55-dagars bandet nu en viktig motståndsnivå (över $2140 utlöses nya signaler om nya toppar).
Tillgängliga certifikat:
BULL ALUMINIUM X1, X2 & X4 S
BEAR ALUMINIUM X1, X2 & X4 S
GULD
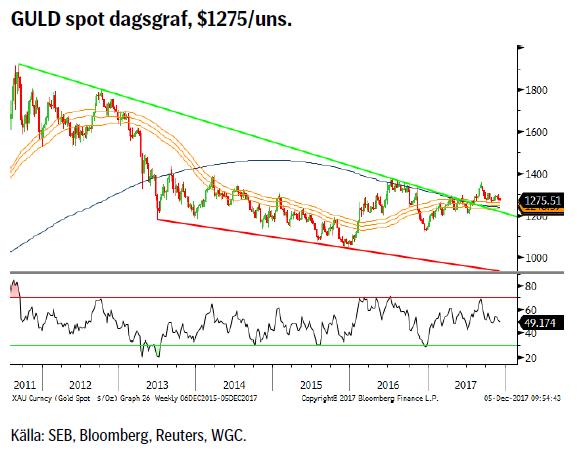 Nästa räntehöjning, från 1,25 – 1,50 %, i USA närmar sig nu med stormsteg något som marknaden mer eller mindre för närvarande har prisat in (98,3 % sannolikhet i skrivande stund). Höjningen bör också medföra att reala Fed funds åter blir positiv, en faktor som bör tynga guldet något. Även den amerikanska senatens godkännande av Trump’s skattepaket tyngde guldet då det förväntas ge ökad tillväxt och en starkare dollar (vilket dock återstår att se).
Konklusion: Ser ut att avsluta 2017 på den svaga sidan.
OBSERVATIONER
+ Inflöden till guld ETF:er förra veckan.
+ 2017 blir första året med uppgång i efterfrågan från elektroniksektorn sedan 2010.
+ Nordkorea har hettat till igen.
+ Den spekulativa nettopositionen fortsätter att öka (både nya långa & stängda korta positioner).
+ Produktionen föll med 2% under tredje kvartalet.
+ Centralbanker har åter dykt upp som köpare.
+ Efterfrågan på mynt och tackor drevs framför allt av kineser.
+ Amerikanskt skuldtak kommer åter i fokus nästa månad.
+ Ökad geopolitisk risk i Mellanöstern
+ Asiatisk fysisk import fortsatt stark.
+ SPDR guld ETF godkända enligt den nya Shariastandarden.
+ Tekniskt fortsatt kvar över den långa trendlinjen & 55v bandet.
– Amerikansk räntehöjning den 13 december.
– Klubbandet av den amerikanska skattererformen.
– Dåligt gensvar på spänningarna Saudiarabien/Iran.
– Venezuelas konkurs kan tvinga fram försäljningar (om de nu har något guld kvar?).
– Säsongsmönstret talar för fallande guldpris.
– Den spekulativa positioneringen är fortsatt relativt stor varför en nedgång i pris riskerar att tvinga fram stopp försäljningar.
– Realräntorna är i stigande.
– Tekniskt negativt med försäljningar vid varje försök till uppgång.
Tillgängliga certifikat:
BULL GULD X1, X2, X4, X5 & X10 S
BEAR GULD X1, X2, X4, X5 & X10 S
USD/SEK
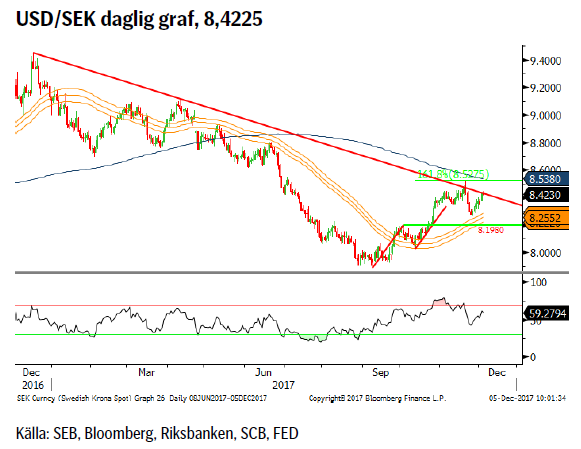 PPM-flöden där majoriteten av de 39,5 miljarderna placeras i utländska tillgångar, godkännandet av det amerikanska skattepaketet samt den kommande amerikanska räntehöjningen (13/12) har eldat på USD/SEK genom både starkare dollar och svagare krona. Även oron på den svenska bostadsmarknaden är på marginalen en SEK negativ faktor (EUR/SEK i skrivande stund åter över 10:an).
Konklusion: Återvunnen styrka.
OBSERVATIONER
+ Godkänd amerikansk skattereform
+ 39,5 miljarder SEK i PPM medel på väg.
+ Fed höjer räntan den 13/12 (just nu 98,3 % sannolikhet).
+ Allt fler signaler om fallande lägenhetspriser.
+ Regeringsbildningen i Tyskland kärvar alltjämt.
+ FED har börjat minska sin balansräkning.
+ Kronindex, KIX, har vänt upp från en viktig teknisk nivå.
+ Korträntedifferensen har fortsatt att öka.
+ Tekniskt ligger vi positivt ovanför det stigande 55d mv bandet.
+ Tekniskt skulle ett brott ovanför 8,5280 vara väldigt positivt.
– ECB & Riksbanken är fortsatt duvaktiga.
– Synkroniserad global tillväxt är bra för små exportländer.
– Om Riksbanken snabbare än förväntat blir mer hökaktig vilket vi inte tror sker förrän ECB visar vägen.
– Tekniskt fick vi en negativ veckovändningssignal förra veckan.
– Tekniskt så vände vi ned exakt ifrån huvud/skuldra-målet, 8.5275.
Tillgängliga certifikat:
BULL USDSEK X1 & X4 S
BEAR USDSEK X1 & X4 S
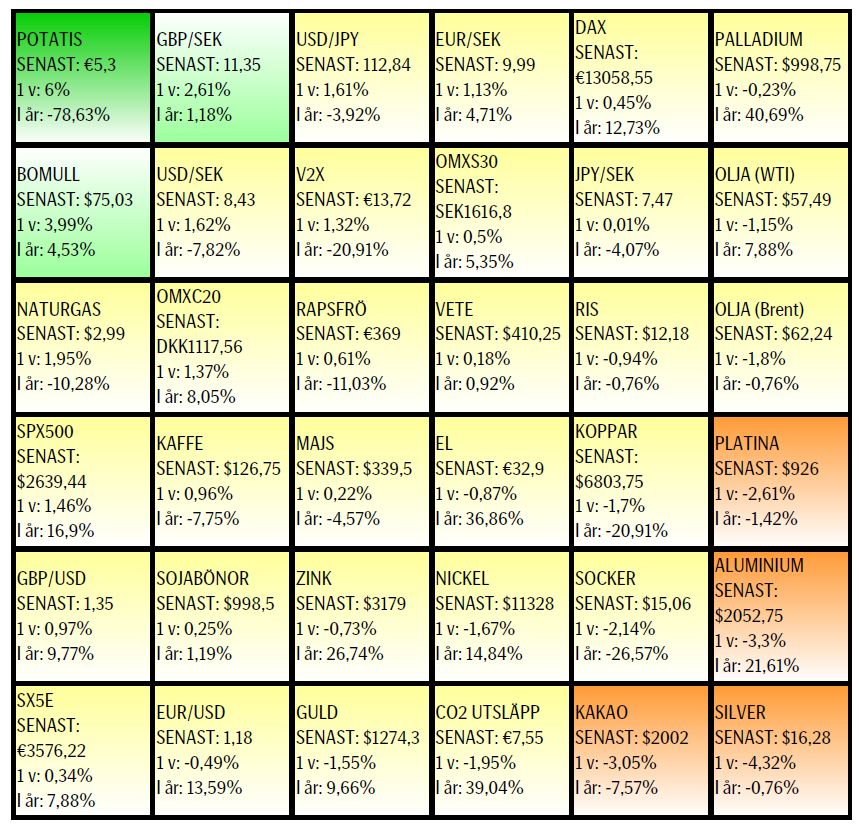
UTVECKLING SENASTE VECKAN SAMT SEDAN ÅRETS BÖRJAN
[box]SEB Veckobrev Veckans råvarukommentar är producerat av SEB:s Commodities Sales desk och publiceras i samarbete och med tillstånd på Råvarumarknaden.se[/box]
KÄLLOR
Bloomberg, Reuters, SEB
VILLKOR
För varje enskilt certifikat/mini future finns Slutliga Villkor som anger de fullständiga villkoren. Slutliga Villkor finns tillgängligt på kurssidan för respektive certifikat/mini future på www.seb.se, Börs & finans, fliken Strukturerade placeringar.
RISKER
En sammanfattning av de risker som är förknippade med Börshandlade certifikat generellt finns i Produktbroschyren för respektive certifikat eller mini future som är tillgängligt på seb.se/cert respektive seb.se/mini. För en fullständig bild av riskerna behöver du ta del av SEB:s offentliggjorda Grundprospekt för Certifikat- och Warrantprogram som är publicerat på www.seb.se/cert respektive seb.se/mini.
DISCLAIMER
Detta marknadsföringsmaterial, framtaget av SEB:s Commodities Sales desk, har upprättats enbart i informationssyfte.
Även om innehållet är baserat på källor som SEB bedömt som tillförlitliga ansvarar SEB inte för fel eller brister i informationen. Den utgör inte oberoende, objektiv investeringsanalys och skyddas därför inte av de bestämmelser som SEB har infört för att förebygga potentiella intressekonflikter. Yttranden från SEB:s Commodities Sales desk kan vara oförenliga med tidigare publicerat material från SEB, då den senare hänvisas uppmanas du att läsa den fullständiga rapporten innan någon åtgärd vidtas.
Dokumentationen utgör inte någon investeringsrådgivning och tillhandahålls till dig utan hänsyn till dina investeringsmål. Du uppmanas att självständigt bedöma och komplettera uppgifterna i denna dokumentation och att basera dina investeringsbeslut på material som bedöms erforderligt. Alla framåtblickande uttalanden, åsikter och förväntningar är föremål för risker, osäkerheter och andra faktorer och kan orsaka att det faktiska resultatet avviker väsentligt från det förväntade. Historisk avkastning är ingen garanti för framtida resultat. Detta dokument utgör inte ett erbjudande att teckna några värdepapper eller andra finansiella instrument. SEB svarar inte för förlust eller skada – direkt eller indirekt, eller av vad slag det vara må – som kan uppkomma till följd av användandet av detta material eller dess innehåll.
Observera att det kan förekomma att SEB, dess ledamöter, dess anställda eller dess moder- och/eller dotterbolag vid olika tillfällen innehar, har innehaft eller kommer att inneha aktier, positioner, rådgivningsuppdrag i samband med corporate finance-transaktioner, investment- eller merchantbanking-uppdrag och/eller lån i de bolag/finansiella instrument som nämns i materialet.
Materialet är avsett för mottagaren, all spridning, distribuering mångfaldigande eller annan användning av detta meddelande får inte ske utan SEB:s medgivande. Materialet riktar sig inte till personer vars medverkan kräver ytterligare prospekt, registrerings- eller andra åtgärder än vad som följer av svensk rätt. Det åligger var och en att iaktta sådana restriktioner. Materialet får inte distribueras i eller till land där distribution kräver ovan nämnda åtgärder eller strider mot reglering i sådant land. Materialet riktar sig således inte till fysiska eller juridiska personer hemmahörande i USA eller i något annat land där publicering eller tillhandahållande av materialet är förbjudet eller strider mot tillämpliga bestämmelser i landet.
Oaktat detta får SEB tillåta omfördelning av materialet till utvald tredje part i enlighet med gällande avtal. Materialet får inte spridas till fysiska eller juridiska personer som är medborgare eller har hemvist i ett land där sådan spridning är otillåten enligt tillämplig lag eller annan bestämmelse.
Skandinaviska Enskilda Banken AB (publ) är ett publikt aktiebolag och står under tillsyn av Finansinspektionen samt de lokala finansiella tillsynsmyndigheter i varje jurisdiktionen där SEB har filial eller dotterbolag.
When it starts to move lower it moves rather quickly. Gaza, China, IEA. Brent crude is down 2.1% today to $62/b after having traded as high as $66.58/b last Thursday and above $70/b in late September. The sell-off follows the truce/peace in Gaze, a flareup in US-China trade and yet another bearish oil outlook from the IEA.

A lasting peace in Gaze could drive crude oil at sea to onshore stocks. A lasting peace in Gaza would probably calm down the Houthis and thus allow more normal shipments of crude oil to sail through the Suez Canal, the Red Sea and out through the Bab-el-Mandeb Strait. Crude oil at sea has risen from 48 mb in April to now 91 mb versus a pre-Covid normal of about 50-60 mb. The rise to 91 mb is probably the result of crude sailing around Africa to be shot to pieces by the Houthis. If sailings were to normalize through the Suez Canal, then it could free up some 40 mb in transit at sea moving onshore into stocks.
The US-China trade conflict is of course bearish for demand if it continues.
Bearish IEA yet again. Getting closer to 2026. Credibility rises. We expect OPEC to cut end of 2025. The bearish monthly report from the IEA is what it is, but the closer we get to 2026, the more likely the IEA is of being ball-park right in its outlook. In its monthly report today the IEA estimates that the need for crude oil from OPEC in 2026 will be 25.4 mb/d versus production by the group in September of 29.1 mb/d. The group thus needs to do some serious cutting at the end of 2025 if it wants to keep the market balanced and avoid inventories from skyrocketing. Given that IEA is correct that is. We do however expect OPEC to implement cuts to avoid a large increase in inventories in Q1-26. The group will probably revert to cuts either at its early December meeting when they discuss production for January or in early January when they discuss production for February. The oil price will likely head yet lower until the group reverts to cuts.
Dubai: The Mid-East anchor dragging crude oil lower. Surplus emerging in Mid-East pricing. Crude oil prices held surprisingly strong all through the summer. A sign and a key source of that strength came from the strength in the front-end backwardation of the Dubai crude oil curve. It held out strong from mid-June and all until late September with an average 1-3mth time-spread premium of $1.8/b from mid-June to end of September. The 1-3mth time-spreads for Brent and WTI however were in steady deterioration from late June while their flat prices probably were held up by the strength coming from the Persian Gulf. Then in late September the strength in the Dubai curve suddenly collapsed. Since the start of October it has been weaker than both the Brent and the WTI curves. The Dubai 1-3mth time-spread now only stands at $0.25/b. The Middle East is now exporting more as it is producing more and also consuming less following elevated summer crude burn for power (Aircon) etc.
The only bear-element missing is a sudden and solid rise in OECD stocks. The only thing that is missing for the bear-case everyone have been waiting for is a solid, visible rise in OECD stocks in general and US oil stocks specifically. So watch out for US API indications tomorrow and official US oil inventories on Thursday.
No sign of any kind of fire-sale of oil from Saudi Arabia yet. To what we can see, Saudi Arabia is not at all struggling to sell its oil. It only lowered its Official Selling Prices (OSPs) to Asia marginally for November. A surplus market + Saudi determination to sell its oil to the market would normally lead to a sharp lowering of Saudi OSPs to Asia. Not yet at least and not for November.
The 5yr contract close to fixed at $68/b. Of importance with respect to how far down oil can/will go. When the oil market moves into a surplus then the spot price starts to trade in a large discount to the 5yr contract. Typically $10-15/b below the 5yr contract on average in bear-years (2009, 2015, 2016, 2020). But the 5yr contract is usually pulled lower as well thus making this approach a moving target. But the 5yr contract price has now been rock solidly been pegged to $68/b since 2022. And in the 2022 bull-year (Brent spot average $99/b), the 5yr contract only went to $72/b on average. If we assume that the same goes for the downside and that 2026 is a bear-year then the 5yr goes to $64/b while the spot is trading at a $10-15/b discount to that. That would imply an average spot price next year of $49-54/b. But that is if OPEC doesn’t revert to cuts and instead keeps production flowing. We think OPEC(+) will trim/cut production as needed into 2026 to prevent a huge build-up in global oil stocks and a crash in prices. But for now we are still heading lower. Into the $50ies/b.
Some rebound but not much. Brent crude rebounded 1.5% yesterday to $65.47/b. This morning it is inching 0.2% up to $65.6/b. The lowest close last week was on Thursday at $64.11/b.
The curve structure is almost as week as it was before the weekend. The rebound we now have gotten post the message from OPEC+ over the weekend is to a large degree a rebound along the curve rather than much strengthening at the front-end of the curve. That part of the curve structure is almost as weak as it was last Thursday.
We are still on a weakening path. The message from OPEC+ over the weekend was we are still on a weakening path with rising supply from the group. It is just not as rapidly weakening as was feared ahead of the weekend when a quota hike of 500 kb/d/mth for November was discussed.
The Brent curve is on its way to full contango with Brent dipping into the $50ies/b. Thus the ongoing weakening we have had in the crude curve since the start of the year, and especially since early June, will continue until the Brent crude oil forward curve is in full contango along with visibly rising US and OECD oil inventories. The front-month Brent contract will then flip down towards the $60/b-line and below into the $50ies/b.
At what point will OPEC+ turn to cuts? The big question then becomes: When will OPEC+ turn around to make some cuts? At what (price) point will they choose to stabilize the market? Because for sure they will. Higher oil inventories, some more shedding of drilling rigs in US shale and Brent into the 50ies somewhere is probably where the group will step in.
There is nothing we have seen from the group so far which indicates that they will close their eyes, let the world drown in oil and the oil price crash to $40/b or below.
The message from OPEC+ is also about balance and stability. The world won’t drown in oil in 2026. The message from the group as far as we manage to interpret it is twofold: 1) Taking back market share which requires a lower price for non-OPEC+ to back off a bit, and 2) Oil market stability and balance. It is not just about 1. Thus fretting about how we are all going to drown in oil in 2026 is totally off the mark by just focusing on point 1.
When to buy cal 2026? Before Christmas when Brent hits $55/b and before OPEC+ holds its last meeting of the year which is likely to be in early December.
Brent crude oil prices have rebounded a bit along the forward curve. Not much strengthening in the structure of the curve. The front-end backwardation is not much stronger today than on its weakest level so far this year which was on Thursday last week.

The front-end backwardation fell to its weakest level so far this year on Thursday last week. A slight pickup yesterday and today, but still very close to the weakest year to date. More oil from OPEC+ in the coming months and softer demand and rising inventories. We are heading for yet softer levels.

Down to the lowest since early May. Brent crude has fallen sharply the latest four days. It closed at USD 64.11/b yesterday which is the lowest since early May. It is staging a 1.3% rebound this morning along with gains in both equities and industrial metals with an added touch of support from a softer USD on top.
What stands out the most to us this week is the collapse in the Dubai one to three months time-spread.
Dubai is medium sour crude. OPEC+ is in general medium sour crude production. Asian refineries are predominantly designed to process medium sour crude. So Dubai is the real measure of the balance between OPEC+ holding back or not versus Asian oil demand for consumption and stock building.
A sharp weakening of the front-end of the Dubai curve. The front-end of the Dubai crude curve has been holding out very solidly throughout this summer while the front-end of the Brent and WTI curves have been steadily softening. But the strength in the Dubai curve in our view was carrying the crude oil market in general. A source of strength in the crude oil market. The core of the strength.
The now finally sharp decline of the front-end of the Dubai crude curve is thus a strong shift. Weakness in the Dubai crude marker is weakness in the core of the oil market. The core which has helped to hold the oil market elevated.
Facts supports the weakening. Add in facts of Iraq lifting production from Kurdistan through Turkey. Saudi Arabia lifting production to 10 mb/d in September (normal production level) and lifting exports as well as domestic demand for oil for power for air con is fading along with summer heat. Add also in counter seasonal rise in US crude and product stocks last week. US oil stocks usually decline by 1.3 mb/week this time of year. Last week they instead rose 6.4 mb/week (+7.2 mb if including SPR). Total US commercial oil stocks are now only 2.1 mb below the 2015-19 seasonal average. US oil stocks normally decline from now to Christmas. If they instead continue to rise, then it will be strongly counter seasonal rise and will create a very strong bearish pressure on oil prices.
Will OPEC+ lift its voluntary quotas by zero, 137 kb/d, 500 kb/d or 1.5 mb/d? On Sunday of course OPEC+ will decide on how much to unwind of the remaining 1.5 mb/d of voluntary quotas for November. Will it be 137 kb/d yet again as for October? Will it be 500 kb/d as was talked about earlier this week? Or will it be a full unwind in one go of 1.5 mb/d? We think most likely now it will be at least 500 kb/d and possibly a full unwind. We discussed this in a not earlier this week: ”500 kb/d of voluntary quotas in October. But a full unwind of 1.5 mb/d”
The strength in the front-end of the Dubai curve held out through summer while Brent and WTI curve structures weakened steadily. That core strength helped to keep flat crude oil prices elevated close to the 70-line. Now also the Dubai curve has given in.

Brent crude oil forward curves

Total US commercial stocks now close to normal. Counter seasonal rise last week. Rest of year?

Total US crude and product stocks on a steady trend higher.


The Mid-East anchor dragging crude oil lower

Samtal om sällsynta jordartsmetaller, guld och silver

Brookfield köper bränsleceller för 5 miljarder USD av Bloom Energy för att driva AI-datacenter

Teck Resources kan förse Nordamerika och kanske hela G7 med all germanium som behövs

Leading Edge Materials är på rätt plats i rätt tid

Kinas elproduktion slog nytt rekord i augusti, vilket även kolkraft gjorde

Tyskland har så höga elpriser att företag inte har råd att använda elektricitet

OPEC+ missar produktionsmål, stöder oljepriserna

Ett samtal om guld, olja, fjärrvärme och förnybar energi
Brent crude ticks higher on tension, but market structure stays soft
-
 Nyheter4 veckor sedan
Kinas elproduktion slog nytt rekord i augusti, vilket även kolkraft gjorde
-
Nyheter4 veckor sedan
Tyskland har så höga elpriser att företag inte har råd att använda elektricitet
-
 Nyheter3 veckor sedan
OPEC+ missar produktionsmål, stöder oljepriserna
-
 Nyheter3 veckor sedan
Ett samtal om guld, olja, fjärrvärme och förnybar energi
-
Analys4 veckor sedan
Brent crude ticks higher on tension, but market structure stays soft
-
Analys3 veckor sedan
Are Ukraine’s attacks on Russian energy infrastructure working?
-

 Nyheter2 veckor sedan
Guld nära 4000 USD och silver 50 USD, därför kan de fortsätta stiga
-

 Nyheter3 veckor sedan
Guldpriset uppe på nya höjder, nu 3750 USD