

Analys
SEB Metals price forecast update

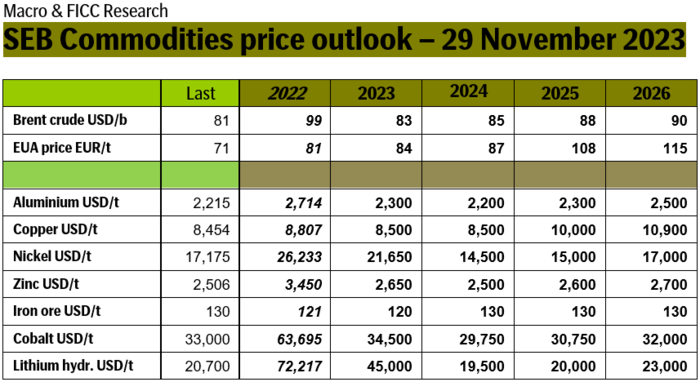
Softer economic growth in 2024 calls for somewhat softer metals prices in 2024. Industrial metals prices as well as other commodity prices exploded during Covid-19 as governments around the world unleashed stimuli in the magnitude of 10x of what was done during the global financial crisis in 2008/09. Consumers shifting spending from services to consumer goods added to the boom. Bloomberg’s industrial metals price index was up 91% in March 2022 versus January 2020 because of this. Global manufacturing PMI peaked in May 2021 and has been fading since and below the 50-line from September 2022 with latest reading at 48.8. Industrial metals prices have faded since their peak in March 2022 but are still 30% higher than they were in January 2020. Even zinc, the worst performing metal, is still 9% above where it was in January 2020. As such one could possibly argue that industrial metals have not yet fully faded from their Covid-19 stimulus boom. One possible explanation could be inflation where US inflation is up 19% over the period. But this still leaves industrial metals up 11% in real terms. Another possible explanation is the big jump in energy prices over the period. While coal and gas prices have fallen back a lot, they are still quite high. The coal price in western Europe is 110% above where it was at the start 2020 and 50% above its 2010-2019 average. Most industrial metals are highly energy intensive to produce with digging and crushing of rocks, smelting, and refining of ore. The current aluminium price of USD 2215/ton is for example well aligned with coal prices. In addition to this there has also been significant closures of zinc and aluminium smelting capacity in Europe which probably have supported prices for these metals.
Global economic growth is forecasted to slow from 3.5% in 2022, to 3.0% in 2023 and then again to 2.9% in 2024 as the big jump in interest rates induce economic pain with a lag. Aligned with this we expect lower industrial metals prices in 2024 than in 2023 though only marginally lower for most of the metals. But the field of metals is wide, and the price action is thus adverse. Copper is likely the metal with the most strained supply and with huge needs in the global energy transition.
Aluminium: Prices will likely be depressed versus marginal costs in 2024. Aluminium from Russia is flowing unhindered to the market. Most is going to China for reprocessing and potentially re-exported while some is going to Turkey and Italy. It is all flowing into the global pool of aluminium and as such impacting the global market balance. The LME 3mth aluminium price is currently well aligned with coal prices and both have traded mostly sideways since June this year. Aluminium premiums in the EU have however fallen 30-40% since mid-June in a sign of weakness there. The global market will likely run a surplus in 2024 with depressed prices versus the marginal cost of production.
Copper: Softer fundamentals in 2024 but with accelerating tightness on the horizon. Copper is currently trading at USD 8470/ton and close to 37% above its early Jan 2020 level. The market is expected to run a slight surplus in 2024 followed by accelerating tightness the following years. Downside price risk for 2024 is thus warranted along with softer global growth. The power of Unions is however getting stronger in Latin America with demands for higher salaries. Strikes have broken out in Peru with production at the Las Bambas copper mine at only 20%. Further strikes and disruptions could quickly put the market into deficit also in 2024.
Nickel: Indonesia pursuing market share over price pushing the price down the cost curve. Indonesia’s nickel production is growing rapidly. Its production reached 1.6 million ton in 2022 (+54% YoY) and accounted for close to 50% of total global supply in 2022. Its share looks set to reach 70% by 2030. Lower prices will stimulate demand and will also force higher cost producers to shut down thus making room for the wave of new supply from Indonesia. Prices will be sluggis the nearest years as Indonesia aims for market share over price.
Zinc: Price has stabilized around USD 2500/t. Weakness in global construction will drive prices lower at times in 2024. The 3mth LME zinc price has fallen from a peak of USD 4499/ton in April 2022 to only USD 2248/ton in May 2023. Since then, it has recovered steadily to USD 2500/ton. Demand could struggle in 2024 as construction globally will likely struggle with high interest rates. But mine closures is a natural counter effect of low prices and will put a floor under prices.
Price outlook
Bjarne Schieldrop
Cheif Commodities Analyst
SEB Commodity Research
Hesitant today. Brent jumped to an intraday high of $66.36/b yesterday after having touched an intraday low of $60.07/b on Monday as Indian and Chinese buyers cancelled some Russian oil purchases and instead redirected their purchases towards the Middle East due to the news US sanctions. Brent is falling back 0.4% this morning to $65.8/b.

It’s our strong view that the only sensible thing is to sell this rally. In all Trump’s unpredictability he has become increasingly predictable. Again and again he has rumbled about how he is going to be tough on Putin. Punish Putin if he won’t agree to peace in Ukraine. Recent rumbling was about the Tomahawk rockets which Trump threatened on 10 October and 12 October to sell/send to Ukraine. Then on 17 October he said that ”the U.S. didn’t want to give away weapons (Tomahawks) it needs”.
All of Trump’s threats towards Putin have been hot air. So far Trump’s threats have been all hot air and threats which later have evaporated after ”great talks with Putin”. After all these repetitions it is very hard to believe that this time will be any different. The new sanctions won’t take effect before 21. November. Trump has already said that: ”he was hoping that these new sanctions would be very short-lived in any case”. Come 21. November these new sanctions will either evaporate like all the other threats Trump has thrown at Putin before fading them. Or the sanctions will be postponed by another 4 weeks or 8 weeks with the appearance that Trump is even more angry with Putin. But so far Trump has done nothing that hurt Putin/Russia. We can’t imagine that this will be different. The only way forward in our view for a propre lasting peace in Ukraine is to turn Ukraine into defensive porcupine equipped with a stinging tail if need be.
China will likely stand up to Trump if new sanctions really materialize on 21 Nov. Just one country has really stood up to Trump in his tariff trade war this year: China. China has come of age and strength. I will no longer be bullied. Trump upped tariffs. China responded in kind. Trump cut China off from high-end computer chips. China put on the breaks on rare earth metals. China won’t be bullied any more and it has the power to stand up. Some Chinese state-owned companies like Sinopec have cancelled some of their Russian purchases. But China’s Foreign Ministry spokesperson Guo Jiakun has stated that China “oppose unilateral sanctions which lack a basis in international law and authorization of the UN Security Council”. Thus no one, not even the US shall unilaterally dictate China from whom they can buy oil or not. This is yet another opportunity for China to show its new strength and stand up to Trump in a show of force. Exactly how China choses to play this remains to be seen. But China won’t be bullied by over something as important as its oil purchases. So best guess here is that China will defy Trump on this. But probably China won’t need to make a bid deal over this. Firstly because these new sanctions will either evaporate as all the other threats or be postponed once we get to 21 November. Secondly because the sanctions are explicit towards US persons and companies but only ”may” be enforced versus non-US entities.
Sanctions is not a reduction in global supply of oil. Just some added layer of friction. Anyhow, the new sanctions won’t reduce the supply of Russian crude oil to the market. It will only increase the friction in the market with yet more need for the shadow fleet and ship to ship transfer of Russian oil to dodge the sanctions. If they materialize at all.
The jump in crude oil prices is probably due to redirections of crude purchases to the Mid-East and not because all speculators are now turned bullish. Has oil rallied because all speculators now suddenly have turned bullish? We don’t think so. Brent crude has probably jumped because some Indian and Chinese oil purchasers of have redirected their purchases from Russia towards the Mid-East just in case the sanctions really materializes on 21 November.
Parts of the Brent crude curve dipping into the high $50ies/b. Brent crude fell 2.3% over the week to Friday. It closed the week at $61.29/b, a slight gain on the day, but also traded to a low of $60.14/b that same day and just barely avoided trading into the $50ies/b. This morning it is risk-on in equities which seems to help industrial metals a little higher. But no such luck for oil. It is down 0.8% at $60.8/b. This week looks set for Brent crude to dip its feet in the $50ies/b. The Brent 3mth contract actually traded into the high $50ies/b on Friday.
The front-end backwardation has been on a weakening foot and is now about to fully disappear. The lowest point of the crude oil curve has also moved steadily lower and lower and its discount to the 5yr contract is now $6.8/b. A solid contango. The Brent 3mth contract did actually dip into the $50ies/b intraday on Friday when it traded to a low point of $59.93/b.
More weakness to come as lots of oil at sea comes to ports. Mid-East OPEC countries have boosted exports along with lower post summer consumption and higher production. The result is highly visibly in oil at sea which increased by 17 mb to 1,311 mb over the week to Sunday. Up 185 mb since mid-August. On its way to discharge at a port somewhere over the coming month or two.
Don’t forget that the oil market path ahead is all down to OPEC+. Remember that what is playing out in the oil market now is all by design by OPEC+. The group has decided that the unwind of the voluntary cuts is what it wants to do. In a combination of meeting demand from consumers as well as taking back market share. But we need to remember that how this plays out going forward is all at the mercy of what OPEC+ decides to do. It will halt the unwinding at some point. It will revert to cuts instead of unwind at some point.
A few months with Brent at $55/b and 40-50 US shale oil rigs kicked out may be what is needed. We think OPEC+ needs to see the exit of another 40-50 drilling rigs in the US shale oil patches to set US shale oil production on a path to of a 1 mb/d year on year decline Dec-25 to Dec-26. We are not there yet. But a 2-3 months period with Brent crude averaging $55/b would probably do it.
Oil on water increased 17 mb over the week to Sunday while oil in transit increased by 23 mb. So less oil was standing still. More was moving.

Crude oil floating storage (stationary more than 7 days). Down 11 mb over week to Sunday

The lowest point of the Brent crude oil curve versus the 5yr contract. Weakest so far this year.

Crude oil 1mth to 3mth time-spreads. Dubai held out strongly through summer, but then that center of strength fell apart in late September and has been leading weakness in crude curves lower since then.

Rebounding along with most markets. But concerns over solidity of Gaza peace may also contribute. Brent crude fell 0.8% yesterday to $61.91/b and its lowest close since May this year. This morning it is bouncing up 0.9% to $62.5/b along with a softer USD amid positive sentiment with both equities and industrial metals moving higher. Concerns that the peace in Gaza may be less solid than what one might hope for also yields some support to Brent. Bets on tech stocks are rebounding, defying fears of trade war. Money moving back into markets. Gold continues upwards its strong trend and a softer dollar helps it higher today as well.
US crude & products probably rose 5.6 mb last week (API) versus a normal seasonal decline of 2.4 mb. The US API last night partial and thus indicative data for US oil inventories. Their data indicates that US crude stocks rose 7.4 mb last week, gasoline stocks rose 3.0 mb while Distillate stocks fell 4.8 mb. Altogether an increase in commercial crude and product stocks of 5.6 mb. Commercial US crude and product stocks normally decline by 2.4 mb this time of year. So seasonally adjusted the US inventories rose 8 mb last week according to the indicative numbers by the API. That is a lot. Also, the counter seasonal trend of rising stocks versus normally declining stocks this time of year looks on a solid pace of continuation. If the API is correct then total US crude and product stocks would stand 41 mb higher than one year ago and 6 mb higher than the 2015-19 average. And if we combine this with our knowledge of a sharp increase in production and exports by OPEC(+) and a large increase in oil at sea, then the current trend in US oil inventories looks set to continue. So higher stocks and lower crude oil prices until OPEC(+) switch to cuts. Actual US oil inventory data today at 18:00 CET.
US commercial crude and product stocks rising to 1293 mb in week 41 if last nights indicative numbers from API are correct.

Crude oil soon coming to a port near you. OPEC has lifted production sharply higher this autumn. At the same time demand for oil in the Middle-East has fallen as we have moved out of summer heat and crude oil burn for power for air-conditioning. The Middle-East oil producers have thus been able to lift exports higher on both accounts. Crude oil and condensates on water has shot up by 177 mb since mid-August. This oil is now on its way to ports around the world. And when they arrive, it will likely help to lift stocks onshore higher. That is probably when we will lose the last bit of front-end backwardation the the crude oil curves. That will help to drive the front-month Brent crude oil price down to the $60/b line and revisit the high $50ies/b. Then the eyes will be all back on OPEC+ when they meet in early November and then again in early December.
Crude oil and condensates at sea have moved straight up by 177 mb since mid-August as OPEC(+) has produced more, consumed less and exported more.


Sell the rally. Trump has become predictable in his unpredictability

Gruvbolaget Boliden överträffade analytikernas förväntningar

Australien och USA investerar 8,5 miljarder USD för försörjningskedja av kritiska mineraler
Brent crude set to dip its feet into the high $50ies/b this week

Vad guldets uppgång egentligen betyder för världen

Goldman Sachs höjer prognosen för guld, tror priset når 4900 USD

Blykalla och amerikanska Oklo inleder ett samarbete

Guld nära 4000 USD och silver 50 USD, därför kan de fortsätta stiga

Leading Edge Materials är på rätt plats i rätt tid

Nytt prisrekord, guld stiger över 4000 USD
-
 Nyheter3 veckor sedan
Goldman Sachs höjer prognosen för guld, tror priset når 4900 USD
-
 Nyheter4 veckor sedan
Blykalla och amerikanska Oklo inleder ett samarbete
-
 Nyheter4 veckor sedan
Guld nära 4000 USD och silver 50 USD, därför kan de fortsätta stiga
-
 Nyheter2 veckor sedan
Leading Edge Materials är på rätt plats i rätt tid
-
 Nyheter3 veckor sedan
Nytt prisrekord, guld stiger över 4000 USD
-

 Nyheter4 veckor sedan
Ett samtal om guld, olja, koppar och stål
-
Analys4 veckor sedan
OPEC+ will likely unwind 500 kb/d of voluntary quotas in October. But a full unwind of 1.5 mb/d in one go could be in the cards
-

 Nyheter4 veckor sedan
Neptune Energy bekräftar enorma litiumfyndigheter i Tyskland