

Analys
SEB Jordbruksprodukter, 27 maj 2013


 Förra veckan fick vi en rekyl uppåt i såväl spannmål som soja. Rapsfröet höll sig kvar efter uppgången veckan innan. Olika rapporter om något sänkta estimat, lite kallare väder på vissa ställen, lite varmare väder på andra och översvämningar nådde marknaden. Dessa detaljer kan dock inte förändra den stora bilden av att det blir en mycket stor skörd av spannmål i år, samtidigt som inköpschefsindex i Kina kom in på sin lägsta nivå på sju månader. Pristrenden i stort är nedåtriktad.
Idag måndag är det Memorial Day i USA och därmed lite mindre handel på marknaderna. Det innebär inte att priset inte kan röra sig.
Odlingsväder
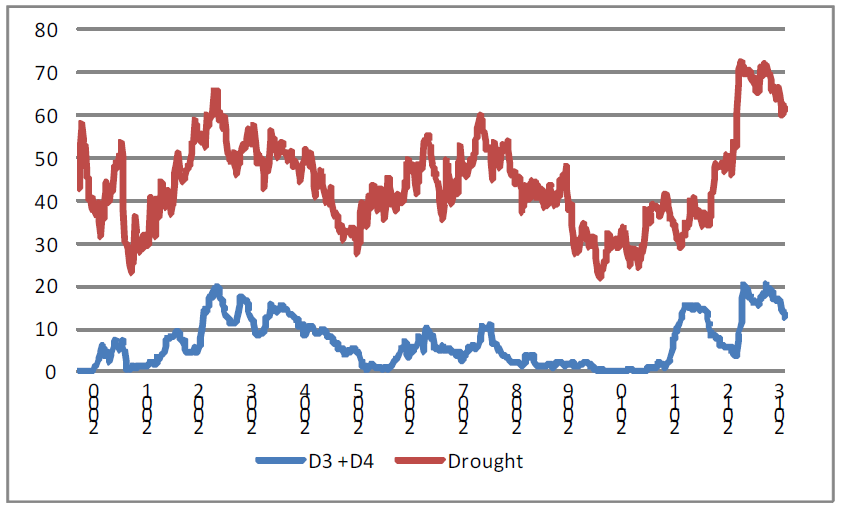
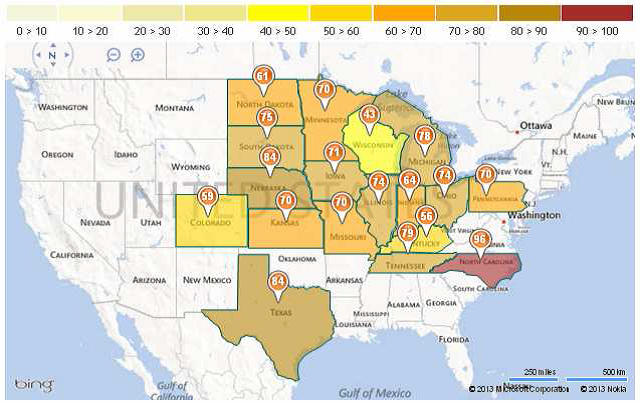
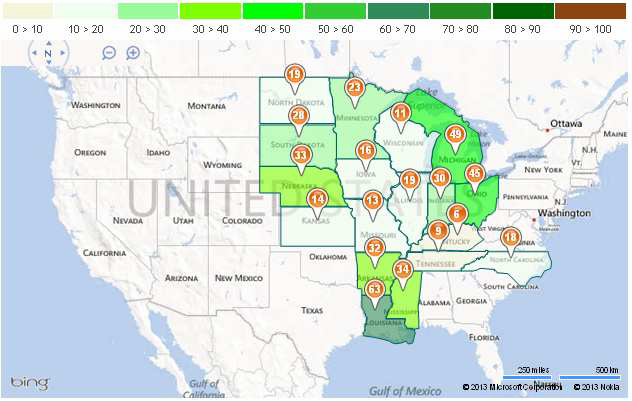
Torkan i USA har fortsatt att minska i USA. Både andelen som är torrare än normalt och framförallt den andel som är drabbad av de värsta formerna av torka har minskat med en procentenhet sedan förra veckan.
Företaget Black Earth Farming har nyligen rapporterat att odlingsvädret är gynnsamt i deras del av Ryssland, men att det är varmare längre söderut. Nedan ser vi en kartbild över västra Asien av prognostiserad temperaturavvikelse från det normala.
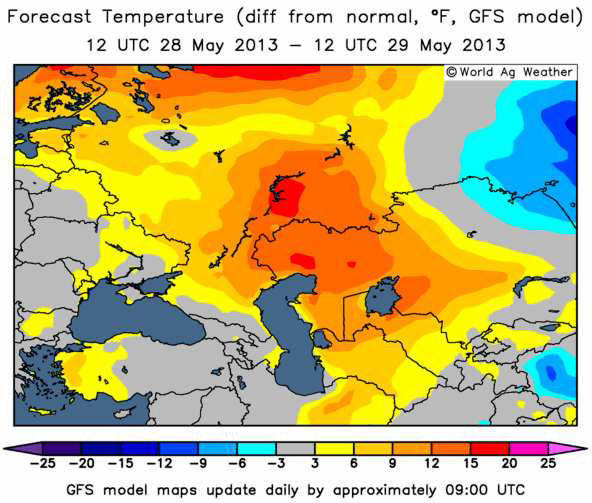
USA fick ordentligt med regn i veckan. Europa är ganska vått med översvämningar till och med i Italien. Västerut, mot Frankrike är temperaturen mycket lägre än normalt. Ryssland har fått nederbörd och normal temperatur, men längre söderut är det som vi sett i kartbilden ovan mycket varmare än normalt. Nya Zeeland har fått regn, i synnerhet över Nordön, men Australien och Argentina och Braslien var i huvudsak torra.
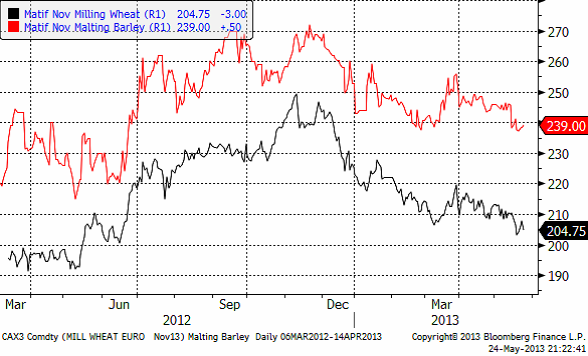
Vete
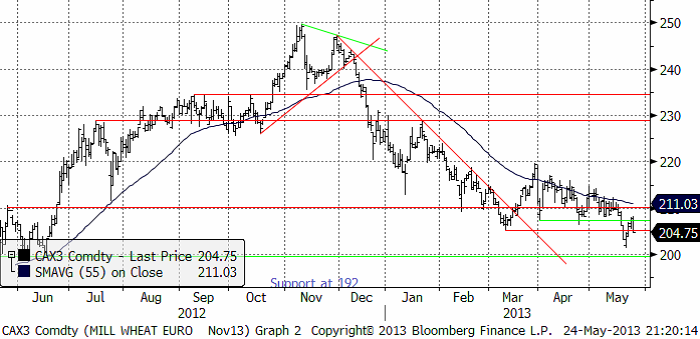
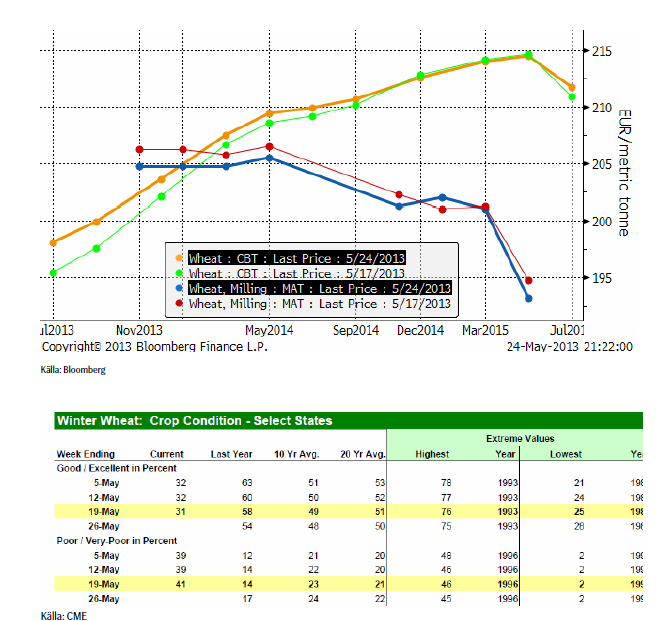
Priset på novemberterminen på Matif inledde veckan med att falla, men rekylerade sedan upp igen. Det är ett mönster man känner igen. Det som brukar följa efter är en förnyad nedgång. Jag förväntar mig att 200 euro testas redan i början av den kommande veckan.
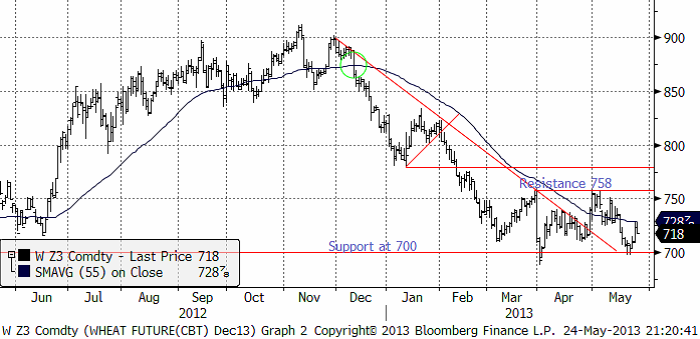
Decemberkontraktet på CBOT rekylerade uppåt. Ibland ser man (magiskt nog) att 55-dagars glidande medelvärde utgör ett stöd eller ett motstånd, t ex vid uppgången i mars. Vi tror att det hände nu också. 700 cent ska testas igen och det tror vi händer den här veckan. Det finns en möjlighet att 700 cent bryts den här veckan.
Nedan ser vi förändringen i terminskurvorna fredag till fredag.
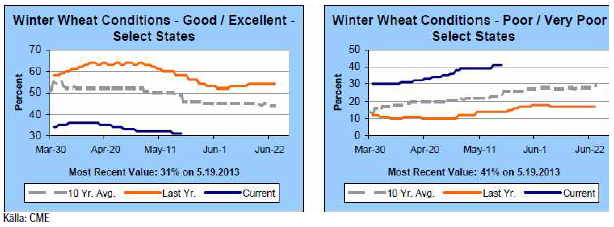
Måndagens Crop Progress rapport från USDA visar att tillståndet för det amerikanska höstvetet fortsätter att försämras. För de 18 stater som rapporterar så klassas 31% som ”good/excellent”, ner 1% från förra veckan och väl under förra årets 58% vid samma tid. Höstvete klassat som ”poor/very poor” uppgår till 41%, en ökning med 2% från förra veckan och väl över förra årets 14% vid samma tid. Andelen höstvete klassat som ”poor/very poor” i de HRW producerande staterna fortsätter att öka, samtidigt som tillståndet för höstvete i de SRW producerande staterna fortsätter att förbättras. Andelen höstvete som har gått i ax fortsätter dock att ligga under genomsnittet, både i de HRW och i de SRW producerande staterna, som en följd av den kalla våren. Per den 19 maj hade 43% gått i ax, vilket är att jämföra med förra årets 80% vid samma tid och det femåriga genomsnittet på 62% vid denna tidpunkt.
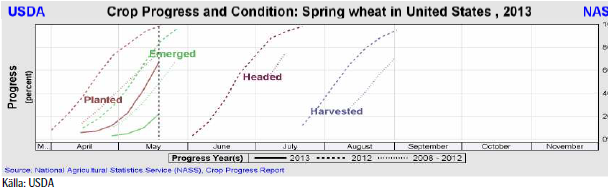
Sådden av vårvete i de 6 största staterna gjorde framsteg i veckan som gick och avancerade till 67%, upp rejält från 43% en vecka innan men fortfarande väl efter förra årets 98% och det femåriga genomsnittet på 76%.
Den största producenten, North Dakota, ligger sist med endast 50% av sådden avklarad, jämfört med dess femåriga genomsnitt på 67% vid den här tiden.
Strategie Grains justerar ner sitt estimat för EU:s veteproduktion 2013/14 med 200 000 ton till 129.8 mt, till följd av lägre areal i Tyskland och Frankrike. Räknar man även in Kroatien, som blir medlem av unionen i juli, så beräknas den totala produktionen att uppgå till 130.9 mt.
Under hela veckan har vi hört rykten om att Kina skulle vara i marknaden för köp av amerikanskt vete. Torsdagens amerikanska exportsiffror, som kom in på 952 600 ton inkl 239 400 t gammal skörd – väl över det estimerade intervallet på 400 000-700 000 ton – innehöll inga försäljningar till Kina men fick priserna på vete att stiga.
I fredags däremot så bekräftade USDA att 180 000 ton SRW vete sålts till Kina för leverans 2013/14 och nu på morgonen rapporterar kinesiska State Administration of Grain att ett kinesiskt företag under förra veckan har köpt ca 600 000 – 650 000 ton amerikanskt vete för leverans mellan juli och september, vilket skulle vara andra gången för i år som Kina gör ett så stort köp av vete från USA.
USDA rapporterar också försäljning av 115 000 ton sojabönor och 360 000 ton majs, bägge med destination Kina.
Jag betraktar dessa saker som saker att hålla koll på. Med den stora skörd som väntas för spannmål i stort är det svårt att se att detaljer som detta skulle kunna förändra trenden nedåt i priserna.
Slutsatsen är att vi behåller vår säljrekommendation på vete.
Maltkorn
Maltkornet höll sig någorlunda starkt i veckan, men om vetet fortsätter ner, får vi nog se ett nedställ på maltkornet också. Trenden är tydligt nedåtriktad.
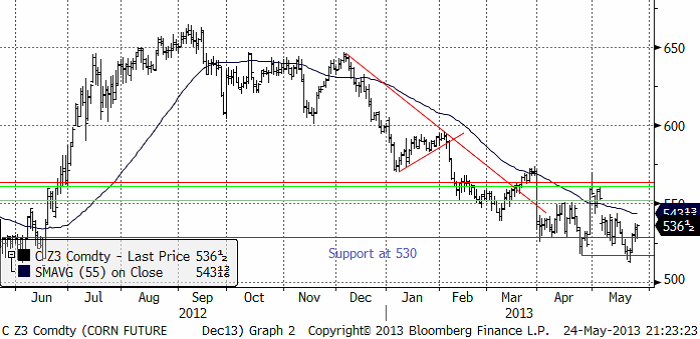
Majs
Majspriset (december 2013) föll under bottennoteringen från april. Allt fler mäklarfirmor börjar avrapportera 400 cent som ”rätt pris” för kommande skörds majs. Att priset då ändå inte hamnar i fritt fall, är ett observandum, trots allt. Med det sagt, tror jag ändå att vi får en nedgång i veckan som kommer.
Till förra helgen hade amerikanska lantbrukare lyckats ta sig till 71% färdigsått genom att på en vecka så en yta som är 2 x Irlands yta. Har de lyckats fortsätta den här takten har de kommit ikapp och kanske rentav hamnat på en nivå som är normal för den här tiden på året.
Som nämnt ovan, visade måndagens Crop Progress att lantbrukarna har dragit nytta av det varma och torra vädret och därmed gjort stora framsteg i sin sådda av majs. Per den 19 maj så var sådden i de 18 största majsproducerande staterna avklarad till 71%, en rekordökning med 43% från 28% en vecka tidigare men något lägre än det femåriga genomsnittet på 79% vid den här tiden. Vårens kalla och blöta väder över majsbältet har gjort att årets sådd ligger markant efter förra årets sådd, då 95% var i marken vid den här tiden. Å andra sidan låg förra årets sådd långt före genomsnittet på grund av att våren då var torr och varm vilket till slut ledde till att grödorna drabbades av den värsta torkan på 50 år.
Den mest markanta ökningen i rapporten står den största producenten Iowa för med 71% av sådden avklarad, upp från 15% veckan innan. Även Illinois, den näst största producenten, noterade en rejäl ökning från 17% till 74%.
I Argentina är skörden klar till 65%, vilket är lite snabbare än förra årets 59%.
Slutsatsen är att vi behåller vår säljrekommendation på majs.
Sojabönor
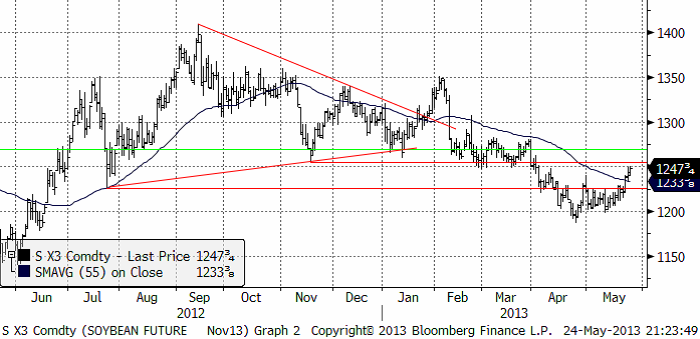
Sojabönorna visade fortsatte att visa oväntad styrka. Priset har stigit upp från 1200 cent upp till 1247 cent när priset ”borde” ha fallit. Vid 1250 finns dock ett starkt tekniskt motstånd, där särskilt många bönder bör ha hängt upp sina säljordrar. Vi tror att uppgången hejdas här.
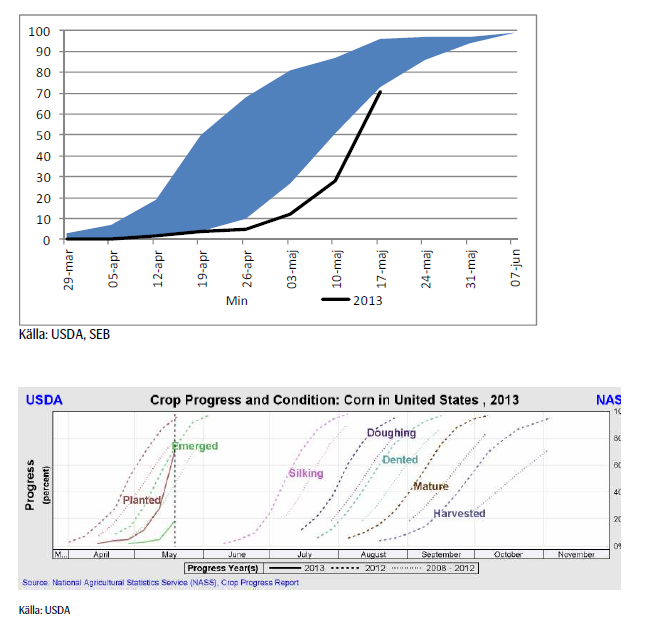
Sådden ligger som tidigare, fortfarande efter vad som är normalt, som vi ser i diagrammet nedan.
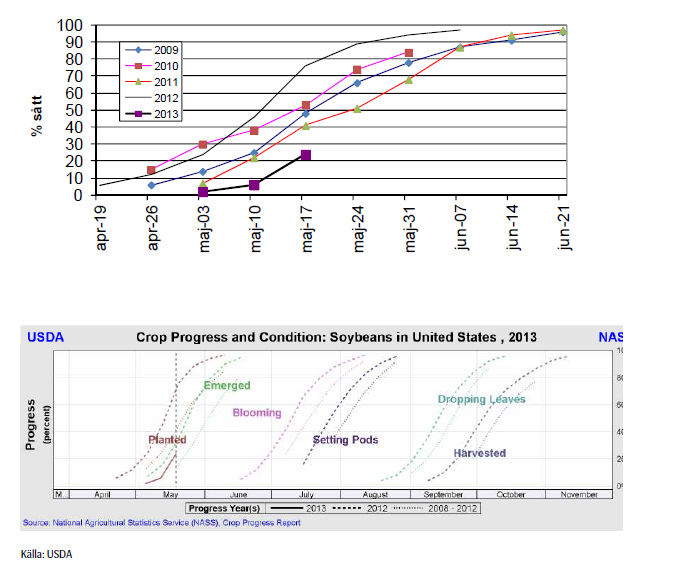
Som nämnt ovan visar måndagens Crop Progress att sådden av sojabönor, som vanligtvis sås senare än majs, fortskrider i sakta mak och nu är avklarad till 24%, vilket kan jämföras med 71% vid den här tiden förra året och det femåriga genomsnittet på 42%.
I Iowa, den största producenten, är sådden endast avklarad till 16% – vilket är långt efter det femåriga genomsnittet på 59% vid denna tid – samtidigt som sådden hos den näst största producenten, Illinois, nu är påbörjad och avklarad till 19%, ett rejält uppsving från veckan innan men fortfarande efter det femåriga genomsnittet på 35%.
I veckan som gick sänkte Argentinas jordbruksdepartement skördeprognosen från 51.3 mt till 50.6 mt. USDA:s senaste estimat ligger på 51 mt och som jämförelse kan nämnas att Rosario och Buenos Aires Grain Exchange båda ligger lägre på 48.5 mt. I Argentina är skörden av sojabönor nästan klar med 93% avrapporterat.
Slutsatsen är att vi behåller och upprepar vår säljrekommendation på sojabönor.
Raps
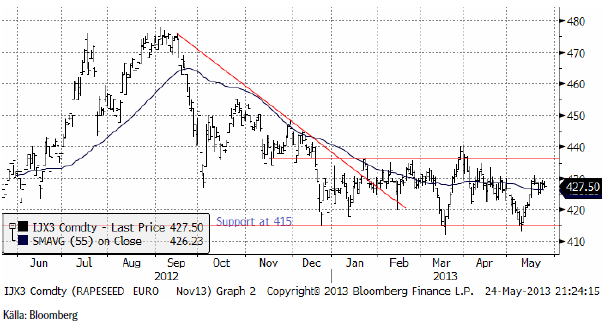
Rapspriset (November 2013) höll sig, som jag skrev förra veckan under 420 euro och rörde sig ”sidledes”. Frågan är om detta är en konsolidering inför en uppgång mot 430 euro eller om priset kommer att vända ner mot 415 euro igen? Det är svårt att säga, men den tekniska bilden indikerar att en nedgång är den mer sannolika rörelsen.
På grund av det kalla och våta vädret väntas Frankrikes skörd av rapsfrö bli den lägsta på 7 år, 1 mt lägre än förra året (4.5 mt istället för 5.5 mt). Även i Kanada sänktes produktionsestimat. Den här veckan av Ag Canada som förra månaden hade ett estimat på 15.5 mt och nu tror på 14.1 mt.
Skulle det tekniska stödet på 415 euro brytas, är detta en rejäl säljsignal. Jag tror att rapspriset kommer att falla. Dels för att sojabönorna bör ha en lång tid av fallande priser framför sig och dels för att rapsen är ovanligt dyr i förhållande till sojabönor.
Mjölk
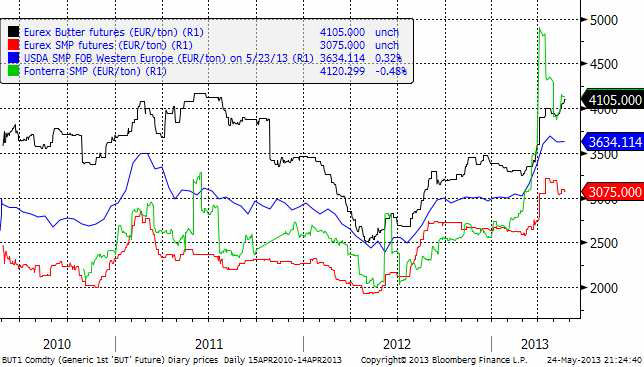
Nya Zeelands mjölkproduktion var 16.8% lägre i mars jämfört med mars förra året enligt industrigruppen Dcanz. Detta orsakades av den torka som drabbat landet. I och med de myckna regnen över Nordön på Nya Zeeland anses den dock vara över nu och därmed är haussen i mjölkpriset över på den internationella marknaden. Priset på Fonterras GlobalDariyTrade har fallit med ca 15% från toppnoteringen. Eurex, som följer den europeiska marknaden för smör och skummjölkspulver ligger dock fortfarande kvar på högre nivå.
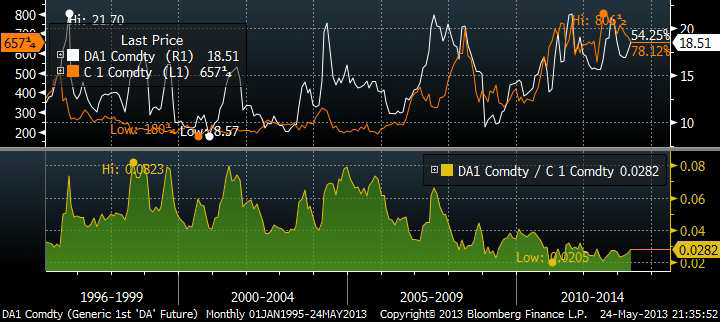
Nedan ser vi kvoten mellan mjölkpriset i USA och majspriset. När ”råvaruboomen” började i början på ”00” – talet försvann lönsamheten från mjölkbranschen. Tecknen hopar sig nu om att toppen på råvaruboomen är över. Det betyder att lönsamheten för mjölkproducenter är över – tillsammans med krisen för grisbönderna. Större trendförändringar inträffar ofta på ett omärkbart sätt, utan att folk inser att en förändring har skett.
Det var på samma sätt för tio år sedan när råvaruboomen började. De här mega-trendernas källa ligger i demografi och idéer, inte i QE eller annat finansiellt. För över 100 år sedan beskrev man skeendet i USA med en liknelse av Niagara-fallet. Det är skummet man ser, men det är det strömmande vattnet under som utgör kraften.
[box]SEB Veckobrev Jordbruksprodukter är producerat av SEB Merchant Banking och publiceras i samarbete och med tillstånd på Råvarumarknaden.se[/box]
Disclaimer
The information in this document has been compiled by SEB Merchant Banking, a division within Skandinaviska Enskilda Banken AB (publ) (“SEB”).
Opinions contained in this report represent the bank’s present opinion only and are subject to change without notice. All information contained in this report has been compiled in good faith from sources believed to be reliable. However, no representation or warranty, expressed or implied, is made with respect to the completeness or accuracy of its contents and the information is not to be relied upon as authoritative. Anyone considering taking actions based upon the content of this document is urged to base his or her investment decisions upon such investigations as he or she deems necessary. This document is being provided as information only, and no specific actions are being solicited as a result of it; to the extent permitted by law, no liability whatsoever is accepted for any direct or consequential loss arising from use of this document or its contents.
About SEB
SEB is a public company incorporated in Stockholm, Sweden, with limited liability. It is a participant at major Nordic and other European Regulated Markets and Multilateral Trading Facilities (as well as some non-European equivalent markets) for trading in financial instruments, such as markets operated by NASDAQ OMX, NYSE Euronext, London Stock Exchange, Deutsche Börse, Swiss Exchanges, Turquoise and Chi-X. SEB is authorized and regulated by Finansinspektionen in Sweden; it is authorized and subject to limited regulation by the Financial Services Authority for the conduct of designated investment business in the UK, and is subject to the provisions of relevant regulators in all other jurisdictions where SEB conducts operations. SEB Merchant Banking. All rights reserved.

Brent is climbing higher. Front-month is at USD 106.3/bl this morning, close to a weekly high and a USD 9/bl jump from Mondays open. This is the move we flagged as a risk earlier in the week: the market shifting from ”a deal is around the corner” to ”this is going to take longer than we thought”.

Analyst Commodities, SEB
During April, rest-of-year Brent remained remarkably stable around USD 90/bl. A stability which rested on one single assumption: the SoH reopens around 1 May. That assumption is now slowly falling apart.
As we highlighted yesterday: every week of delay beyond 1 May adds (theoretically) ish USD 5/bl to the rest-of-year average, as global inventories draw 100 million barrels per week. i.e., a mid-May reopening implies rest-of-year Brent closer to USD 100/bl, and anything pushing into June or July takes us meaningfully higher.
What’s changed in the last 48 hours:
#1: The US military has formally warned that clearing suspected sea mines from SoH could take up to six months. That is a completely different timescale from what the financial market is pricing. Even a political deal tomorrow does not immediately reopen the strait.
#2: Trump has shifted his tone from urgency to ”strategic patience”. In yesterday’s press conference: ”Don’t rush me… I want a great deal.” The market is reading this as a president no longer feeling pressured by timelines, with the naval blockade running in the background.
#3: So far, the military activity is escalating, not de-escalating. Axios reports Iran is laying more mines in SoH. The US 3rd carrier strike group (USS George H.W. Bush) is arriving with two countermine vessels. Trump yesterday ordered the US Navy to destroy any Iranian boats caught laying mines. While CNN reports that the Pentagon is actively drawing up plans to strike Iranian SoH capabilities and individual Iranian military leaders if the ceasefire collapses. i.e., NOT a attitude consistent with an imminent deal!
Spot crude and product prices eased off the early-April highs on a combination of system rerouting and deal optimism. Both now weakening. Goldman estimates April Gulf output is reduced by 14.5 mbl/d, or 57% of pre-war supply, a number that keeps getting worse the longer this drags on.
Demand-side adaptation is ongoing: S. Korea has cut its Middle East crude dependence from 69% to 56% by pulling more from the Americas and Africa, and Japan is kicking off a second round of SPR releases from 1 May. But SPRs are finite.
Ref. to the negotiations, we should not bet on speed. The current Iranian leadership is dominated by genuine hardliners willing to absorb economic pain and run the clock to extract concessions. That is not a setup for a rapid resolution. US/Israeli media briefings keep framing the delay as ”internal Iranian divisions”, the reality is more complicated and points toward weeks and months, not days.
Our point is that the complexity is large, and higher prices have only just started (given a scenario where the negotiations drag out in time). The market spent April leaning on the USD 90/bl rest-of-year assumption; that case is diminishing by the hour. If ”early May reopening” is replaced by ”June, July or later” over the next week or two, both crude and products have meaningful room to reprice higher from here. There is a high risk being short energy and betting on any immediate political resolution(!).
Down on Friday. Up on Monday. The Brent June crude oil contract traded down 5.1% last week to a close of $90.38/b. It reached a high of $103.87/b last Monday and a low of $86.09/b on Friday as Iran announced that the Strait of Hormuz was fully open for transit. That quickly changed over the weekend as the US upheld its blockade of Iranian oil exports while Iran naturally responded by closing the SoH again. The US blew a hole in the engine room of the Iranian ship TOUSKA and took custody of the ship on Sunday. Brent crude is up 5.6% this morning to $95.4/b.

The cease-fire is expiring tomorrow. The US has said it will send a delegation for a second round of negotiations in Islamabad in Pakistan. But Iran has for now rejected a second round of talks as it views US demands as unrealistic and excessive while the US is also blocking the Strait of Hormuz.
While Brent is up 5% this morning, the financial market is still very optimistic that progress will be made. That talks will continue and that the SoH will fully open by the start of May which is consistent with a rest-of-year average Brent crude oil price of around $90/b with the market now trading that balance at around $88/b.
Financial optimism vs. physical deterioration. We have a divergence where the financial market is trading negotiations, improvements and resolution while at the same time the physical market is deteriorating day by day. Physical oil flows remain constrained by disrupted flows, longer voyage times and elevated freight and insurance costs.
Financial markets are betting that a US/Iranian resolution will save us in time from violent shortages down the road. But every day that the SoH remains closed is bringing us closer to a potentially very painful point of shortages and much higher prices.
The US blockade is also a weapon of leverage against its European and Asian allies. When Iran closed the SoH it held the world economy as a hostage against the US. The US blockade of the SoH is of course blocking Iranian oil exports. But it is also an action of disruption directed towards Europe and Asia. The US has called for the rest of the world to engaged in the war with Iran: ”If you want oil from the Persian Gulf, then go and get it”. A risk is that the US plays brinkmanship with the global oil market directed towards its European and Asian allies and maybe even towards China to force them to engage and take part. Maybe unthinkable. But unthinkable has become the norm with Trump in the White House.
Wild moves yesterday. Brent crude traded to a high of $114.43/b and a low of $96.0/b and closed at $99.94/b yesterday.
US – Iran negotiations ongoing or not? What a day. Donald Trump announced that good talks were ongoing between Iran and the US and that the 48 hour deadline before bombing Iranian power plants and energy infrastructure was postponed by five days subject to success of ongoing meetings. Iranian media meanwhile stated that no meetings were ongoing at all.
Today we are scratching our heads trying to figure out what yesterday was all about.
Friends and family playing the market? Was it just Trump and his friends and family who were playing with oil and equity markets with $580m and $1.46bn in bets being placed by someone in oil and equity markets just 15 minutes before Trump’s announcement?
Was Trump pulling a TACO as he reached his political and economic pain point: Brent at $112/b, US Gas at $4/gal, SPX below 200dma and US 10yr above 4.4%?
Different Iranian factions with Trump talking with one of them? Are there real negotiations going on but with the US talking to one faction in Iran while another, the hardliners, are not involved and are denying any such negotiations going on?
Extending the ultimatum to attack and invade Kharg island next weekend? Or, is the five day delay of the deadline a tactical decision to allow US amphibious assault ships and marines to arrive in the Gulf in the upcoming weekend while US and Israeli continues to degrade Iranian military targets till then. And then next weekend a move by the US/Israel to attack and conquer for example the Kharg island?
We do not really know which it is or maybe a combination of these.
We did get some kind of TACO ydy. But markets have been waiting for some kind of TACO to happen and yesterday we got some kind of TACO. And Brent crude is now trading at $101.5/b as a result rather than at $112-114/b as it did no the high yesterday.
But what really matters in our view is the political situation on the ground in Iran. Will hardliners continue to hold power or will a more pragmatic faction gain power?
If the hardliners remain in power then oil pain should extend all the way to US midterm elections. The hardliners were apparently still in charge as of last week. Iran immediately retaliated and damaged LNG infrastructure in Qatar after Israel hit Iranian South Pars. The SoH was still closed and all messages coming out of Iran indicated defiance. Hardliners continues in power has a huge consequence for oil prices going forward. The regime has played its ’oil-weapon’ (closing or chocking the Strait of Hormuz). It is using it to achieve political goals. Deterrence: it needs to be so politically and economically expensive to attack Iran that it won’t happen again in the future. Or at least that the US/Israel thinks 10-times over before they attack again. The highest Brent crude oil closing price since the start of the war is $112.19/b last Friday. In comparison the 20-year inflation adjusted Brent price is $103/b. So Brent crude last Friday at $112.19/b isn’t a shockingly high price. And it is still far below the nominal high of $148/b from 2008 which is $220/b if inflation adjusted. So once in a lifetime Iran activates its most powerful weapon. The oil weapon. It needs to show the power of this weapon and it needs to reap political gains. Getting Brent to $112/b and intraday high of $119.5/b (9 March) isn’t a display of the power of that weapon. And it is not a deterrence against future attacks.
So if the hardliners remain in power in Iran, then the SoH will likely remain chocked all the way to US midterm elections and Brent crude will at a minimum go above the historical nominal high of $148/b from 2008.
Thus the outlook for the oil price for the rest of the year doesn’t depend all that much of whether Trump pulls a TACO or not. Stops bombing or not. It depends more on who is in charge in Iran. If it is the hardliners, then deterrence against future attacks via chocking of the SoH and high oil prices is the likely line of action. It is impacting the world but the Iranian ’oil-weapon’ is directed towards the US president and the the US midterm elections.
If a pragmatic faction gets to power in Iran, then a very prosperous future is possible. However, if power is shifting towards a more pragmatic faction in Iran then a completely different direction could evolve. Such a faction could possibly be open for cooperation with the US and the GCC and possibly put its issues versus Israel aside. Then the prosperity we have seen evolving in Dubai could be a possible future also for Iran.
So far it looks like the hardliners are fully in charge. As far as we can see, the hardliners are still fully in control in Iran. That points towards continued chocking of the SoH and oil prices ticking higher as global inventories (the oil market buffers) are drawn lower. And not just for a few more weeks, but possibly all the way to the US midterm elections.


Solkraften pressar elpriserna dagtid

Michel Gubel ger sin syn på oljemarknaden

Svag vårflod dubblar elpriserna
Brent crude up USD 9/bl on the week… ”deal around the corner” narrative fades
Market Still Betting on Timely Resolution, But Each Day Raises Shortage Risk

Det fysiska spotpriset på brentolja har slagit nytt rekord

Marknaden måste börja betrakta de höga kopparpriserna som det nya normala

Christian Kopfer om läget för oljan
Market Still Betting on Timely Resolution, But Each Day Raises Shortage Risk
Brent crude up USD 9/bl on the week… ”deal around the corner” narrative fades
-
 Nyheter4 veckor sedan
Det fysiska spotpriset på brentolja har slagit nytt rekord
-
 Nyheter4 veckor sedan
Marknaden måste börja betrakta de höga kopparpriserna som det nya normala
-
 Nyheter3 veckor sedan
Christian Kopfer om läget för oljan
-
Analys2 veckor sedan
Market Still Betting on Timely Resolution, But Each Day Raises Shortage Risk
-
Analys1 vecka sedan
Brent crude up USD 9/bl on the week… ”deal around the corner” narrative fades
-
 Nyheter5 dagar sedan
Michel Gubel ger sin syn på oljemarknaden
-
Nyheter5 dagar sedan
Svag vårflod dubblar elpriserna
-
 Nyheter3 dagar sedan
Solkraften pressar elpriserna dagtid