Följ oss

Analys

SEB Jordbruksprodukter, 16 december 2013

Publicerat

den

SEB Veckobrev med prognoser på jordbruksråvaror

SEB - Prognoser på råvaror - CommoditySEB-rekommendationer på råvarorÅrets sista WASDE-rapport publicerades i tisdags och bekräftade Australiens och Kanadas rapporter, men nonchalerade Argentinas, alla från veckan innan. För sojabönor hamnade USDA på oförändrade 88 mt för Brasilien. Samma dag publicerade CONAB en prognos på 90 mt. Kanadas rapport för två veckor sedan fick canolan i Winnipeg i fritt fall, vilket börjar sprida sig till Europa nu. Att Frankrike höjde rapsarealen istället för att som väntat sänka den, kommer att bidra till att baissen får grepp i Europa också.

Jag tror att vetemarknaden kommer att ha en lite svagare utveckling framöver och går därför över till en kortsiktig säljrekommendation (från neutral).

Mjölkpriserna basis Eurex SMP och smör-terminer steg med 1% i svenska kronor per kilo mjölkråvara och det berodde helt på att kronan försvagades mot euron. Mjölkbörserna var annars lite svagare i veckan än förut.

Nästa WASDE-rapport publiceras den 10 januari och det här veckobrevet är också det sista för året och önskar alla läsare en God Jul och ett Gott Nytt År 2013.

Odlingsväder

Det är både blötare och varmare i Europa än normalt och detta väntas bestå åtminstone fram till slutet av året. I Nordamerika drar i skrivande stund en snöstorm fram, som fått flygen att bli inställda t ex i Toronto.

I Sydamerika, kan vi notera att det är onormalt varmt och lite nederbörd i norra Argentina, landets kornbod. Vi ser detta i kartbilden nedan.

Väder Sydamerika

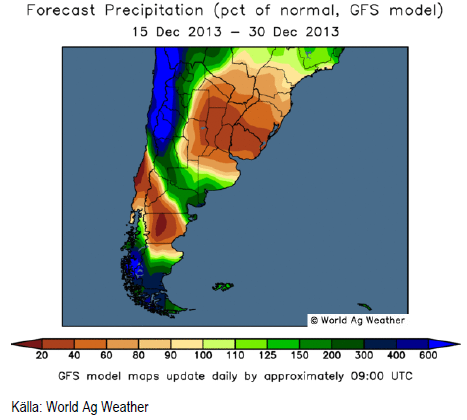
I Brasiilien är vädret alltjämt normalt.

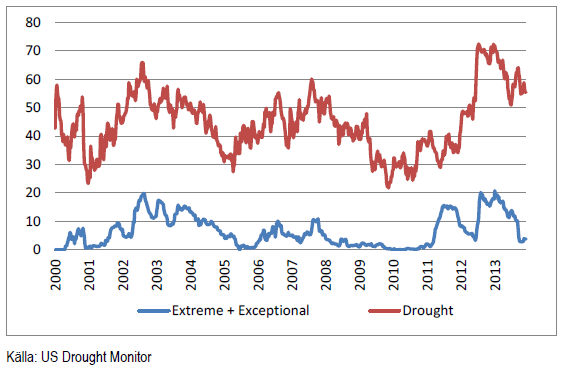
En hastig blick på US Drought Monitor, visar att det inte varit några stora förändringar i hur stor andel av USA:s areal som är torrare än normalt.

US Drought Monitor

Vete

Terminskontrakten i Chicago föll med 3% i veckan och Matif med 2%. WASDE-rapporten i sig själv påverkade inte marknaden, eftersom den inte innehöll något nytt, utan snarare bekräftade produktionshöjningarna i Kanada och Australien från veckan innan och som väntat nonchalerade Argentinas påstående att skörden skulle bli 8.5 mt istället för 11 mt som alla andra utom den Argentinska staten förväntat sig.

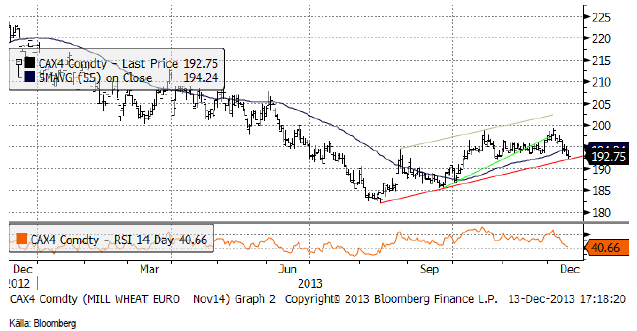
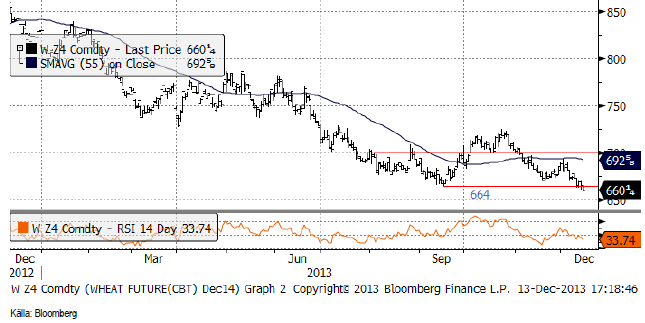
Tekniskt stängde Matif precis på stödet för uppgången från början av augusti. Eftersom Chicagovetet i fredags gick under stödet på 664 cent (basis Dec 2014-kontraktet), skulle det inte förvåna om Matif bröt stödet och inledde en rekyl nedåt. November 2014-kontraktet låg i fredags på 192.75 och om stödet bryts finns nästa stöd på 185 euro. Vi skulle tro att priset går dit. Eventuellt finns stöd på 190, där priset kan studsa som hastigast.

Vetetermin

Decemberkontraktet 2014 på CBOT som föll tillbaka ner mot det tekniska stödet, efter ABARES och Stats Canadas rapporter, bröt igenom stödet på 664 i fredags. Det är en teknisk säljsignal.

Vetetermin december 2014-kontraktet

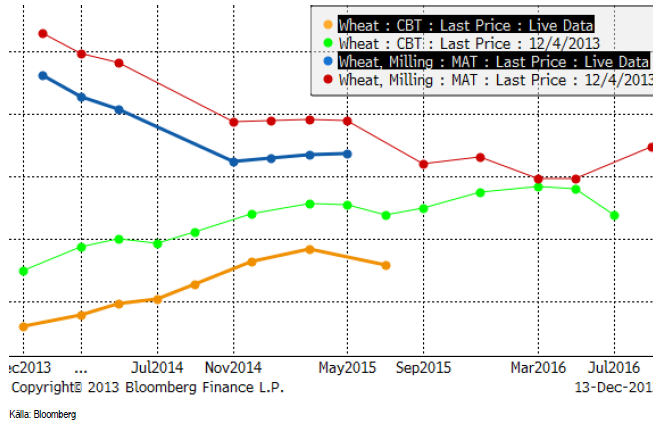
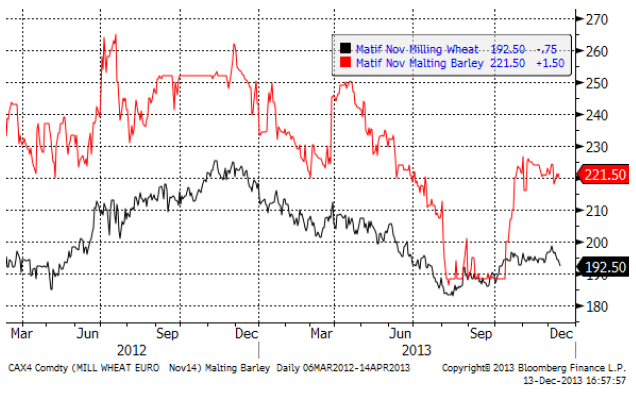
Nedan ser vi terminskurvorna för Chicagovete och Matif.

Terminskontrakten på vete

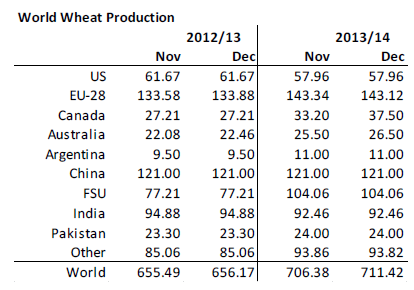
I tisdags kom så årets sista WASDE-rapport från USDA. USDA fick med och tog till sig de nya högre produktionsestimaten från veckan innan från Kanada (37.5 mt) och Australien (26.5), men gjorde inte det för Argentina, där USDA fortfarande har 11 mt. Det står ju helt klart att Argentinas produktionsestimat är lågt därför att det då begränsar exporten till 1.5 mt och inte 4 mt som det hade varit om de hade sagt 11 mt. Sammantaget justeras alltså global produktion 2013/14 upp med 5 mt till 711.42 mt.

World Wheat Production

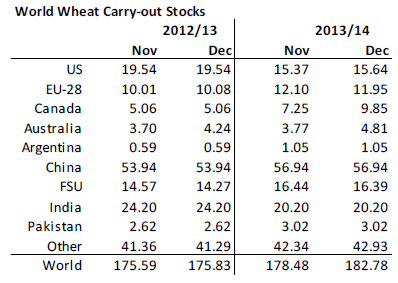
Höjningen av produktionsestimatet så plötsligt gör också att utgående lager justeras upp. Det finns ju ingen anledning att tro att konsumtionen ska öka om inte priset sjunker, eller tillväxten i tillväxtländer tar fart. Utgående lager justeras upp med 4 mt. Det kan synas märkligt att man inte höjde med 5 mt, eftersom inget har hänt som motiverar högre konsumtion.

World wheat carry out stocks

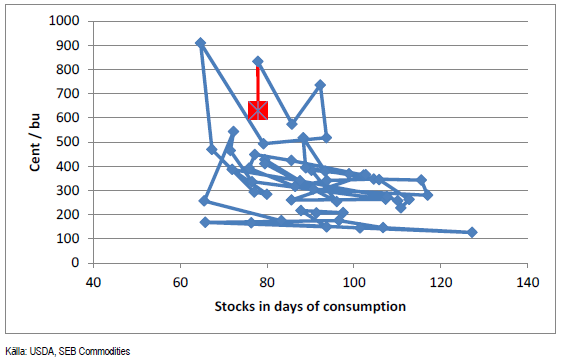
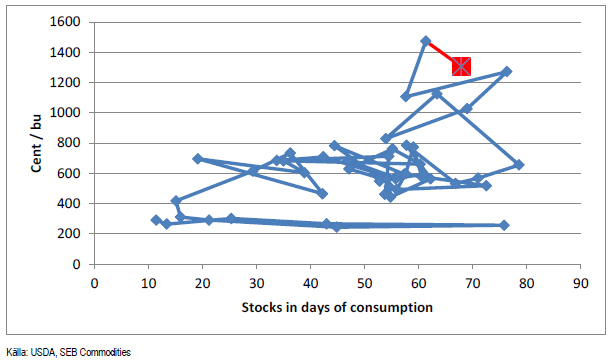
Ser vi till prisets relation till utgående lager, ligger priset möjligtvis något lågt om vi jämför med den allmänna bilden som förhållandet mellan pris och lager de senaste åren ger. Å andra sidan kan vi jämföra med punkten för fem år sedan, när priset var 100 cent lägre för nästan samma nivå på lagret. Det är alltså svårt att dra några entydiga slutsatser om priset just nu är för ”högt” eller för ”lågt”.

Wheat, stocks in days of consumption

Vi tror det kommer en period med lite svagare marknad nu, med en mindre nedgång i terminerna på vete. På ett lite längre perspektiv är vi mer eller mindre neutrala, men på kort sikt går vi över från neutral till säljrekommendation.

Optioner på vete

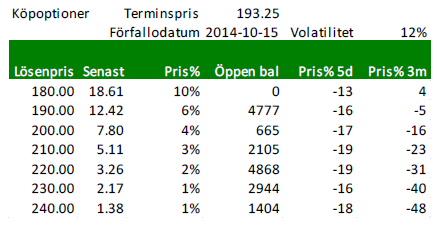
Nedan ser vi priserna på köpoptioner på Matif på November-2014 (Matif vete). Notera att historisk volatilitet har stigit upp från 11% till 12% igen.

Optioner på vete

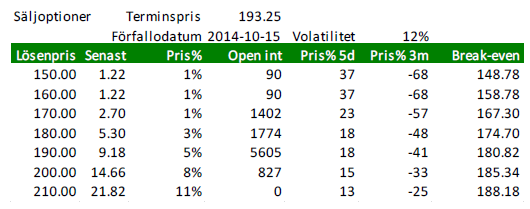
Nedanstående är priser på säljoptioner.

Säljoptioner på vete

Maltkorn

November 2014 – kontraktet på har den senaste tiden gått lite svagare än Matif-vetet.

Maltkornspriser

Majs

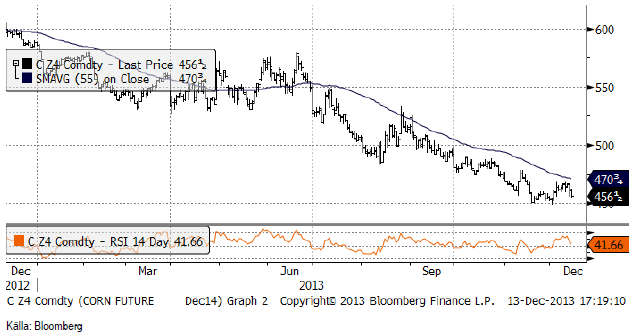
Majspriset reagerade på WASDE-rapporten, till skillnad från vetet. Trots att utgående lager justerades ner, oroar sig marknaden för att januari-rapporten ska visa högre produktion både i USA och i Kina. Kinas eget estimat, som kom härom veckan, ligger 6.5 mt högre än USDA. Tekniskt ser marknaden illavarslande ut, då priset ser ut att återigen vara på väg ner till den psykologiskt viktiga nivån 450 cent. Ska det bli tredje gången gillt och ett fall under den nivån?

Prisutveckling och analys av majs

USDA justerade upp global produktion med 1.5 mt. En liten sänkning gjordes av estimatet för EU-28, skörden i fd Sovjet (Ukraina) höjdes ytterligare, med 1 mt. Men det saknas alltså +6.5 mt på Kina. Att Kina inte verkar importera majs från USA i samma utsträckning som tidigare, indikerar att Kina verkligen har fått en bättre skörd än väntat. Marknaden ser det så i alla fall, och ”justerar” USDA:s estimat så att den global produktion nu är 8 mt högre än estimerat i november.

Världens majsproduktion

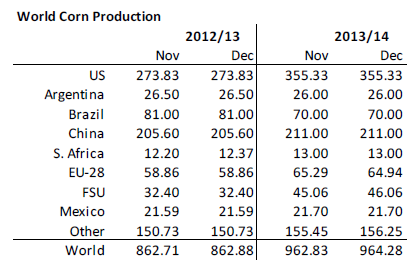
USDA sänker utgående lager med 2 mt, därför att man räknar med högre foderefterfrågan i EU-28, Kanada, Ukraina och högre efterfrågan på majs till etanoltillverkning i USA. Detta verkar rimligt med tanke på boomen i kött och mjölkpriser. Det är nog en trend vi kommer att se mer höjningar i konsumtionen för. Men vi tror inte att höjningen av efterfrågan på majs till etanolindustrin är långsiktigt hållbar. Kina har dessutom satt en båtlast med DDG (drank) från USA i karantän därför att man misstänker att den innehåller GMO-vara av en sort som är förbjuden i Kina. Skulle DDG-exporten till Kina stanna av, skulle ekonomin i etanoltillverkningen försämras, allt annat lika.

Majslager

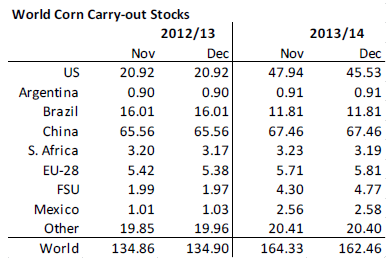
”Egentligen” skulle den här rapporten, med Kinas egna produktionsestimat, ha visat högre utgående lager.

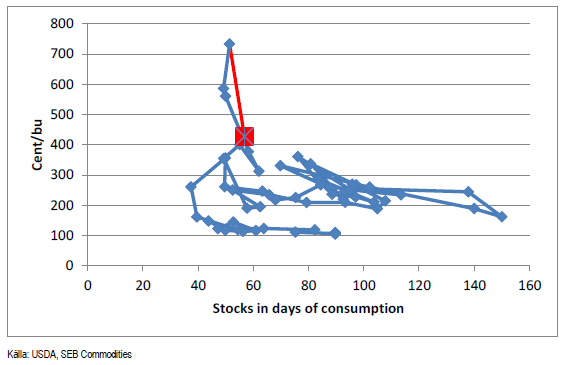
Priset ser ut att ligga ”OK” i förhållande till estimerat utgående lager och i förhållande till de senaste årens relation mellan pris och lager.

Lager av majs i dagar av konsumtion

Vi fortsätter med neutral rekommendation, men skulle 450 cent brytas, bör man vara nettosåld majs, pga vad den tekniska analysen då säger.
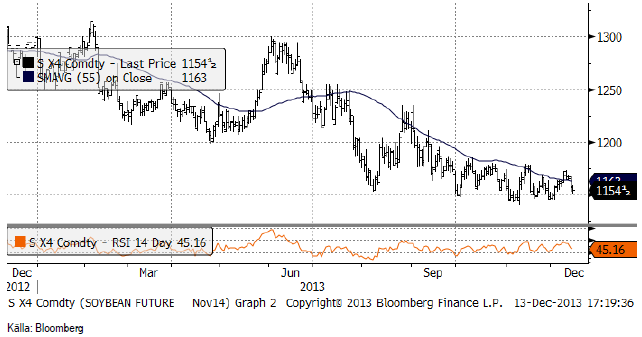
Sojabönor

Även sojabönorna föll efter WASDE-rapporten. 1150 cent är dock ett starkt stöd för marknaden. 55% av Brasiliens sojaskörd är enligt uppgifter därifrån redan såld / prissäkrad.

Sojabönor

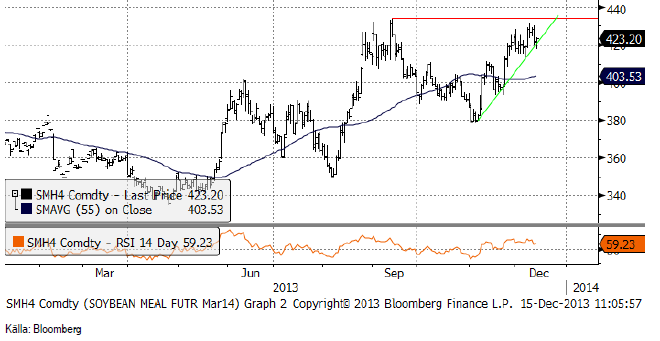
Gammal skörd av sojamjöl (mars-kontraktet 2014) lyckades inte ta sig upp till en ny all-time-high i veckan. Priset ligger precis på stödlinjen för uppgången. Det skulle inte förvåna om säljare kommer in här, samtidigt som köpare tar hem vinster och vi får ett brott av stödlijen, med prisfall ner till 400 dollar som följd.

Sojabönor

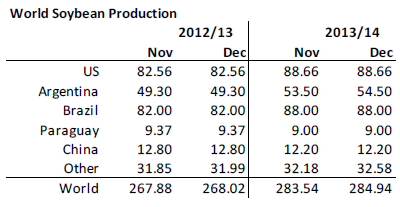
WASDE-rapporten visade 1.5 mt högre produktion. Argentina höjdes 1 mt och övriga länder med 0.5. Värt att notera är att produktionen antagligen är högre än vad USDA har estimerat här i december-rapporten. Dels är estimatet för Argentina på 54.5 mt fortfarande 3 mt lägre än vad USDA:s egen attaché vid FAS rapporterade härom veckan. Dels är estimatet för Brasilien oförändrat på 88 mt, när CONAB och många privata firmor på plats ligger på 90 mt. Kanske avvaktar USDA hur vädret utvecklar sig i Argentina och Brasilien. I Argentina har det blivit lite varmare, men i Brasilien är vädret muito bom.

Soybean-produktion

Med en produktionsökning på 1.5 mt höjer USDA utgående lager med 0.5 mt – allt i Argentina – vilket förmodligen är helt riktigt. Utgående lager sänktes för USA, vilket också verkar rimligt med tanke på prisutvecklingen för griskött och mjölk, t ex. Efterfrågan på sojamjöl kommer antagligen att fortsatt vara stark.

Soybean-lager

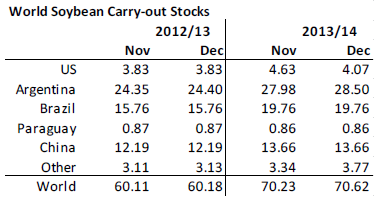
För fyra år sedan var lagernivån på ungefär samma nivå som nu och priset var 150 cent lägre. Det talar för en svag prisutveckling framöver. Det är dock värt att hålla koll på vart priserna på mjölk och lean hogs tar vägen framöver. Skulle de fortsätta att stärkas och därmed stimulera till större besättningar, kan efterfrågan på sojamjöl vara en faktor som dämpar eller hindrar prisfall på sojan.

Soybean-lager i dagar av konsumtion

Kina har satt en båtlast med DDG i karantän för undersökning av GMO-innehåll. Risken är att DDG som gått till Kina kommer att stanna i USA – och därmed pressa priset på sojamjöl.

Vi behåller säljrekommendation.

Raps

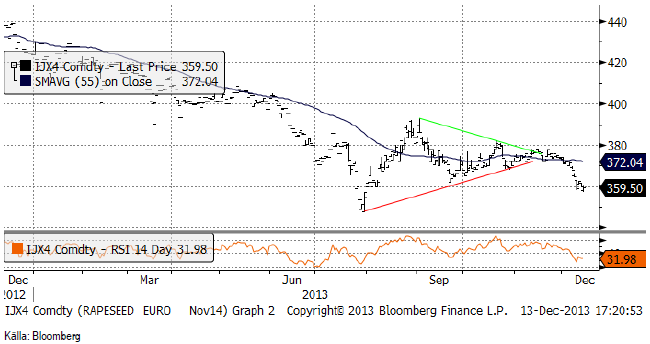
November 2014-kontraktet som jag säljrekommenderade förra veckan föll ner till 360 euro. Priset bröt även den nivån mot slutet av veckan och nästa nivå i sikte är nu 350 euro. Vi fortsätter med säljrekommendation.

IJX4

Frankrike höjde rapsarealen med 7% jämfört med förra året. Den allmänna uppfattningen under hösten var att den skulle bli mindre, pga den försämrade lönsamheten i valet av raps framför t ex vete.

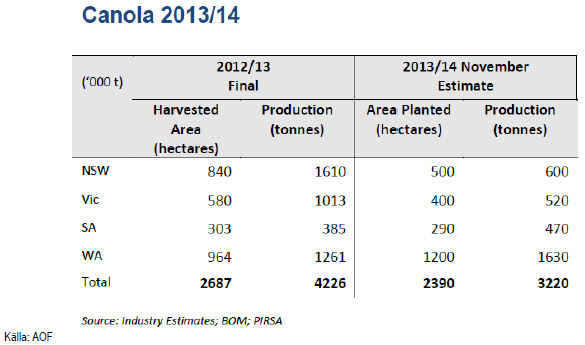
AOF (Australian Oilseeds Federation) gör endast en mindre nedjustering från tidigare estimat för landets produktion av canola 2013/14, detta trots en betydande negativ påverkan på grödorna till följd av frost i New South Wales och Victoria. Produktionen beräknas uppgå till 3.2 mt i år, ner från tidigare estimat på 3.4 mt och förra årets produktion på 4.2 mt. En varm start på våren påskyndade grödornas utveckling och gjorde dem mer känsliga för extrema väderslag, vilket gjorde att torra väderförhållanden och frost under våren fick en betydande inverkan på grödorna i NSW och Victoria. Bortfallet av grödor i östkust staterna har dock nästan helt kompenserats av avkastningen i Western Australia där de säsongsmässiga förhållandena har varit näst intill perfekta under de senaste månaderna.

Canola 2013-2014

Produktionen av raps i EU-28 förväntas uppgå till 21.3 mt 2014/15 enligt Strategie Grains, en ökning med 500 000 ton eller 2.4% från årets 20.8 mt då högre avkastning förväntas kompensera en liten nedgång i sådd. Den genomsnittliga avkastningen för nästa års skörd beräknas uppgå till 3.2 t/ha mot årets 3.1 t/ha, vilket skulle kompensera för en minskad areal (från 6.7 mha till 6.6 mha).

Efter nyheten om rekordskörden av canola i Kanada, har rapspriset förlorat mark i förhållande till soja. I diagrammet nedan ser vi att detta är en fortsättning på en trend, som inleddes redan 2006, när raps var som dyrast i förhållande till soja. I diagrammet nedan har jag räknat om sojapriset till euro (per bushel).

IJ1

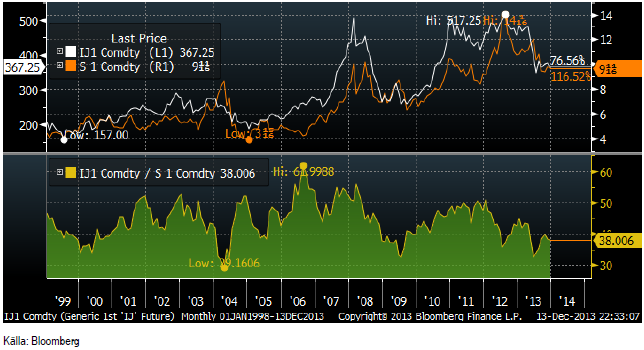
Canolaterminerna i Kanada har förlorat ännu mer mark i förhållande till sojabönorna i Chicago i veckan som gått. Rapspriset på Matif har inte riktigt tagit in det prisfallet.

Vi fortsätter med förra veckans säljrekommendation.
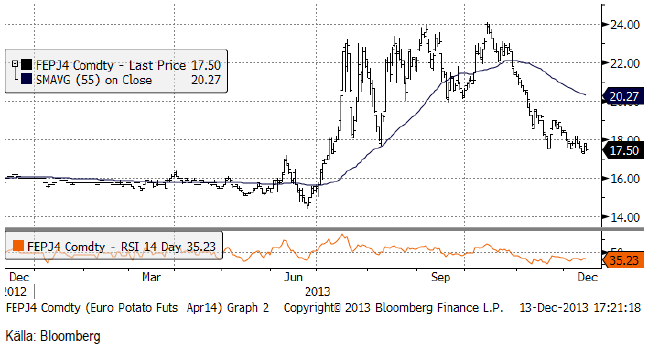
Potatis

Potatispriset av årets skörd, har fortsatt att handlas svagt och noterades i fredags en halv euro lägre per deciton, på 17.50 euro.
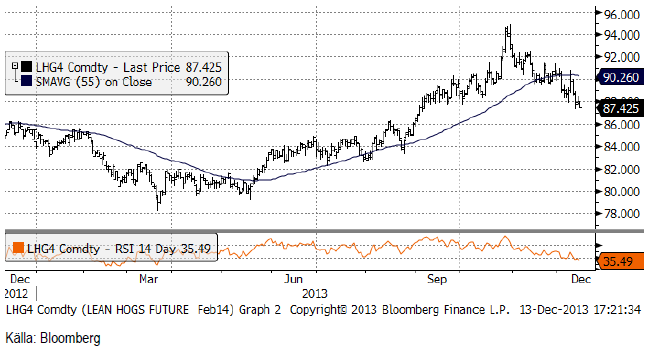
Potatispriset

Gris

Lean hogs mars-kontrakt fortsatte att gå ner i pris i veckan som gick och stängde 1.5 cent lägre än förra veckan. Lägre pris på lean hogs är en faktor som påverkar soja- och majspriserna negativt.
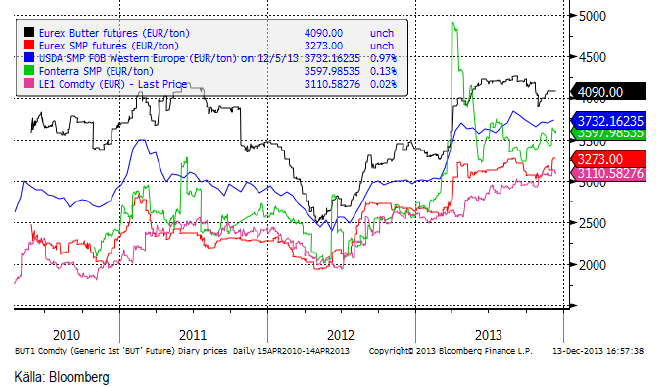
Grispris LHG4

Mjölk

SMP-terminerna på Eurex var oförändrade i veckan. SMP handlades lite starkare i början på veckan, men var sedan oförändrade. Smörpriset var oförändrat. I svenska kronor steg priset med 1% för alla terminsköptider, eftersom euron steg mot kronor.

Terminspriserna i Chicago sjönk faktiskt. Prisuppgången som varit mycket stadig i ett och ett halvt år, tycks hålla på att tappa lite av sitt momentum och det märks tydligast i prisutvecklingen på smör.

I diagrammet nedan har jag lagt till priset på CME:s SMP-kontrakt, omräknat till euro per ton och därmed i samma enhet som de andra prisserierna. Det är den lila kurvan. Vi ser att den faktiskt och inte så förvånande, följer Eurex SMP-termin.

Eurex butter-priset

Nedan ser vi terminspriserna man får i svenska kronor från terminspriserna på SMP och smör på Eurex, omräknat till kronor per kilo mjölkråvara. Notera dock att hela den här prisnivån alltid ska ligga över avräkningspriset på mjölkråvara med ca 50 öre, som är en uppskattning av kostnaden för att förädla mjölkråvara till SMP och smör.

Socker

Marskontraktet på råsocker har till vår stora besvikelse fortsatt att falla till kontraktslägsta på 16.29 cent per pund i marskontraktet. RSI ligger på en ny lägsta nivå om 16.75. En nivå under 30 brukar anses indikera en ”översåld” marknad och en nära förestående rekyl. En så här lång period av rekylfri nedgång är mycket ovanlig och kan bara förklaras av att många måste ha trott på en rekyl uppåt tidigare, liksom vi, och successivt tagit stoppar. Det är svårt att resonera här, för trots att priset faller, så byggs potentialen i rekylen uppåt upp allt mer, ju mer priset faller. Å andra sidan föll priset under det tekniska stödet på 16.60, vilket indikerar ytterligare svaghet i marknaden.

Sockerpriset SBH4

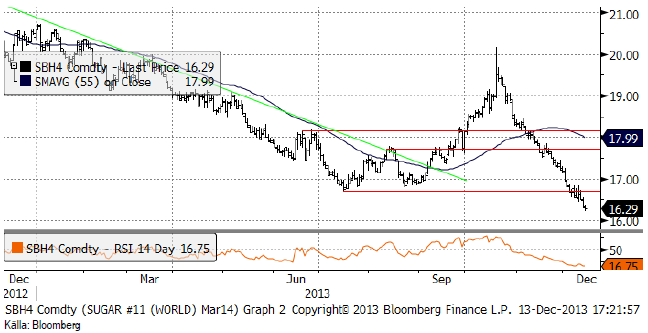
Om vi ser till ”spotkontraktet”, ser vi att prisfallet börjar nå ner till 16 cent, som var bottennoteringen i juli. Det är en nivå där det bör finnas stöd.

Sockerpriset

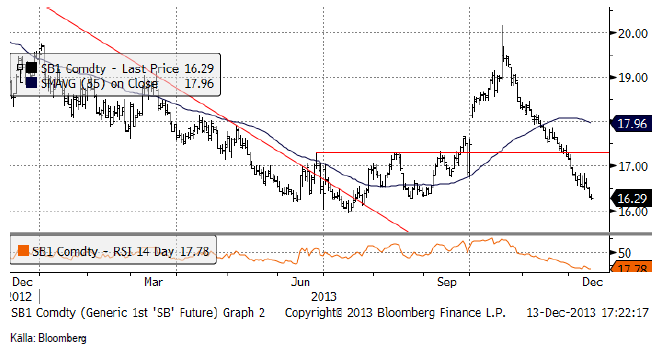
Marknaden har fortsatt handla starkt vid starten på handelsdagen, dvs under europeisk dagtid, för att sedan falla under amerikansk handelstid. Skörden i Brasilien har förbättrats mot slutet och det är antagligen producenter som prissäkrar, särskilt då priset i reais inte fallit som det gjort i dollar. Den Thailändska skörden börjar nu och det kan också vara en orsak till den påtagliga svagheten i prisutvecklingen just nu. Importmarginalen till Kina är negativ. Kina är en av världens största importörer.

Vi tror att botten noterades i juli och att den i och för sig mycket kraftiga nedgången är en rekyl.

Produktionsöverskottet går mot sitt slut och därmed finns en potential för priset att nå upp till produktionskostnaden. Vi rekommenderar köp av SOCKER S eller BULL SOCKER X4 S för den som vill ta mer risk.

Gödsel

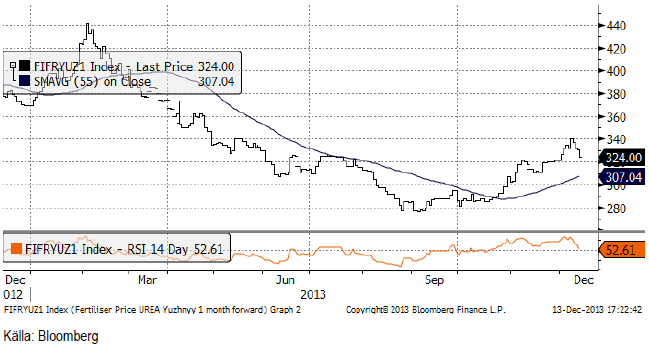
Förra veckan skrev vi att marknaden för urea var överköpt med ett RSI på 80 (över 70, som är gränsen för en ”överköpt” marknad. Priset har nu fallit tillbaka från 340 dollar till 324 dollar. Trenden är dock uppåtriktad, alltjämt och vi ser detta som ett köptillfälle.

Gödselpriset

[box]SEB Veckobrev Jordbruksprodukter är producerat av SEB Commodities Sales desk och publiceras i samarbete och med tillstånd på Råvarumarknaden.se[/box]

Detta marknadsföringsmaterial, framtaget av SEB’s Commodities Sales desk, har upprättats enbart i informationssyfte.

Även om innehållet är baserat på källor som SEB bedömt som tillförlitliga ansvarar SEB inte för fel eller brister i informationen. Den utgör inte oberoende, objektiv investeringsanalys och skyddas därför inte av de bestämmelser som SEB har infört för att förebygga potentiella intressekonflikter. Yttranden från SEB’s Commodities Sales desk kan vara oförenliga med tidigare publicerat material från SEB, då den senare hänvisas uppmanas du att läsa den fullständiga rapporten innan någon åtgärd vidtas.

Dokumentationen utgör inte någon investeringsrådgivning och tillhandahålls till dig utan hänsyn till dina investeringsmål. Du uppmanas att självständigt bedöma och komplettera uppgifterna i denna dokumentation och att basera dina investeringsbeslut på material som bedöms erforderligt. Alla framåtblickande uttalanden, åsikter och förväntningar är föremål för risker, osäkerheter och andra faktorer och kan orsaka att det faktiska resultatet avviker väsentligt från det förväntade. Historisk avkastning är ingen garanti för framtida resultat. Detta dokument utgör inte ett erbjudande att teckna några värdepapper eller andra finansiella instrument. SEB svarar inte för förlust eller skada – direkt eller indirekt, eller av vad slag det vara må – som kan uppkomma till följd av användandet av detta material eller dess innehåll.

Observera att det kan förekomma att SEB, dess ledamöter, dess anställda eller dess moder- och/eller dotterbolag vid olika tillfällen innehar, har innehaft eller kommer att inneha aktier, positioner, rådgivningsuppdrag i samband med corporate finance-transaktioner, investment- eller merchantbankinguppdrag och/eller lån i de bolag/finansiella instrument som nämns i materialet.

Materialet är avsett för mottagaren, all spridning, distribuering mångfaldigande eller annan användning av detta meddelande får inte ske utan SEB:s medgivande. Oaktat detta får SEB tillåta omfördelning av materialet till utvald tredje part i enlighet med gällande avtal. Materialet får inte spridas till fysiska eller juridiska personer som är medborgare eller har hemvist i ett land där sådan spridning är otillåten enligt tillämplig lag eller annan bestämmelse.

Skandinaviska Enskilda Banken AB (publ) är ett [publikt] aktiebolag och står under tillsyn av Finansinspektionen samt de lokala finansiella tillsynsmyndigheter i varje jurisdiktionen där SEB har filial eller dotterbolag.

Fortsätt läsa
Annons
Klicka för att kommentera

Skriv ett svar

Din e-postadress kommer inte publiceras. Obligatoriska fält är märkta *

Analys

US inventories will likely rise less than normal in mths ahead and that is bullish

Publicerat

den

SEB - analysbrev på råvaror

US commercial crude and product stocks will now most likely start to rise on a weekly basis and not really start to decline again before in week 38. We do however expect US inventories to rise less than normal in reflection of a global oil market in a slight deficit. This will likely hand support to the Brent crude oil price going forward.

Bjarne Schieldrop, Chief analyst commodities at SEB
Bjarne Schieldrop, Chief analyst commodities, SEB

Shedding some value along with bearish metals and China/HK equity losses. Brent crude has trailed lower since it jumped to an intraday high of USD 87.7/b on 19. March spurred by Ukrainian drone attacks on Russian refineries. Ydy if fell back 0.6% and today it is pulling back another 1% to USD 85.4/b. But the decline today is accompanied by declines in industrial metals together with a 1.3% decline in Chinese and Hong Kong equities. Thus more broad based forces are helping to pull the oil price lower.

US API indicated a 5.4 m b rise in US oil stocks last week. But rising stocks are normal now onwards. The US API ydy indicated that US crude stocks rose 9.3 m b last week while gasoline stocks declined 4.4 m b while distillates rose 0.5 m b. I.e. a total rise in crude and products of 5.4 m b (actual EIA data today at 15:30 CET). That may have helped to push Brent crude lower this morning. It is however very important to be aware that US inventories seasonally tend to rise from week 12 to week 38. And from week 12 to 24 the average weekly rise is 4.1 m b per week. The increase indicated by the US API ydy is thus not at all way out of line with what is normally taking place in the months to come. What really matters is how US commercial inventories do versus what is normal at the time of year.

US commercial stocks have fallen 17 m b more than normal since end of 2023. So far this year we have seen a draw of  39 m b vs the last week of 2023. The normal draw over this period is only -22 m b. I.e. US commercial inventories have drawn down 17 m b more than normal over this period. This has been the gradual, bullish nudge on oil prices. US commercial stocks should normally rise 63.5 m b from week 12 to week 38. What matters to oil prices is thus whether US inventories rise more or less than that over this period.

Drone attacks on Russian refineries was a catalyst to release Brent to higher levels. Brent crude broke out to the upside on 13 March along with the Ukrainian drone attacks on Russian refineries. Some 800 k b/d of refining capacity was hurt and probably went off line. But in the global scheme of things this is a mere 1% or so of total global refining capacity. And if we assume that it is off line for say 3 months, then it equates to maybe 0.25% impact on global refining activity in 2024 which is easy to adapt to. Refining margins have not moved  much at all. ARA spot diesel cracks are now USD 2.25/b lower than it was in 12 March 2024. Thus no crisis for refined products at all.

We’ll probably not return to pre-drone attack price level of USD 82/b any time soon. Though a dip to that price level is of course not at all out of the question. The oil market may send the oil price lower in the short term since very little material impact in the global scope of things seems to follow from the drone attacks on Russian refineries. Our view is however that the attacks were more like a catalyst to release the oil price to the upside following a steady and stronger than normal decline in US commercial inventories. I.e. the latest price gains in our view is not so much about an added risk premium in the oil price but more about oil price finally adjusting higher according to the fundamentals which have played out since the start of the year with stronger than normal declines in US commercial inventories. We thus see no immediate return to pre-drone-attack price level of USD 82/b. Rather we expect to see continued support to the upside through steady, gradual inventory erosion versus normal like we have seen so far this year.

Voluntary cuts by Russia in Q2-24 could be bullish if delivered as promised. Earlier in March we saw Russia’n willingness to cut back supply in Q2-24 in a mix of production restraints and export restraints. Saudi Arabia and Russia are equal partners in OPEC+ with equal magnitudes of production. In a reflection of this they set equal baselines in May 2020 of 11.0 m b/d. Saudi Arabia produced 9.0 m b/d in February while Russia produced 9.4 m b/d. This is probably why Russia in early March stated that they were willing to cut back in Q2-24. To align more with what Saudi Arabia is producing. It has been of huge importance that Saudi Arabia last year cut its production down to 9.0 m b/d and thus below Russian production. This reactivated Russia as a dynamic, proactive participant in OPEC+. The actual effect of proclaimed production/export cuts by Russia in Q2-24 remains to be seen, but calls for USD 100/b as a consequence of such cuts have surfaced.

So far we haven’t lost a single drop of oil due to Houthie attacks in the Red Sea. We have lost some up-time in Russia refining due to Ukrainian drone strikes lately. But nothing more than can be compensated elsewhere in the world. Temporarily reduced volumes of refined hydrocarbons from Russian will instead lead to higher exports of unrefined molecules (crude oil).

For now OPEC+ is comfortably controlling the oil market and the market will likely be running a slight deficit as a result with inventories getting a continued gradual widening, negative difference versus normal levels thus nudging the oil price yet higher. SEB’s forecast for Brent crude average 2024 is USD 85/b. This means that we’ll likely see both USD 90/b and maybe also USD 100/b some times during the year. But do make sure to evaluate changes in US oil inventories versus what is normal at the time of year. Rising inventories are bullish if they rise less than what is normal from now to week 38.

US commercial crude and product stocks will likely rise going forward. But since the global oil market is likely going to be in slight deficit we’ll likely see slower than normal rise in US inventories with an increasing negative difference to normal inventory levels.

US commercial crude and product stocks
Source: SEB calculations and graph, Blbrg data feed, EIA data

Total US crude and product stocks incl. SPR are now 4 m b below the low-point from December 2022

Total US crude and product stocks incl. SPR
Source: SEB graph and calculations, Blbrg data feed, EIA data
Fortsätt läsa

Analys

From surge to slump for natural gas: Navigating the new normal in Europe

Publicerat

den

SEB - analysbrev på råvaror

Over the past 4-5 months, EU natural gas prices, indicated by the TTF benchmark, have plummeted by 50% from an October high of EUR 56/MWh to the current EUR 28/MWh for the front-month contract, defying expectations of seasonal price increases. This downturn can be attributed to robust EU inventories at 59% capacity and persistently subdued natural gas demand, down by 11% compared to historical norms. Mild weather in Northwest Europe and a prolonged industrial recession have suppressed consumption, resulting in a significant gas surplus despite nearing the end of the winter heating season (90% complete). These factors collectively exert downward pressure on prices.

Ole R. Hvalbye, Analyst Commodities, SEB

The correlation between Brent and TTF prices remains from times partly “fluid”. In our December 2023 natural gas price update, we predicted a constrained global natural gas market, anticipating a swift resurgence in demand following a decline in gas prices. Our projections were underpinned by a robust Brent Crude price outlook, set at USD 85/bl, USD 87.5/bl, and USD 90/bl for 2024, 2025, and 2026 respectively, with a Crude-to-gas rate of 80%. However, this scenario has yet to materialize as the anticipated demand recovery has been notably delayed, requiring even lower prices than initially predicted for its realization—a phenomenon unique in recent memory.

Achieving a global natural gas price convergence towards levels more aligned with Brent Crude appears plausible, signaling a return to a measure of normalcy. The absence of a winter premium during the 2023/24 winter season suggests a healthier outlook for Q2-24, mitigating the risk of substantial short-term price spikes in European gas markets. The sporadic spikes witnessed in 2022 and partially in 2023 are now a thing of the past, indicating a change from the volatility experienced in recent years.

Short-term EU gas prices hinge heavily on immediate weather patterns and industrial gas demand, both exerting considerable influence on inventory levels, which serve as a critical gauge of supply and demand dynamics. Looking further ahead, the trajectory of prices is linked with the global LNG balance, particularly contingent upon factors such as projected US natural gas production and the capacity of US LNG exports to the global market.

Moreover, the declining influence of Russia on the European gas market is notable, with sporadic gas export halts from the former energy powerhouse carrying reduced impact. Global market recalibrations indicate a sustained elevation in price levels, with EUR 30/MWh emerging as a feasible benchmark for the foreseeable future. We also call “the end of the energy crisis”, as the worst is history. Reflecting on the current year, EU TTF prices hit the lowest point in late February, with expectations of a potential slide/climb from current prices at EUR 28/MWh.

In essence, our current natural gas price forecast hinges on a delicate equilibrium among three pivotal factors. Firstly, the TTF price must strike a balance, remaining sufficiently low to stimulate a resurgence in demand. For context, the historical average real price hovers around EUR 27/MWh, with EUR 30/MWh anticipated to gradually encourage demand recovery, thereby mitigating the effects of demand destruction. Secondly, the TTF price should maintain a relatively ”normal” relationship with Crude prices, as historical trends indicate a natural correlation between the two. A notably low rate would invariably attract heightened interest from Asian markets, as LNG emerges as a cost-effective alternative to oil in terms of energy content. Lastly, the TTF price must also exhibit a level of elevation to cover the expenses associated with producing and transporting US natural gas to the European market. This entails factoring in costs related to Henry Hub, tolling fees, liquefaction, transportation, and regasification, among other associated expenses. Achieving a delicate equilibrium among these factors is vital for ensuring the stability and sustainability of natural gas pricing dynamics in the European market.

Consequently, our current stance reflects a delicate balancing act among these three critical factors. Settling on EUR 30/MWh, we predict that prices lower than this threshold would catalyze a swifter demand resurgence, while simultaneously enhancing the appeal of natural gas against oil as the spread widens. Moreover, importation from the USA would encounter mounting challenges as prices decline, particularly approaching the EUR 25/MWh mark when landed in ARA.

The TTF market has been complexly interlinked with the global LNG market at the margins since 2015, many years before the energy crisis. While the proportion of LNG consumed in Europe has surged significantly, the concept of LNG prices influencing TTF prices at the margin is not new. However, in terms of volume, the current situation declares us notably more vulnerable than in previous years.

In our updated projections, we have revised our price forecasts downward, particularly notable at the front end, encompassing Q2-24, Q3-24, and the Full-year (FY) 2024. Other adjustments, though marginally smaller, remain for FY 2025, 2026, and 2027. Despite these reductions, we anticipate a trajectory of increasing European natural gas prices from their current levels. Notably, Q1-24 is now expected to average EUR 27/MWh, followed by predictions of EUR 25/MWh, EUR 28/MWh, and EUR 32/MWh for Q2-24, Q3-24, and Q4-24 respectively. Consequently, the average for FY 2024 is forecasted at EUR 28/MWh, marking a notable decline from the previous estimate of EUR 40/MWh.

In our outlook for longer-term pricing, we anticipate an average of EUR 30/MWh for the years 2025, 2026, and 2027—a reduction of EUR 10/MWh compared to our previous update in December 2023, which projected EUR 40/MWh. This long-term forecast only sits marginally higher, by EUR 3-4/MWh, than the historical average real price of approximately EUR 27/MWh. Such pricing aligns intending to stimulate further demand recovery and maintain consumer affordability within the European economy. Reflecting on historical trends, previous price levels in the European market might be seen as reliant on potentially risky agreements with Russia. Consequently, the era of exceptionally low-cost energy is drawing to a close, indicating a new paradigm where European gas and power are priced slightly higher, establishing a ”new normal” for the foreseeable future.

TTF spot prices

PRICE ACTION

The absence of a winter premium for global natural gas is notable. Our longer-term natural gas price projection, set at EUR 30/MWh, demonstrates resilience compared to historical market norms. Last quarter (Q4-23) closed at EUR 43/MWh for the front-month contract, a figure approximately EUR 10/MWh lower than our recent expectations. Noteworthy market adjustments have transpired not only within the European gas market but also on a global scale. This ongoing adaptation is expected to continue influencing the gas market into 2024, resulting in fewer severe price spikes and a return to more normal price differentials.

Global natural gas prices, EUR/MWh

Maintaining our gas price forecast at EUR 30/MWh for 2025 suggests an expectation for European natural gas prices to stabilize at current market rates. This projection extends to 2026 and 2027, which stand roughly 30% higher than historical norms – a contrast to the previous era of favorable deals with Russia flooding European consumers with low-cost piped natural gas.

Considerable attention is drawn to the relationship between gas and oil prices. With our oil market outlook projecting USD 85/bl, USD 87.5/bl, and USD 90/bl for 2024, 2025, and 2026 respectively, the convergence of gas prices to more normal circumstances implies a corresponding alignment with oil prices. Historically, EU natural gas prices have traded at 0.55-0.6 times Brent crude prices, a figure that is expected to converge closer to historical norms. However, our forecasts for 2024, 2025, and 2026 slightly exceed historical norms, at 0.62 x Brent, 0.65 x Brent, and 0.62 x Brent respectively, reflecting a tighter natural gas balance in the coming years.

The transformation of global LNG trade, from roughly 5% spot and short-term LNG trade in 2000 to roughly 30% in 2023, underscores a higher degree of flexibility in negotiating spot and short-term LNG contracts. This evolution suggests a shift towards contracts potentially decoupled from Brent indexations, challenging the conventional reliance on oil prices as a benchmarking tool for global natural gas prices.


US LNG

A significant surge in global liquefaction (export) capacity is anticipated from the US and Qatar starting in 2026 and beyond. These large-scale liquefaction projects typically entail long-term contracts with predefined off-takers or demand centers, primarily serving power plants or industrial applications. The transportation of substantial LNG volumes from the US to Europe underscores strategic economic and energy considerations. The US, propelled by abundant shale gas resources and extensive LNG liquefaction infrastructure, has emerged as a major LNG exporter. Europe, seeking to diversify energy sources and reduce dependence on Russia, offers an attractive market for American LNG. Additionally, LNG’s flexibility as a cleaner-burning fuel aligns with Europe’s environmental sustainability objectives and transition away from coal.

The transatlantic LNG trade between the US and Europe capitalizes on arbitrage opportunities driven by regional gas price variations and demand-supply imbalances. This flow not only enhances energy security for European nations but also aids NE Asia in meeting environmental obligations.

The US-Europe netback for LNG cargo depends on various economic factors, including global natural gas prices, US regional supply and demand dynamics, and fluctuations in shipping costs.

The competitiveness of US LNG in the European market is influenced by several factors, including the US benchmark price for domestic natural gas (Henry Hub), source gas costs, voyage costs, shipping costs, and regasification costs at the destination.

In more detail the competitiveness of US LNG in the European market is influenced by factors such as the US benchmark price for domestic natural gas (Henry Hub); Source gas cost (Henry Hub + Tolling fee and liquefaction fee); voyage cost (Insurance, port, canal, boil-off, and fuel cost); shipping cost at day rate; and regasification cost in the other end.

A simplified calculation demonstrates the US-EU arbitrage opportunity. At current market figures, the total cost of delivering LNG from the US to Europe is roughly USD 7.05/MMBtu or approximately EUR 22/MWh. Comparatively, the EU TTF front-month contract trades at EUR 28/MWh, indicating an average EUR 6/MWh arbitrage opportunity and an equal profit margin for traders. However, with state-of-the-art LNG vessels, the total cost could decrease significantly, resulting in a substantial profit margin for traders.

The calculation (with current market figures all in USD per MMBtu as a standard unit):
Front-month Henry Hub (1.65) + 15% tolling fee (0.25) and liquefaction fee for conventional LNG ships (2.5) + Insurance, port, and canal (on average 0.33) + boil-off and fuel cost (on average 1.2) + regasification (0.5) + shipping cost at current day rate (0.62).

i.e., for total cost from the US to Europe we get 1.65 + 0.25 + 2.5 + 0.33 + 1.2 + 0.5 + 0.62 = USD 7.05/MMBtu – or roughly EUR 22/MWh. At the time of writing, the EU TTF front-month contract is trading at EUR 28/MWh. Hence, in the current spot market, the US-EU arbitrage is at roughly on average EUR 6/MWh and equally EUR 6/MWh profit to trader. However, this is a conservative estimate. In a situation with a state-of-the-art MEGI / X-DF LNG vessel, we would have a lower liquefaction fee and per unit insurance, boil-off, and fuel cost, which would imply a total cost of USD 6.0/MMBtu (EUR 18.5/MWh) – consequently, a massive EUR 9.5/MWh profit to the trader. Understating the massive economic argument in shipping LNG from the US to the EU (at current market rates).

But even though a substantial arrival of LNG export capacity in the US is approaching, it is not like the US has unlimited natural gas production, or unlimited LNG capacity to feed the global thirst for LNG. Hence, it is not like the EU TTF will plunge to levels comparable to the US Henry Hub + all associated costs for delivering to the EU.

A substantial surge in LNG export capacity is imminent, fueled by significant investments totaling USD 235 billion directed towards upcoming super-chilled fuel projects since 2019. The majority of these projects are slated to come online from the second half of 2025 onward, with an additional USD 55 billion investment expected by 2025, driving a remarkable 45% surge in LNG liquefaction capacity by the end of the decade.

Currently, the global LNG export market boasts a total capacity of approximately 420 million tonnes, projected to expand significantly to 610 million tonnes by 2030. The bulk of this expansion will stem from Qatar, Russia, and the US, with capacities increasing by roughly 23, 26, and 117 million tonnes respectively from 2024 to 2030.

However, it’s worth noting that on January 26, 2024, the Biden Administration paused LNG exports to non-FTA countries, awaiting updated analyses by the DOE. This affects 4 major projects and risks WTO challenges. The DOE cites outdated assessments, signaling a policy shift and raising market uncertainties.

This pause could have significant geopolitical and trade implications, as it also becomes an election issue. Stakeholders, including exporters and developers, now face uncertainties and must review agreements. Overall, the pause prompts a broader review of LNG export policies, impacting domestic and international markets. However, it’s too early to fully assess its impact, so the aforementioned capacity forecast remains firm for now.

The industry’s confidence is underpinned by the anticipation of rising LNG demand, driven by Europe’s efforts to reduce reliance on Russian gas and Asia’s shift away from coal, particularly in China. Yet, this expansion is not merely speculative; it represents a long-term commitment between suppliers and off-takers. These projects typically entail long-term contracts of 20+ years, often supplying power plants or industrial applications. Consequently, the new LNG export capacity is expected to match a similar scale of demand.

The significant export ventures from the United States to Qatar will further cement LNG’s role in the global energy landscape, with contracts extending well into the 2050s, even surpassing some carbon-neutral targets.

Moreover, there remains ample room for natural gas in the long run. The COP28 acknowledged that transitional fuels like LNG can facilitate the energy transition, signaling implicit support for LNG over dirtier fossil fuels.

Critics argue that natural gas isn’t the most environmentally friendly fossil fuel due to potential methane leakage along the supply chain. However, such concerns arise belatedly as the wave of new facilities is already underway. With oil demand reaching its peak and coal declining gradually, gas is expected to maintain its prominence in the energy mix.


SUPPLY & DEMAND

In the short term, the winter wildcard/premium is gone, pointing to a healthier Q2 2024. We have, a while back, pinpointed that the European natural gas market is in a limbo state between supply uncertainties and demand uncertainties. With a consequence of a winter wildcard largely being balanced by the short/medium-term weather and withdrawal rate of European natural gas inventories.

Recent weather forecasts predict slightly colder temperatures in early April across Northwest Europe, but the preceding winter months saw normal to milder conditions, resulting in lower-than-expected inventory drawdowns and weak price trends.

Looking ahead, forecasts for April to June 2024 suggest above-normal temperatures in Northwest Europe, reducing heating and power demand and maintaining subdued gas consumption. Prices in Q2-24 are forecasted to average around EUR 25/MWh.

Daily LNG imports - Europe

Furthermore, it is easy to think of the faded energy crisis as a European crisis. But the adaptation for global gas markets has been equally/more important. Very high global gas prices have resulted in adaption in all corners of the globe, consequently, easing the global natural gas balance and freeing more gas volumes to the highest bidder at more “reasonable” prices. During the peak of the crisis, the highest bidder was naturally Europe which was sucking up all excess global LNG volumes. However, at the current price levels, the “three importing giants”, namely China, South Korea, and Japan have finally woken up, and are no longer “re-routing” their LNG cargos, while also actively participating in the short-term/spot market.

Russia’s grip over the EU is expected to weaken in the spring/summer of 2024. Since February/March 2022, President Putin sought to balance revenue generation and geopolitical pressure by controlling the energy supply to the EU. This strategy faced challenges: reducing exports to zero would jeopardize revenue, while high exports would alleviate the EU’s energy crisis, as seen in winter 2022/23. Despite efforts, Putin’s goal of using natural gas as a strategic tool faltered in winter 2023/24.

Russia - Europe pipeline flow of natural gas

Market adaptation ensued. Since December 2022, Russian piped gas supply to Europe has fluctuated between 10-25% of historical averages, currently nearing 20%. To intensify geopolitical pressure, Russia may need to further reduce flows, possibly to around 10% in winter 2024/25. Despite the distant outlook, the market has already factored in potential price increases for next winter.

Two main pipelines deliver Russian gas to Europe: ”Turkstream,” to Turkey, and the ”Brotherhood,” through Ukraine to Slovakia. These pipelines each contribute roughly 50% of the 0.75 TWh per day flow. The pipeline via Ukraine faces physical risks, and a supply halt is likely next winter as the transit agreement between Gazprom and Naftogaz expires in December 2024, with little chance of renewal.


EU INVENTORIES

The trajectory of EU natural gas inventories for the upcoming summer is primarily influenced by both the global LNG market and European natural gas demand. In Q2-23 (one year ago), inventories commenced the injection season at an all-time high, leading to the current record-high inventory status. These comfortable inventories suggest the EU has the situation under control as it emerges from the winter season. Currently, inventories stand at 59%, a substantial 25% above the 2015-2022 average.

European natural gas inventories

Despite missing out on over 1,000 TWh of natural gas imports from Russia compared to historical levels, the mild winter of 2022/23, reduced demand due to high prices, and increased LNG imports compensated with an additional 1,400 TWh. This over-compensation of 400 TWh in Q1-23 facilitated an unprecedented injection rate into European inventories during Q1 and Q2 2023. As a result, European inventories shifted from a deficit of 180 TWh in January 2022 to a surplus of 259 TWh in April 2023, leading to the current record-high levels.

However, if NE Asia, predominantly led by China, continues to outbid the EU for LNG cargo and industrial gas demand increases due to favorable long-term hedging levels, current comfortable inventory levels will gradually return to normal. This suggests EU TTF prices will slowly climb towards over EUR 30/MWh by the next heating season, a trend partly factored into current pricing.

While the crisis urgency has faded, market adjustments now activate at lower price thresholds. Nonetheless, we anticipate slightly higher long-term price levels (EUR 30/MWh) due to increasing LNG bids from China (+NE Asia), a rebound in EU demand, and reduced LNG imports influenced by lower prices. This will result in a slower inventory build during Q2-24 and Q3-24 compared to last year. Despite diminishing supply from Russia, the EU remains focused on maintaining preparedness for future winters, leading to a new normal in natural gas inventory levels throughout the year.

The European energy crisis has significantly eased during 2023 and Q1-24. Softened front-end prices influence longer-dated prices, with the winter premium/seasonality fully washed out during the ongoing heating season. Healthy EU natural gas inventories, currently at 59% capacity (675 TWh) and surpassing the European Commission’s target of reaching 90% storage fullness by 1 November, contribute to this subsiding crisis. Continued subdued European consumption (11% below historical averages) and robust LNG imports set a ceiling on short-term prices, although increased EU demand could quickly alter this scenario, as EU demand has proven stickier than anticipated.

DEMAND RECOVERY

Reduced uncertainty and lower prices are expected to lead to more long-term hedging. Since the start of Q1 2024 (year-to-date), the TTF spot has averaged EUR 27/MWh, approximately USD 50/boe, only marginally below the ’historical norm’ when adjusted for inflation. Despite these price levels, a resurgence in European industrial gas consumption during the winter is not straightforward.

EU natura gas demand recuction vs normal

Industrial gas demand remains subdued, sitting 11% below historical averages. While this marks an improvement from the 25-30% drop experienced in mid-summer 2022 – a period characterized as the ”peak of the crisis” – when spot prices consistently traded at EUR 150/MWh (USD 255/boe).

The slower-than-expected recovery is largely attributed to industries hesitating to commit to longer-term prices. For example, during Q4 2023, despite tumbling spot prices, futures prices remained strong. In mid-October, gas for delivery in January 2024 was priced at EUR 55/MWh (USD 103/boe). Thus, during Q4 2023, peak-winter prices maintained a considerable premium over spot prices to a large extent.

However, the current landscape has changed. The winter premium has diminished as we exit the heating season, and weak spot prices predominantly drive forward. This reflects a market that is more certain and willing to forecast futures during a less turbulent phase. The convergence and narrowing gap between spot and long-term prices signify that ”peak natural gas has passed.” Major consumers in Europe are expected to adopt more long-term hedging for longer-term prices, ideally hedging these futures close to current spot prices. This suggests that current market prices will likely trigger increased consumption compared to Q3 and Q4 2023, although a full-scale comeback will take time.

As previously noted, substantial demand destruction occurred not only in Europe but also globally, particularly in Asia. Over the last couple of years, demand destruction amounted to approximately 800 TWh per year, while the normal growth rate in the global LNG market is 200 TWh per annum. This indicates that most of the demand will eventually return, although the timing remains uncertain. 


NE ASIAN LNG

EUR 25/MWh presents a favorable ”buy opportunity,” and prices are expected to either slide or climb from this point. The decline in prices can be attributed to sustained low demand and high inventories. We anticipate prices to either slide or increase from here, with minimal downside, as prices are likely to find support around EUR 25/MWh.

Forward prices for both JKM and TTF indicate that the NE Asian LNG market will remain a preferred destination for marginal LNG cargo in the near term. While the EU previously heavily relied on NE Asia, the European market can no longer solely depend on the economic vulnerabilities of NE Asia or China.

LNG arbitrage

A long-awaited pent-up demand for energy in China would lead to increased demand for goods and services, consequently boosting energy consumption, particularly natural gas, primarily in the form of LNG. In such a scenario, the JKM may command a larger premium over the TTF than the existing EUR 2.5/MWh (3-month rolling contract). This would divert LNG spot cargoes away from Europe, further reducing the EU’s natural gas surplus. Thus, the ongoing recovery in China’s economy is likely to stimulate Asia’s demand for natural gas, potentially resulting in EU LNG purchasers paying a premium to secure essential LNG imports in the future.

Daily LNG imports NE Asia

With current prices, we anticipate an increase in EU demand coupled with a decrease in EU LNG imports. This trend may persist until we observe a slight shortfall in compensation relative to the natural gas deficit from Russia, which could drive prices upward during the summer.


KEY TAKEAWAYS

The ongoing transition from coal to natural gas signifies a significant shift in the global energy landscape. Natural gas emerges as a crucial bridging technology, offering a cleaner alternative to coal and facilitating the transition toward widespread adoption of renewable energy sources. This transition underscores the environmental benefits of natural gas, positioning it as a pivotal component in mitigating climate change and reducing greenhouse gas emissions.

Despite challenges such as the reduction in Russian gas supply, the natural gas market is adapting rapidly. Europe, in particular, faces competition for global LNG volumes, primarily sourced from the US and Qatar. The market’s ability to swiftly adjust reflects its adaptability and resilience on a global scale, highlighting the importance of diversifying energy sources and supply routes.

Our current natural gas price forecast relies on achieving a delicate equilibrium among key factors. This includes stimulating demand, maintaining a correlation with crude prices, and ensuring cost coverage for US natural gas transportation. Striking this balance is essential for maintaining stability and sustainability in European gas pricing dynamics, ensuring energy security.

In response to changing market conditions, we have revised our price outlook downward for the short term, notably for Q2-24, Q3-24, and FY 2024. Specifically, Q1-24 is forecasted to average EUR 27/MWh, followed by predictions of EUR 25/MWh for Q2-24, EUR 28/MWh for Q3-24, and EUR 32/MWh for Q4-24. However, prices are expected to gradually increase over the longer term, with an average forecast of EUR 30/MWh for the years 2025, 2026, and 2027, slightly higher than historical averages.

This revised outlook reflects the evolving nature of the natural gas market and the need for flexibility in response to changing geopolitical landscapes and supply dynamics. Looking ahead, natural gas remains a crucial bridge over coal, facilitating the transition towards cleaner energy sources.

Fortsätt läsa

Analys

Fed cuts ahead bolstering oil prices

Publicerat

den

SEB - analysbrev på råvaror

Initially, Brent Crude experienced a decline yesterday following the release of US crude inventories data. However, nationwide US crude inventories, excluding those held in the Strategic Petroleum Reserve (SPR), saw a decline for the second consecutive week, remaining below the five-year seasonal average. Additionally, there was a larger-than-expected decline in gasoline holdings. While the overall draw presents a bullish narrative, it required some support from yesterday’s Federal Reserve announcement to trend in a positive direction.

Ole R. Hvalbye, Analyst Commodities, SEB

The Brent Crude front-month contract strengthened before yesterday’s close and has continued this positive momentum into today, currently trading at USD 86.5 per barrel. This reflects an increase of roughly USD 1 per barrel (1%) compared to yesterday evening’s low point.

The Federal Reserve signaled its intention to adhere to its outlook for three rate cuts this year, boosting both risk appetite and weakening the US dollar, which has benefited global crude prices.

In our analysis, global crude prices are currently supported by strong fundamentals. Demand growth remains robust, complemented by significant production cuts by OPEC+ and subdued output from US shale oil producers. Consequently, the global oil market is operating at a slight deficit, resulting in a gradual depletion of oil inventories, as evidenced by the recent declines in US crude and product inventories (further details below). This trend is expected to provide support for oil prices and potentially drive them sideways to upwards, with limited downside risks.

However, it’s important to note that while fundamentals appear promising and the oil market has found some reassurance in yesterday’s Federal Reserve announcement, expectations for enduring inflation may act as a headwind for oil prices over the longer term, potentially capping a significant oil price rally.

As a reminder, our assumptions for Brent oil prices have remained firm since September 2023. We anticipate Brent Crude to average USD 85/bl and USD 87.5/bl for 2024 and 2025, respectively, with projections of USD 90/bl for 2026 and 2027.


Yet another week of drawdown in US inventories. Commercial crude oil inventories in the U.S., excluding those held in the Strategic Petroleum Reserve, decreased by 2.0 million barrels from the previous week, reaching a total of 445.0 million barrels. This figure is approximately 3% below the five-year average for this time of year.

Total motor gasoline inventories saw a significant decline of 3.3 million barrels from the previous week, now standing approximately 2% below the five-year average. However, distillate fuel inventories experienced a marginal increase of 0.6 million barrels, remaining roughly 5% below the five-year average. Meanwhile, propane/propylene inventories rose by 0.4 million barrels, reaching a notable 9% above the five-year average.

Overall commercial petroleum inventories witnessed a decrease of 6.1 million barrels last week. Total products supplied over the last four-week period averaged 20.1 million barrels per day, indicating a 2.2% increase from the same period last year.

Motor gasoline product supplied averaged 8.8 million barrels per day over the past four weeks, showing a marginal increase of 0.3% from the same period last year. Conversely, distillate fuel product supplied averaged 3.7 million barrels per day, down by 1.9% from the same period last year. Jet fuel product supplied experienced a slight decrease of 0.2% compared to the same four-week period last year.

Fortsätt läsa

Populära