

Analys
Saudi Arabia cuts crude oil exports to 6.6 mb/d

 Crude oil price action – Prices declined last week despite positive tailwinds from equities and dollar
Brent crude declined 1.7% last week despite the facto f positive tailwinds from a 0.6% gain in global equities and a 1.4% softer USD. Especially the latter should normally have given some support in nominal terms to oil prices. In perspective the other three commodity price sub-indices all made gains last week. Brent crude 1 mth contract closed last week at $48.06/b with its 1.7% decline. The longer dated Dec 2020 contract fell more actually with a decline of 2.8% w/w. This was especially bearish given the 1.4% softer USD. However, what we have said repeatedly is that the forward curve must move lower in order to stem the inflow of oil rigs. At least we got some delivery of that last week. However, so far it is about reversing gains since price trend shifted higher for this contract from June 26.
Following price swings this morning Brent crude is now up 1.2% to $48.6/b after Saudi stated they would cut exports to 6.6 mb/d
Crude oil comment –Saudi Arabia cuts crude oil exports to 6.6 mb/d
Latest: Saudi Arabia has decided to cut crude oil exports to 6.6 mb/d. Last week Saudi stated that they might cut exports by 1 mb/d. Saudi Arabia exported on average 7.2 mb/d from Jan to May. Thus cutting exports to 6.6 mb/d is a real tightening. This is a pure unilateral action. The rest of OPEC and non-OPEC members did not opt for any further cuts at the meeting (still ongoing) in St Petersburg this weekend and today. As such Saudi Arabia is saying that they want a faster re-balancing, faster inventory declines and also a higher oil price. Oil price shifts up 1% to $48.5/b following the statement. It is opportune for Saudi to do this now. Inventories will draw down in H2-17. Thus Said is playing into a positive trend and strengthening it. Net long speculative position by managed money has room to increase and as such prices have the potential to increase in response to a market re-positioning to an increasing long.
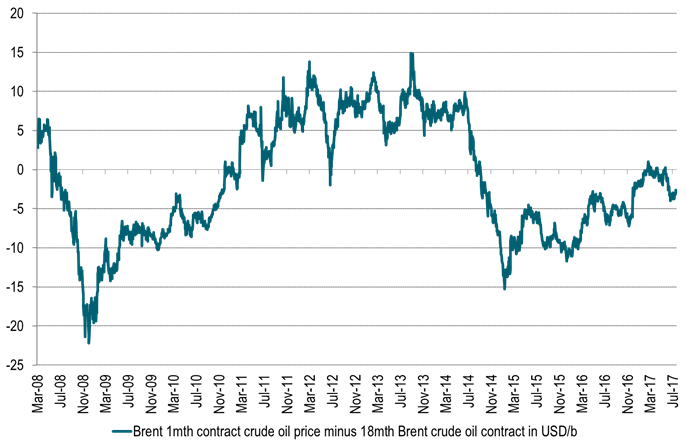
A faster inventory draw on the back of Saudi’s export cuts means more flattening of the forward crude oil curves during H2-17 for spot to 1mth contract and for 1mth to 18 month contract.
OPEC & Co’s Joint technical committee met in St Petersburg on July 22nd this weekend. The market may have hoped for a cap on Libya and Nigeria which have boosted production by half a million barrels from October last year (OPEC production reference for current cuts) to June this year. But hopes were probably not too high because there was little chance for this happening. Libya’s production averaged 840 kb/d in June according to Bloomberg which is slightly more than half of its prior production capacity of 1.6 mb/d. Thus there was no chance what so ever that Libya would accept capping production at current level of about 1 mb/d. Production in both Nigeria and Libya are however very fragile. Thus both may fall back again. But there is little OPEC & Co can do about it either way. That was also the outcome this weekend. No cap for Libya and Nigeria was even discussed.
Today OPEC & Co’s Joint ministerial monitoring committee is meeting in St Petersburg. The outcome is already pretty clear. “There will be no discussion of deeper cuts” said Saudi Arabia’s Minister of Energy Khalid Al-Falih. OPEC’s Secretary-General Mohammed Barkindo further stated that: “The re-balancing process may be going at a slower pace than earlier projected, but it is on course, and it’s bound to accelerate in the second half (of the year)”.
We concur with Barkindo. Inventories will draw down in H2-17. Point in case here is inventory draws in data from the last four weeks indicating draws of some 50 mb. During three weeks in June however these data instead showed a gain of close to 50 mb instead. That was part of the reason why oil prices fell in June and bottomed out on June 21st.
In perspective however the number of Drilled, but yet uncompleted wells (DUC’s) increased by 182 (4 main shale oil regions) wells during June. Looking at current well production levels and profiles for new US shale oil wells these 182 wells constitutes about 60 mb of producible oil within a three year time horizon. These must be considered as a type of oil inventory.
Since November last year when OPEC decided to cut the number of DUCs increased by 1188 wells to June (4 main regions). Again looking at current well and production profiles this equates to some 370 mb of producible oil over a three year period from these 1188 wells.
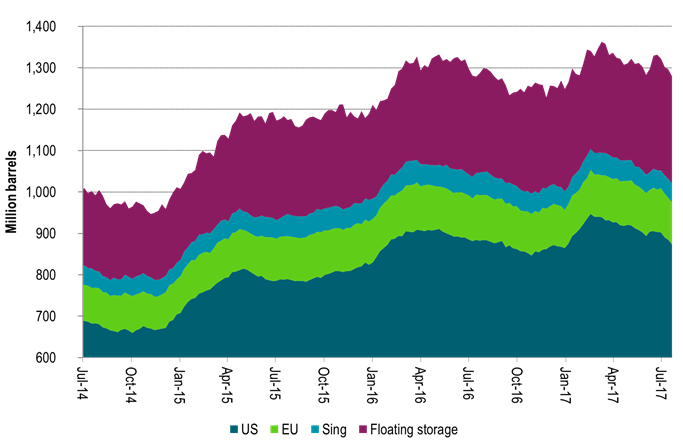
So OECD inventories are basically sideways from November last year to May this year with some 250 to 300 mb above normal. However, the three year producible inventory of US shale oil DUC’s has increased some 370 mb from November 2017 to June 2018. However, they are not sitting in the OECD inventories and are as such not felt directly in the crude oil spot market. They do however create a lot of surplus buffer inventory on top of the OECD inventories. This should help to keep oil prices in check and oil price volatility at bay over the nearest couple of years.
So while OPEC & Co in general and Saudi Arabia specifically are likely to be successful in drawing down inventories in H2-17 they may not be all that successful in total if we look at DUC’s + OECD in total.
Ch0: Managed money in WTI – some increase latest three weeks. More room to increase on the back of Saudi export cut
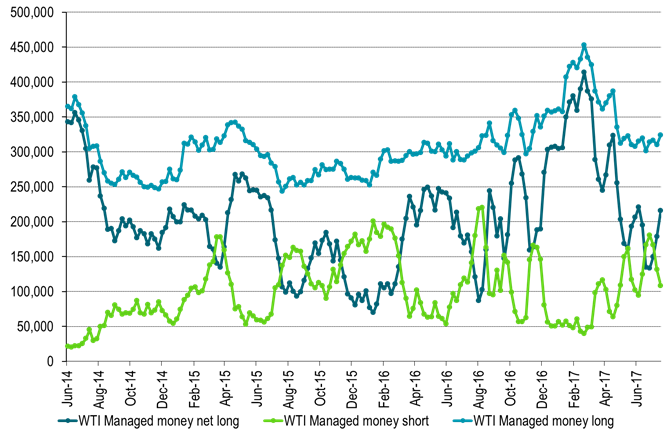
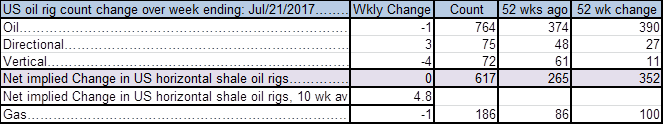
Table 1: US oil rigs down by 1 last week
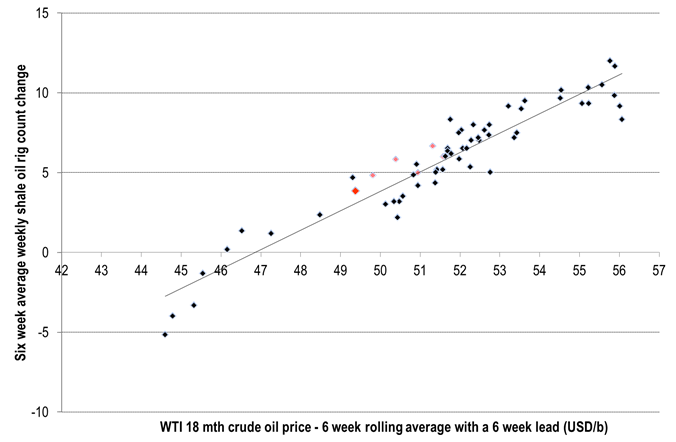
Ch1: US shale oil rig versus WTI 18mth crude oil price probably slightly lower than $47/b
Ch2: Declining US WTI 18mth prices last six weeks calls for further slowing of rig additions next six weeks
However, WTI 18 mth price has still not yet moved to a level which will push rigs out of the market
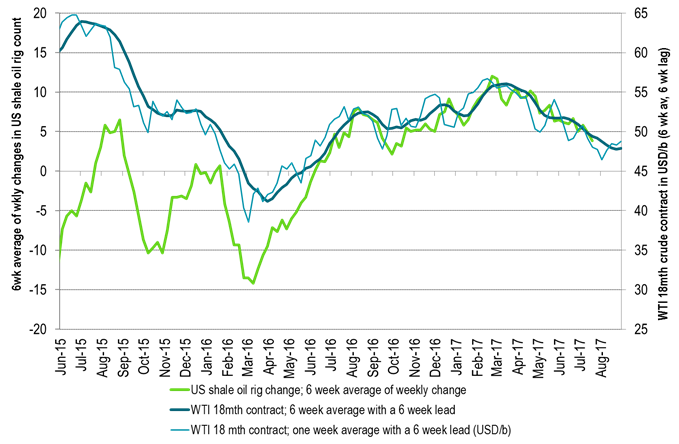
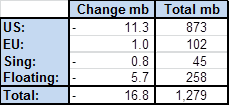
Table2: Solid inventory draws in data last week
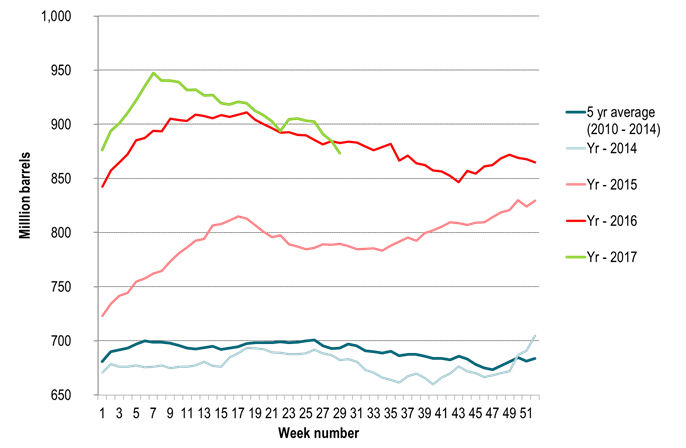
Ch3: Following a 3 week inventory rise in June, inventories have declined some 50 mb last 4 weeks
More to come in H2-17
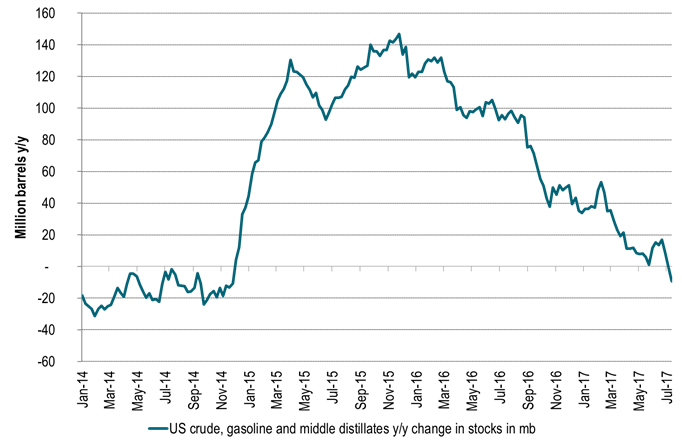
Ch4: US crude, gasoline and mid-distillate inventories down y/y for the first time since 2014 in last week’s data
Ch5: US crude, gasoline and mid-distillate inventories down y/y for the first time since 2014 in last week’s data
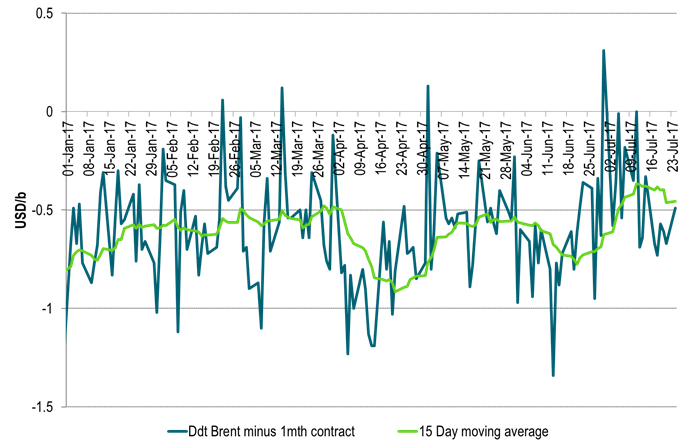
Ch6: Brent dated price to 1mth contract still in negative territory
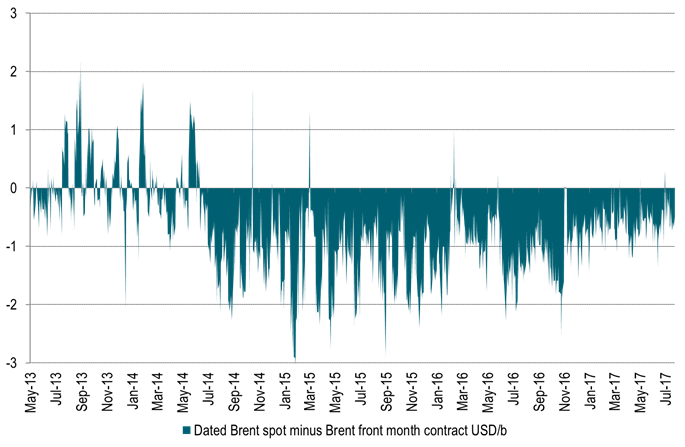
Ch7: Brent dated to 1mth contract spread should tighten during inventory draws in H2-17
Ch8: More tightening of Brent 1mth to 18mth contract should also materialize over H2-17
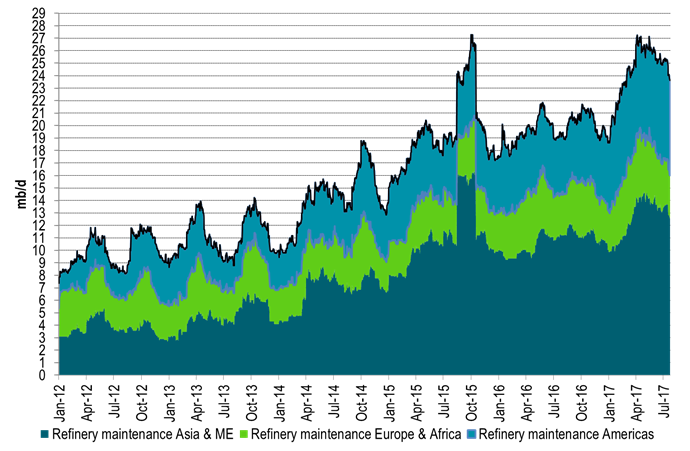
Ch9: Global refinery maintenance keeps falling back. Refineries keep coming back on line consuming more crude oil
This should help firming up the crude market.
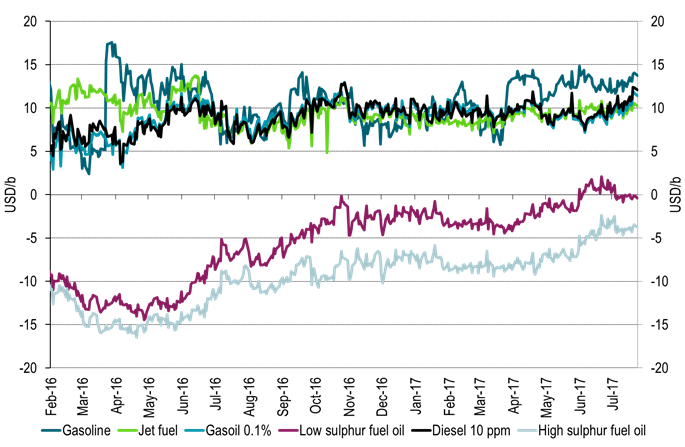
Ch10: Refinery margins which have been high during refinery maintenance risks falling back however
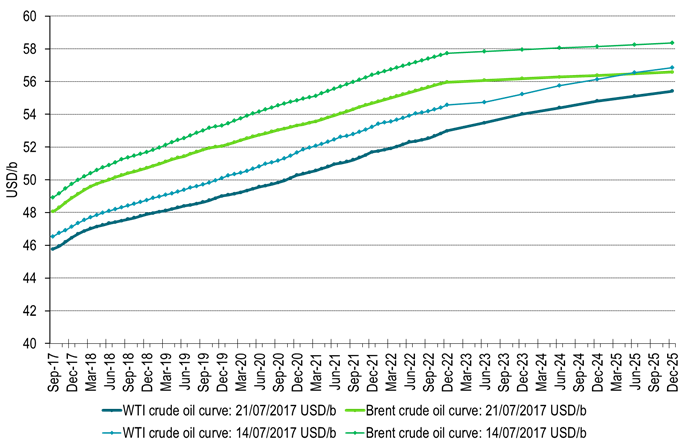
Ch11: Forward crude curves as of Friday and the Friday before. Lower w/w
Kind regards
Bjarne Schieldrop
Chief analyst, Commodities
SEB Markets
Merchant Banking
Brent is climbing higher. Front-month is at USD 106.3/bl this morning, close to a weekly high and a USD 9/bl jump from Mondays open. This is the move we flagged as a risk earlier in the week: the market shifting from ”a deal is around the corner” to ”this is going to take longer than we thought”.

Analyst Commodities, SEB
During April, rest-of-year Brent remained remarkably stable around USD 90/bl. A stability which rested on one single assumption: the SoH reopens around 1 May. That assumption is now slowly falling apart.
As we highlighted yesterday: every week of delay beyond 1 May adds (theoretically) ish USD 5/bl to the rest-of-year average, as global inventories draw 100 million barrels per week. i.e., a mid-May reopening implies rest-of-year Brent closer to USD 100/bl, and anything pushing into June or July takes us meaningfully higher.
What’s changed in the last 48 hours:
#1: The US military has formally warned that clearing suspected sea mines from SoH could take up to six months. That is a completely different timescale from what the financial market is pricing. Even a political deal tomorrow does not immediately reopen the strait.
#2: Trump has shifted his tone from urgency to ”strategic patience”. In yesterday’s press conference: ”Don’t rush me… I want a great deal.” The market is reading this as a president no longer feeling pressured by timelines, with the naval blockade running in the background.
#3: So far, the military activity is escalating, not de-escalating. Axios reports Iran is laying more mines in SoH. The US 3rd carrier strike group (USS George H.W. Bush) is arriving with two countermine vessels. Trump yesterday ordered the US Navy to destroy any Iranian boats caught laying mines. While CNN reports that the Pentagon is actively drawing up plans to strike Iranian SoH capabilities and individual Iranian military leaders if the ceasefire collapses. i.e., NOT a attitude consistent with an imminent deal!
Spot crude and product prices eased off the early-April highs on a combination of system rerouting and deal optimism. Both now weakening. Goldman estimates April Gulf output is reduced by 14.5 mbl/d, or 57% of pre-war supply, a number that keeps getting worse the longer this drags on.
Demand-side adaptation is ongoing: S. Korea has cut its Middle East crude dependence from 69% to 56% by pulling more from the Americas and Africa, and Japan is kicking off a second round of SPR releases from 1 May. But SPRs are finite.
Ref. to the negotiations, we should not bet on speed. The current Iranian leadership is dominated by genuine hardliners willing to absorb economic pain and run the clock to extract concessions. That is not a setup for a rapid resolution. US/Israeli media briefings keep framing the delay as ”internal Iranian divisions”, the reality is more complicated and points toward weeks and months, not days.
Our point is that the complexity is large, and higher prices have only just started (given a scenario where the negotiations drag out in time). The market spent April leaning on the USD 90/bl rest-of-year assumption; that case is diminishing by the hour. If ”early May reopening” is replaced by ”June, July or later” over the next week or two, both crude and products have meaningful room to reprice higher from here. There is a high risk being short energy and betting on any immediate political resolution(!).
Down on Friday. Up on Monday. The Brent June crude oil contract traded down 5.1% last week to a close of $90.38/b. It reached a high of $103.87/b last Monday and a low of $86.09/b on Friday as Iran announced that the Strait of Hormuz was fully open for transit. That quickly changed over the weekend as the US upheld its blockade of Iranian oil exports while Iran naturally responded by closing the SoH again. The US blew a hole in the engine room of the Iranian ship TOUSKA and took custody of the ship on Sunday. Brent crude is up 5.6% this morning to $95.4/b.

The cease-fire is expiring tomorrow. The US has said it will send a delegation for a second round of negotiations in Islamabad in Pakistan. But Iran has for now rejected a second round of talks as it views US demands as unrealistic and excessive while the US is also blocking the Strait of Hormuz.
While Brent is up 5% this morning, the financial market is still very optimistic that progress will be made. That talks will continue and that the SoH will fully open by the start of May which is consistent with a rest-of-year average Brent crude oil price of around $90/b with the market now trading that balance at around $88/b.
Financial optimism vs. physical deterioration. We have a divergence where the financial market is trading negotiations, improvements and resolution while at the same time the physical market is deteriorating day by day. Physical oil flows remain constrained by disrupted flows, longer voyage times and elevated freight and insurance costs.
Financial markets are betting that a US/Iranian resolution will save us in time from violent shortages down the road. But every day that the SoH remains closed is bringing us closer to a potentially very painful point of shortages and much higher prices.
The US blockade is also a weapon of leverage against its European and Asian allies. When Iran closed the SoH it held the world economy as a hostage against the US. The US blockade of the SoH is of course blocking Iranian oil exports. But it is also an action of disruption directed towards Europe and Asia. The US has called for the rest of the world to engaged in the war with Iran: ”If you want oil from the Persian Gulf, then go and get it”. A risk is that the US plays brinkmanship with the global oil market directed towards its European and Asian allies and maybe even towards China to force them to engage and take part. Maybe unthinkable. But unthinkable has become the norm with Trump in the White House.
Wild moves yesterday. Brent crude traded to a high of $114.43/b and a low of $96.0/b and closed at $99.94/b yesterday.
US – Iran negotiations ongoing or not? What a day. Donald Trump announced that good talks were ongoing between Iran and the US and that the 48 hour deadline before bombing Iranian power plants and energy infrastructure was postponed by five days subject to success of ongoing meetings. Iranian media meanwhile stated that no meetings were ongoing at all.
Today we are scratching our heads trying to figure out what yesterday was all about.
Friends and family playing the market? Was it just Trump and his friends and family who were playing with oil and equity markets with $580m and $1.46bn in bets being placed by someone in oil and equity markets just 15 minutes before Trump’s announcement?
Was Trump pulling a TACO as he reached his political and economic pain point: Brent at $112/b, US Gas at $4/gal, SPX below 200dma and US 10yr above 4.4%?
Different Iranian factions with Trump talking with one of them? Are there real negotiations going on but with the US talking to one faction in Iran while another, the hardliners, are not involved and are denying any such negotiations going on?
Extending the ultimatum to attack and invade Kharg island next weekend? Or, is the five day delay of the deadline a tactical decision to allow US amphibious assault ships and marines to arrive in the Gulf in the upcoming weekend while US and Israeli continues to degrade Iranian military targets till then. And then next weekend a move by the US/Israel to attack and conquer for example the Kharg island?
We do not really know which it is or maybe a combination of these.
We did get some kind of TACO ydy. But markets have been waiting for some kind of TACO to happen and yesterday we got some kind of TACO. And Brent crude is now trading at $101.5/b as a result rather than at $112-114/b as it did no the high yesterday.
But what really matters in our view is the political situation on the ground in Iran. Will hardliners continue to hold power or will a more pragmatic faction gain power?
If the hardliners remain in power then oil pain should extend all the way to US midterm elections. The hardliners were apparently still in charge as of last week. Iran immediately retaliated and damaged LNG infrastructure in Qatar after Israel hit Iranian South Pars. The SoH was still closed and all messages coming out of Iran indicated defiance. Hardliners continues in power has a huge consequence for oil prices going forward. The regime has played its ’oil-weapon’ (closing or chocking the Strait of Hormuz). It is using it to achieve political goals. Deterrence: it needs to be so politically and economically expensive to attack Iran that it won’t happen again in the future. Or at least that the US/Israel thinks 10-times over before they attack again. The highest Brent crude oil closing price since the start of the war is $112.19/b last Friday. In comparison the 20-year inflation adjusted Brent price is $103/b. So Brent crude last Friday at $112.19/b isn’t a shockingly high price. And it is still far below the nominal high of $148/b from 2008 which is $220/b if inflation adjusted. So once in a lifetime Iran activates its most powerful weapon. The oil weapon. It needs to show the power of this weapon and it needs to reap political gains. Getting Brent to $112/b and intraday high of $119.5/b (9 March) isn’t a display of the power of that weapon. And it is not a deterrence against future attacks.
So if the hardliners remain in power in Iran, then the SoH will likely remain chocked all the way to US midterm elections and Brent crude will at a minimum go above the historical nominal high of $148/b from 2008.
Thus the outlook for the oil price for the rest of the year doesn’t depend all that much of whether Trump pulls a TACO or not. Stops bombing or not. It depends more on who is in charge in Iran. If it is the hardliners, then deterrence against future attacks via chocking of the SoH and high oil prices is the likely line of action. It is impacting the world but the Iranian ’oil-weapon’ is directed towards the US president and the the US midterm elections.
If a pragmatic faction gets to power in Iran, then a very prosperous future is possible. However, if power is shifting towards a more pragmatic faction in Iran then a completely different direction could evolve. Such a faction could possibly be open for cooperation with the US and the GCC and possibly put its issues versus Israel aside. Then the prosperity we have seen evolving in Dubai could be a possible future also for Iran.
So far it looks like the hardliners are fully in charge. As far as we can see, the hardliners are still fully in control in Iran. That points towards continued chocking of the SoH and oil prices ticking higher as global inventories (the oil market buffers) are drawn lower. And not just for a few more weeks, but possibly all the way to the US midterm elections.


Brent crude up USD 9/bl on the week… ”deal around the corner” narrative fades
Market Still Betting on Timely Resolution, But Each Day Raises Shortage Risk

Christian Kopfer om läget för oljan

Marknaden måste börja betrakta de höga kopparpriserna som det nya normala

Det fysiska spotpriset på brentolja har slagit nytt rekord

40 minuter med Javier Blas om hur världen verkligen påverkas av energikrisen

Elpriserna fördubblas, stor osäkerhet inför sommaren
Det fysiska spotpriset på brentolja har slagit nytt rekord
Marknaden måste börja betrakta de höga kopparpriserna som det nya normala
Christian Kopfer om läget för oljan
-
 Nyheter3 veckor sedan
40 minuter med Javier Blas om hur världen verkligen påverkas av energikrisen
-
 Nyheter4 veckor sedan
Elpriserna fördubblas, stor osäkerhet inför sommaren
-
 Nyheter3 veckor sedan
Det fysiska spotpriset på brentolja har slagit nytt rekord
-
 Nyheter2 veckor sedan
Marknaden måste börja betrakta de höga kopparpriserna som det nya normala
-
 Nyheter2 veckor sedan
Christian Kopfer om läget för oljan
-

 Nyheter3 veckor sedan
Efter tillväxten: Guldbrev satsar på expansion i Europa
-
Analys4 dagar sedan
Market Still Betting on Timely Resolution, But Each Day Raises Shortage Risk
-
Analys11 timmar sedan
Brent crude up USD 9/bl on the week… ”deal around the corner” narrative fades