

Analys
Saudi Arabia cuts crude oil exports to 6.6 mb/d

 Crude oil price action – Prices declined last week despite positive tailwinds from equities and dollar
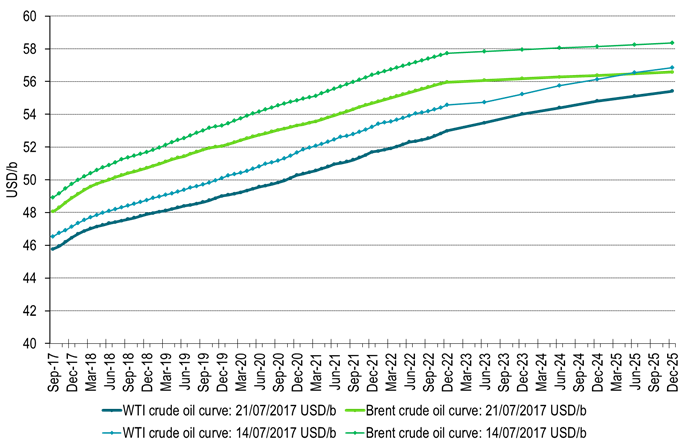
Brent crude declined 1.7% last week despite the facto f positive tailwinds from a 0.6% gain in global equities and a 1.4% softer USD. Especially the latter should normally have given some support in nominal terms to oil prices. In perspective the other three commodity price sub-indices all made gains last week. Brent crude 1 mth contract closed last week at $48.06/b with its 1.7% decline. The longer dated Dec 2020 contract fell more actually with a decline of 2.8% w/w. This was especially bearish given the 1.4% softer USD. However, what we have said repeatedly is that the forward curve must move lower in order to stem the inflow of oil rigs. At least we got some delivery of that last week. However, so far it is about reversing gains since price trend shifted higher for this contract from June 26.
Following price swings this morning Brent crude is now up 1.2% to $48.6/b after Saudi stated they would cut exports to 6.6 mb/d
Crude oil comment –Saudi Arabia cuts crude oil exports to 6.6 mb/d
Latest: Saudi Arabia has decided to cut crude oil exports to 6.6 mb/d. Last week Saudi stated that they might cut exports by 1 mb/d. Saudi Arabia exported on average 7.2 mb/d from Jan to May. Thus cutting exports to 6.6 mb/d is a real tightening. This is a pure unilateral action. The rest of OPEC and non-OPEC members did not opt for any further cuts at the meeting (still ongoing) in St Petersburg this weekend and today. As such Saudi Arabia is saying that they want a faster re-balancing, faster inventory declines and also a higher oil price. Oil price shifts up 1% to $48.5/b following the statement. It is opportune for Saudi to do this now. Inventories will draw down in H2-17. Thus Said is playing into a positive trend and strengthening it. Net long speculative position by managed money has room to increase and as such prices have the potential to increase in response to a market re-positioning to an increasing long.
A faster inventory draw on the back of Saudi’s export cuts means more flattening of the forward crude oil curves during H2-17 for spot to 1mth contract and for 1mth to 18 month contract.
OPEC & Co’s Joint technical committee met in St Petersburg on July 22nd this weekend. The market may have hoped for a cap on Libya and Nigeria which have boosted production by half a million barrels from October last year (OPEC production reference for current cuts) to June this year. But hopes were probably not too high because there was little chance for this happening. Libya’s production averaged 840 kb/d in June according to Bloomberg which is slightly more than half of its prior production capacity of 1.6 mb/d. Thus there was no chance what so ever that Libya would accept capping production at current level of about 1 mb/d. Production in both Nigeria and Libya are however very fragile. Thus both may fall back again. But there is little OPEC & Co can do about it either way. That was also the outcome this weekend. No cap for Libya and Nigeria was even discussed.
Today OPEC & Co’s Joint ministerial monitoring committee is meeting in St Petersburg. The outcome is already pretty clear. “There will be no discussion of deeper cuts” said Saudi Arabia’s Minister of Energy Khalid Al-Falih. OPEC’s Secretary-General Mohammed Barkindo further stated that: “The re-balancing process may be going at a slower pace than earlier projected, but it is on course, and it’s bound to accelerate in the second half (of the year)”.
We concur with Barkindo. Inventories will draw down in H2-17. Point in case here is inventory draws in data from the last four weeks indicating draws of some 50 mb. During three weeks in June however these data instead showed a gain of close to 50 mb instead. That was part of the reason why oil prices fell in June and bottomed out on June 21st.
In perspective however the number of Drilled, but yet uncompleted wells (DUC’s) increased by 182 (4 main shale oil regions) wells during June. Looking at current well production levels and profiles for new US shale oil wells these 182 wells constitutes about 60 mb of producible oil within a three year time horizon. These must be considered as a type of oil inventory.
Since November last year when OPEC decided to cut the number of DUCs increased by 1188 wells to June (4 main regions). Again looking at current well and production profiles this equates to some 370 mb of producible oil over a three year period from these 1188 wells.
So OECD inventories are basically sideways from November last year to May this year with some 250 to 300 mb above normal. However, the three year producible inventory of US shale oil DUC’s has increased some 370 mb from November 2017 to June 2018. However, they are not sitting in the OECD inventories and are as such not felt directly in the crude oil spot market. They do however create a lot of surplus buffer inventory on top of the OECD inventories. This should help to keep oil prices in check and oil price volatility at bay over the nearest couple of years.
So while OPEC & Co in general and Saudi Arabia specifically are likely to be successful in drawing down inventories in H2-17 they may not be all that successful in total if we look at DUC’s + OECD in total.
Ch0: Managed money in WTI – some increase latest three weeks. More room to increase on the back of Saudi export cut
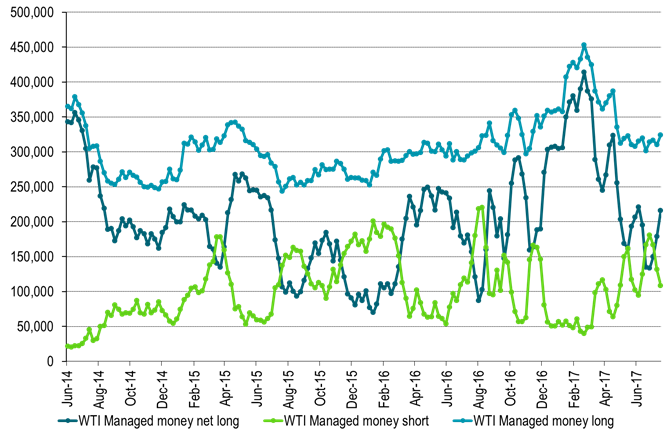
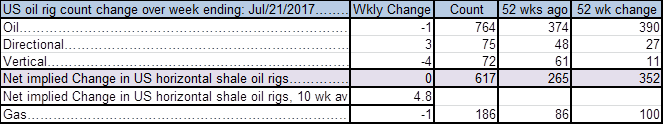
Table 1: US oil rigs down by 1 last week
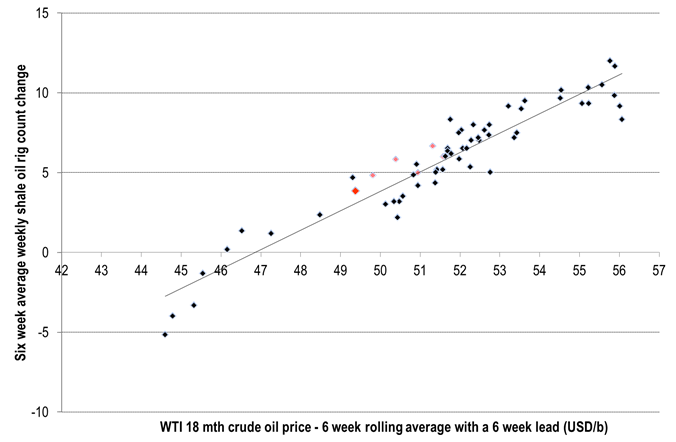
Ch1: US shale oil rig versus WTI 18mth crude oil price probably slightly lower than $47/b
Ch2: Declining US WTI 18mth prices last six weeks calls for further slowing of rig additions next six weeks
However, WTI 18 mth price has still not yet moved to a level which will push rigs out of the market
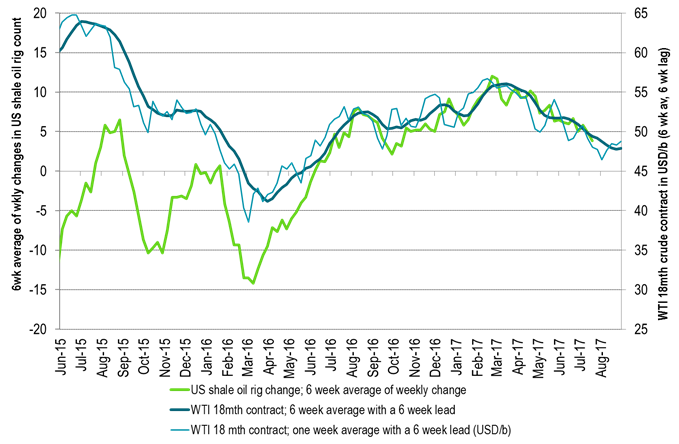
Table2: Solid inventory draws in data last week
Ch3: Following a 3 week inventory rise in June, inventories have declined some 50 mb last 4 weeks
More to come in H2-17
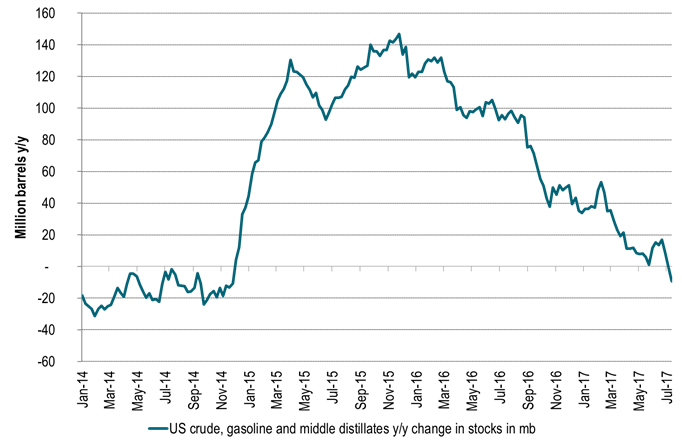
Ch4: US crude, gasoline and mid-distillate inventories down y/y for the first time since 2014 in last week’s data
Ch5: US crude, gasoline and mid-distillate inventories down y/y for the first time since 2014 in last week’s data
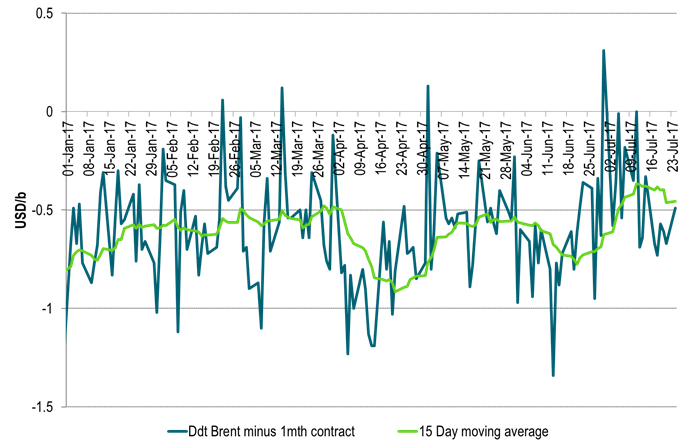
Ch6: Brent dated price to 1mth contract still in negative territory
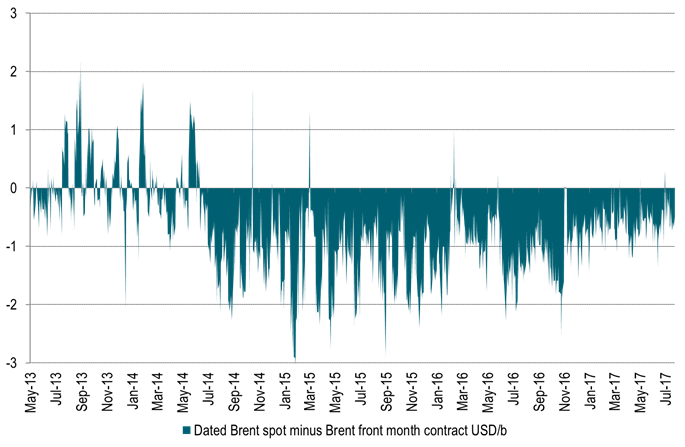
Ch7: Brent dated to 1mth contract spread should tighten during inventory draws in H2-17
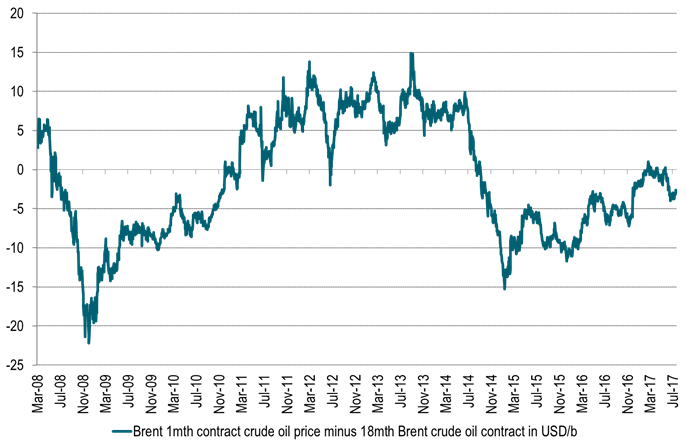
Ch8: More tightening of Brent 1mth to 18mth contract should also materialize over H2-17
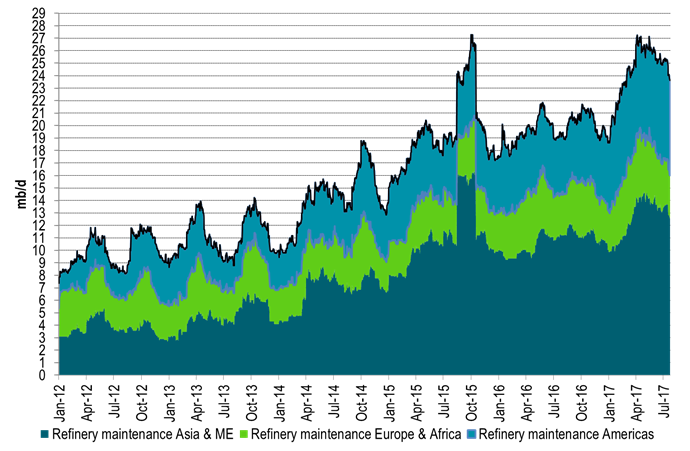
Ch9: Global refinery maintenance keeps falling back. Refineries keep coming back on line consuming more crude oil
This should help firming up the crude market.
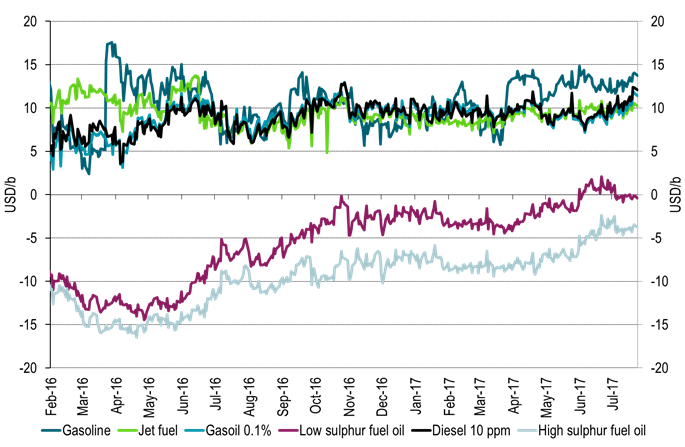
Ch10: Refinery margins which have been high during refinery maintenance risks falling back however
Ch11: Forward crude curves as of Friday and the Friday before. Lower w/w
Kind regards
Bjarne Schieldrop
Chief analyst, Commodities
SEB Markets
Merchant Banking
Hesitant today. Brent jumped to an intraday high of $66.36/b yesterday after having touched an intraday low of $60.07/b on Monday as Indian and Chinese buyers cancelled some Russian oil purchases and instead redirected their purchases towards the Middle East due to the news US sanctions. Brent is falling back 0.4% this morning to $65.8/b.

It’s our strong view that the only sensible thing is to sell this rally. In all Trump’s unpredictability he has become increasingly predictable. Again and again he has rumbled about how he is going to be tough on Putin. Punish Putin if he won’t agree to peace in Ukraine. Recent rumbling was about the Tomahawk rockets which Trump threatened on 10 October and 12 October to sell/send to Ukraine. Then on 17 October he said that ”the U.S. didn’t want to give away weapons (Tomahawks) it needs”.
All of Trump’s threats towards Putin have been hot air. So far Trump’s threats have been all hot air and threats which later have evaporated after ”great talks with Putin”. After all these repetitions it is very hard to believe that this time will be any different. The new sanctions won’t take effect before 21. November. Trump has already said that: ”he was hoping that these new sanctions would be very short-lived in any case”. Come 21. November these new sanctions will either evaporate like all the other threats Trump has thrown at Putin before fading them. Or the sanctions will be postponed by another 4 weeks or 8 weeks with the appearance that Trump is even more angry with Putin. But so far Trump has done nothing that hurt Putin/Russia. We can’t imagine that this will be different. The only way forward in our view for a propre lasting peace in Ukraine is to turn Ukraine into defensive porcupine equipped with a stinging tail if need be.
China will likely stand up to Trump if new sanctions really materialize on 21 Nov. Just one country has really stood up to Trump in his tariff trade war this year: China. China has come of age and strength. I will no longer be bullied. Trump upped tariffs. China responded in kind. Trump cut China off from high-end computer chips. China put on the breaks on rare earth metals. China won’t be bullied any more and it has the power to stand up. Some Chinese state-owned companies like Sinopec have cancelled some of their Russian purchases. But China’s Foreign Ministry spokesperson Guo Jiakun has stated that China “oppose unilateral sanctions which lack a basis in international law and authorization of the UN Security Council”. Thus no one, not even the US shall unilaterally dictate China from whom they can buy oil or not. This is yet another opportunity for China to show its new strength and stand up to Trump in a show of force. Exactly how China choses to play this remains to be seen. But China won’t be bullied by over something as important as its oil purchases. So best guess here is that China will defy Trump on this. But probably China won’t need to make a bid deal over this. Firstly because these new sanctions will either evaporate as all the other threats or be postponed once we get to 21 November. Secondly because the sanctions are explicit towards US persons and companies but only ”may” be enforced versus non-US entities.
Sanctions is not a reduction in global supply of oil. Just some added layer of friction. Anyhow, the new sanctions won’t reduce the supply of Russian crude oil to the market. It will only increase the friction in the market with yet more need for the shadow fleet and ship to ship transfer of Russian oil to dodge the sanctions. If they materialize at all.
The jump in crude oil prices is probably due to redirections of crude purchases to the Mid-East and not because all speculators are now turned bullish. Has oil rallied because all speculators now suddenly have turned bullish? We don’t think so. Brent crude has probably jumped because some Indian and Chinese oil purchasers of have redirected their purchases from Russia towards the Mid-East just in case the sanctions really materializes on 21 November.
Parts of the Brent crude curve dipping into the high $50ies/b. Brent crude fell 2.3% over the week to Friday. It closed the week at $61.29/b, a slight gain on the day, but also traded to a low of $60.14/b that same day and just barely avoided trading into the $50ies/b. This morning it is risk-on in equities which seems to help industrial metals a little higher. But no such luck for oil. It is down 0.8% at $60.8/b. This week looks set for Brent crude to dip its feet in the $50ies/b. The Brent 3mth contract actually traded into the high $50ies/b on Friday.
The front-end backwardation has been on a weakening foot and is now about to fully disappear. The lowest point of the crude oil curve has also moved steadily lower and lower and its discount to the 5yr contract is now $6.8/b. A solid contango. The Brent 3mth contract did actually dip into the $50ies/b intraday on Friday when it traded to a low point of $59.93/b.
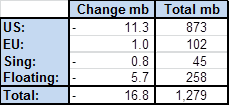
More weakness to come as lots of oil at sea comes to ports. Mid-East OPEC countries have boosted exports along with lower post summer consumption and higher production. The result is highly visibly in oil at sea which increased by 17 mb to 1,311 mb over the week to Sunday. Up 185 mb since mid-August. On its way to discharge at a port somewhere over the coming month or two.
Don’t forget that the oil market path ahead is all down to OPEC+. Remember that what is playing out in the oil market now is all by design by OPEC+. The group has decided that the unwind of the voluntary cuts is what it wants to do. In a combination of meeting demand from consumers as well as taking back market share. But we need to remember that how this plays out going forward is all at the mercy of what OPEC+ decides to do. It will halt the unwinding at some point. It will revert to cuts instead of unwind at some point.
A few months with Brent at $55/b and 40-50 US shale oil rigs kicked out may be what is needed. We think OPEC+ needs to see the exit of another 40-50 drilling rigs in the US shale oil patches to set US shale oil production on a path to of a 1 mb/d year on year decline Dec-25 to Dec-26. We are not there yet. But a 2-3 months period with Brent crude averaging $55/b would probably do it.
Oil on water increased 17 mb over the week to Sunday while oil in transit increased by 23 mb. So less oil was standing still. More was moving.

Crude oil floating storage (stationary more than 7 days). Down 11 mb over week to Sunday

The lowest point of the Brent crude oil curve versus the 5yr contract. Weakest so far this year.

Crude oil 1mth to 3mth time-spreads. Dubai held out strongly through summer, but then that center of strength fell apart in late September and has been leading weakness in crude curves lower since then.

Rebounding along with most markets. But concerns over solidity of Gaza peace may also contribute. Brent crude fell 0.8% yesterday to $61.91/b and its lowest close since May this year. This morning it is bouncing up 0.9% to $62.5/b along with a softer USD amid positive sentiment with both equities and industrial metals moving higher. Concerns that the peace in Gaza may be less solid than what one might hope for also yields some support to Brent. Bets on tech stocks are rebounding, defying fears of trade war. Money moving back into markets. Gold continues upwards its strong trend and a softer dollar helps it higher today as well.
US crude & products probably rose 5.6 mb last week (API) versus a normal seasonal decline of 2.4 mb. The US API last night partial and thus indicative data for US oil inventories. Their data indicates that US crude stocks rose 7.4 mb last week, gasoline stocks rose 3.0 mb while Distillate stocks fell 4.8 mb. Altogether an increase in commercial crude and product stocks of 5.6 mb. Commercial US crude and product stocks normally decline by 2.4 mb this time of year. So seasonally adjusted the US inventories rose 8 mb last week according to the indicative numbers by the API. That is a lot. Also, the counter seasonal trend of rising stocks versus normally declining stocks this time of year looks on a solid pace of continuation. If the API is correct then total US crude and product stocks would stand 41 mb higher than one year ago and 6 mb higher than the 2015-19 average. And if we combine this with our knowledge of a sharp increase in production and exports by OPEC(+) and a large increase in oil at sea, then the current trend in US oil inventories looks set to continue. So higher stocks and lower crude oil prices until OPEC(+) switch to cuts. Actual US oil inventory data today at 18:00 CET.
US commercial crude and product stocks rising to 1293 mb in week 41 if last nights indicative numbers from API are correct.

Crude oil soon coming to a port near you. OPEC has lifted production sharply higher this autumn. At the same time demand for oil in the Middle-East has fallen as we have moved out of summer heat and crude oil burn for power for air-conditioning. The Middle-East oil producers have thus been able to lift exports higher on both accounts. Crude oil and condensates on water has shot up by 177 mb since mid-August. This oil is now on its way to ports around the world. And when they arrive, it will likely help to lift stocks onshore higher. That is probably when we will lose the last bit of front-end backwardation the the crude oil curves. That will help to drive the front-month Brent crude oil price down to the $60/b line and revisit the high $50ies/b. Then the eyes will be all back on OPEC+ when they meet in early November and then again in early December.
Crude oil and condensates at sea have moved straight up by 177 mb since mid-August as OPEC(+) has produced more, consumed less and exported more.


Sell the rally. Trump has become predictable in his unpredictability

Gruvbolaget Boliden överträffade analytikernas förväntningar

Australien och USA investerar 8,5 miljarder USD för försörjningskedja av kritiska mineraler
Brent crude set to dip its feet into the high $50ies/b this week

Vad guldets uppgång egentligen betyder för världen

OPEC+ missar produktionsmål, stöder oljepriserna

Goldman Sachs höjer prognosen för guld, tror priset når 4900 USD

Blykalla och amerikanska Oklo inleder ett samarbete

Guld nära 4000 USD och silver 50 USD, därför kan de fortsätta stiga

Leading Edge Materials är på rätt plats i rätt tid
-
 Nyheter4 veckor sedan
OPEC+ missar produktionsmål, stöder oljepriserna
-
 Nyheter3 veckor sedan
Goldman Sachs höjer prognosen för guld, tror priset når 4900 USD
-
 Nyheter3 veckor sedan
Blykalla och amerikanska Oklo inleder ett samarbete
-
 Nyheter3 veckor sedan
Guld nära 4000 USD och silver 50 USD, därför kan de fortsätta stiga
-
 Nyheter2 veckor sedan
Leading Edge Materials är på rätt plats i rätt tid
-

 Nyheter3 veckor sedan
Nytt prisrekord, guld stiger över 4000 USD
-

 Nyheter3 veckor sedan
Ett samtal om guld, olja, koppar och stål
-
Analys3 veckor sedan
OPEC+ will likely unwind 500 kb/d of voluntary quotas in October. But a full unwind of 1.5 mb/d in one go could be in the cards