

Analys
Oil falling only marginally on weak China data as Iran oil exports starts to struggle

Up 4.7% last week on US Iran hawkishness and China stimulus optimism. Brent crude gained 4.7% last week and closed on a high note at USD 74.49/b. Through the week it traded in a USD 70.92 – 74.59/b range. Increased optimism over China stimulus together with Iran hawkishness from the incoming Donald Trump administration were the main drivers. Technically Brent crude broke above the 50dma on Friday. On the upside it has the USD 75/b 100dma and on the downside it now has the 50dma at USD 73.84. It is likely to test both of these in the near term. With respect to the Relative Strength Index (RSI) it is neither cold nor warm.
Lower this morning as China November statistics still disappointing (stimulus isn’t here in size yet). This morning it is trading down 0.4% to USD 74.2/b following bearish statistics from China. Retail sales only rose 3% y/y and well short of Industrial production which rose 5.4% y/y, painting a lackluster picture of the demand side of the Chinese economy. This morning the Chinese 30-year bond rate fell below the 2% mark for the first time ever. Very weak demand for credit and investments is essentially what it is saying. Implied demand for oil down 2.1% in November and ytd y/y it was down 3.3%. Oil refining slipped to 5-month low (Bloomberg). This sets a bearish tone for oil at the start of the week. But it isn’t really killing off the oil price either except pushing it down a little this morning.
China will likely choose the US over Iranian oil as long as the oil market is plentiful. It is becoming increasingly apparent that exports of crude oil from Iran is being disrupted by broadening US sanctions on tankers according to Vortexa (Bloomberg). Some Iranian November oil cargoes still remain undelivered. Chinese buyers are increasingly saying no to sanctioned vessels. China import around 90% of Iranian crude oil. Looking forward to the Trump administration the choice for China will likely be easy when it comes to Iranian oil. China needs the US much more than it needs Iranian oil. At leas as long as there is plenty of oil in the market. OPEC+ is currently holds plenty of oil on the side-line waiting for room to re-enter. So if Iran goes out, then other oil from OPEC+ will come back in. So there won’t be any squeeze in the oil market and price shouldn’t move all that much up.
Analys
Increasing risk that OPEC+ will unwind the last 1.65 mb/d of cuts when they meet on 7 September
Pushed higher by falling US inventories and positive Jackson Hall signals. Brent crude traded up 2.9% last week to a close of $67.73/b. It traded between $65.3/b and $68.0/b with the low early in the week and the high on Friday. US oil inventory draws together with positive signals from Powel at Jackson Hall signaling that rate cuts are highly likely helped to drive both oil and equities higher.

Ticking higher for a fourth day in a row. Bank holiday in the UK calls for muted European session. Brent crude is inching 0.2% higher this morning to $67.9/b which if it holds will be the fourth trading day in a row with gains. Price action in the European session will likely be quite muted due to bank holiday in the UK today.
OPEC+ is lifting production but we keep waiting for the surplus to show up. The rapid unwinding of voluntary cuts by OPEC+ has placed the market in a waiting position. Waiting for the surplus to emerge and materialize. Waiting for OECD stocks to rise rapidly and visibly. Waiting for US crude and product stocks to rise. Waiting for crude oil forward curves to bend into proper contango. Waiting for increasing supply of medium sour crude from OPEC+ to push sour cracks lower and to push Mid-East sour crudes to increasing discounts to light sweet Brent crude. In anticipation of this the market has traded Brent and WTI crude benchmarks up to $10/b lower than what solely looking at present OECD inventories, US inventories and front-end backwardation would have warranted.
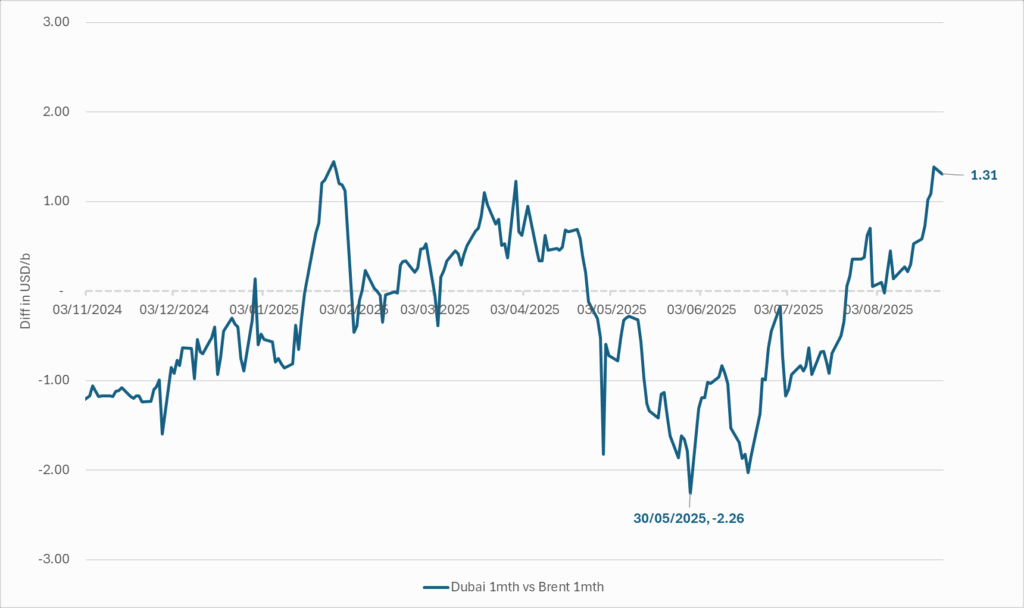
Quite a few pockets of strength. Dubai sour crude is trading at a premium to Brent crude! The front-end of the crude oil curves are still in backwardation. High sulfur fuel oil in ARA has weakened from parity with Brent crude in May, but is still only trading at a discount of $5.6/b to Brent versus a more normal discount of $10/b. ARA middle distillates are trading at a premium of $25/b versus Brent crude versus a more normal $15-20/b. US crude stocks are at the lowest seasonal level since 2018. And lastly, the Dubai sour crude marker is trading a premium to Brent crude (light sweet crude in Europe) as highlighted by Bloomberg this morning. Dubai is normally at a discount to Brent. With more medium sour crude from OPEC+ in general and the Middle East specifically, the widespread and natural expectation has been that Dubai should trade at an increasing discount to Brent. the opposite has happened. Dubai traded at a discount of $2.3/b to Brent in early June. Dubai has since then been on a steady strengthening path versus Brent crude and Dubai is today trading at a premium of $1.3/b. Quite unusual in general but especially so now that OPEC+ is supposed to produce more.
This makes the upcoming OPEC+ meeting on 7 September even more of a thrill. At stake is the next and last layer of 1.65 mb/d of voluntary cuts to unwind. The market described above shows pockets of strength blinking here and there. This clearly increases the chance that OPEC+ decides to unwind the remaining 1.65 mb/d of voluntary cuts when they meet on 7 September to discuss production in October. Though maybe they split it over two or three months of unwind. After that the group can start again with a clean slate and discuss OPEC+ wide cuts rather than voluntary cuts by a sub-group. That paves the way for OPEC+ wide cuts into Q1-26 where a large surplus is projected unless the group kicks in with cuts.
The Dubai medium sour crude oil marker usually trades at a discount to Brent crude. More oil from the Middle East as they unwind cuts should make that discount to Brent crude even more pronounced. Dubai has instead traded steadily stronger versus Brent since late May.
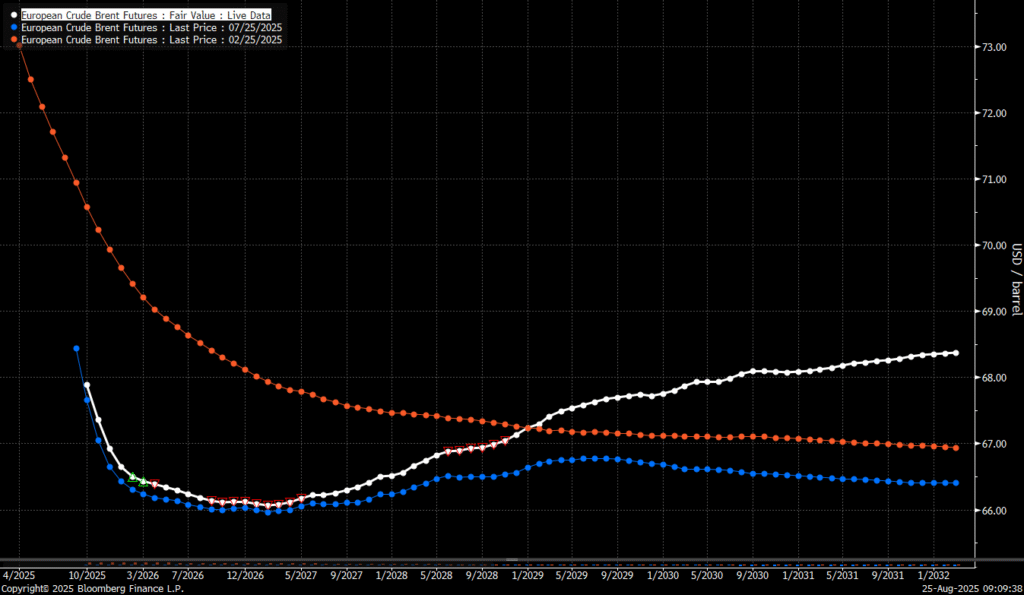
The Brent crude oil forward curve (latest in white) keeps stuck in backwardation at the front end of the curve. I.e. it is still a tight crude oil market at present. The smile-effect is the market anticipation of surplus down the road.
Analys
Brent edges higher as India–Russia oil trade draws U.S. ire and Powell takes the stage at Jackson Hole
Best price since early August. Brent crude gained 1.2% yesterday to settle at USD 67.67/b, the highest close since early August and the second day of gains. Prices traded to an intraday low of USD 66.74/b before closing up on the day. This morning Brent is ticking slightly higher at USD 67.76/b as the market steadies ahead of Fed Chair Jerome Powell’s Jackson Hole speech later today.
No Russia/Ukraine peace in sight and India getting heat from US over imports of Russian oil. Yesterday’s price action was driven by renewed geopolitical tension and steady underlying demand. Stalled ceasefire talks between Russia and Ukraine helped maintain a modest risk premium, while the spotlight turned to India’s continued imports of Russian crude. Trump sharply criticized New Delhi’s purchases, threatening higher tariffs and possible sanctions. His administration has already announced tariff hikes on Indian goods from 25% to 50% later this month. India has pushed back, defending its right to diversify crude sourcing and highlighting that it also buys oil from the U.S. Moscow meanwhile reaffirmed its commitment to supply India, deepening the impression that global energy flows are becoming increasingly politicized.
Holding steady this morning awaiting Powell’s address at Jackson Hall. This morning the main market focus is Powell’s address at Jackson Hole. It is set to be the key event for markets today, with traders parsing every word for signals on the Fed’s policy path. A September rate cut is still the base case but the odds have slipped from almost certainty earlier this month to around three-quarters. Sticky inflation data have tempered expectations, raising the stakes for Powell to strike the right balance between growth concerns and inflation risks. His tone will shape global risk sentiment into the weekend and will be closely watched for implications on the oil demand outlook.
For now, oil is holding steady with geopolitical frictions lending support and macro uncertainty keeping gains in check.
Oil market is starting to think and worry about next OPEC+ meeting on 7 September. While still a good two weeks to go, the next OPEC+ meeting on 7 September will be crucial for the oil market. After approving hefty production hikes in August and September, the question is now whether the group will also unwind the remaining 1.65 million bpd of voluntary cuts. Thereby completing the full phase-out of voluntary reductions well ahead of schedule. The decision will test OPEC+’s balancing act between volume-driven influence and price stability. The gathering on 7 September may give the clearest signal yet of whether the group will pause, pivot, or press ahead.
Brent crude is currently trading around USD 66.2 per barrel, following a relatively tight session on Monday, where prices ranged between USD 65.3 and USD 66.8. While expectations of higher OPEC+ supply continue to weigh on sentiment, recent headlines have been dominated by geopolitics – particularly developments in Washington.

At the center is the White House meeting between Trump, Zelenskyy, and several key European leaders. During the meeting, Trump reportedly placed a direct call to Putin to discuss a potential bilateral sit-down between Putin and Zelenskyy, which several European officials have said could take place within two weeks.
While the Kremlin’s response remains vague, markets have interpreted this as a modestly positive signal, with both equities and global oil prices holding steady. Brent is marginally lower since yesterday’s close, while U.S. and Asian equity markets remain broadly flat.
Still, the political undertone is shifting, and markets may be underestimating the longer-term implications. According to the NY times, Putin has proposed a peace plan under which Russia would claim full control of the Donbas in exchange for dropping demands over Kherson and Zaporizhzhia – territories it has not yet seized.
Meanwhile, discussions around Ukraine’s long-term security framework are starting to take shape. Zelenskyy appeared encouraged by Trump’s openness to supporting a post-war security guarantee for Ukraine. While the exact terms remain unclear, U.S. special envoy Steve Witkoff stated that Putin had signaled willingness to allow Washington and its allies to offer Kyiv a NATO-style collective defense guarantee – a move that would significantly reshape the regional security landscape.
As diplomatic efforts gain momentum, markets are also beginning to assess the potential consequences of a partial or full rollback of U.S. sanctions on Russian energy. Any unwind would likely be gradual and uneven, especially if European allies resist or delay alignment. The U.S. could act unilaterally by loosening financial restrictions, granting Russian firms greater access to Western capital and services, and effectively neutralizing the price cap mechanism. However, the EU embargo on Russian crude and products remains a more immediate constraint on flows – particularly as it continues to tighten.
Even if the U.S. were to ease restrictions, Moscow would remain heavily reliant on buyers like India and China to absorb the majority of its crude exports, as European countries are unlikely to quickly re-engage in energy trade. That shift is already playing out. As India pulls back amid newly doubled U.S. tariffs – a response to its ongoing Russian oil purchases – Chinese refiners have stepped in.
So far in August, Chinese imports of Russia’s Urals crude – typically shipped from Baltic and Black Sea ports – have nearly doubled from the YTD average, with at least two tankers idling off Zhoushan and more reportedly en route (Kpler data). The uptick is driven by attractive pricing and the absence of direct U.S. trade penalties on China, which remains in a delicate tariff truce with Washington.
Indian refiners, by contrast, are notably more cautious – receiving offers but accepting few. The takeaway is clear: China is acting as the buyer of last resort for surplus Russian barrels, likely directing them into strategic storage. While this may temporarily cushion the effects of sanctions relief, it cannot fully offset the constraints imposed by Europe’s ongoing absence.
As a result, any meaningful boost to global supply from a rollback of U.S. sanctions on Russia may take longer to materialize than headlines suggest.


Mahvie Minerals är verksamt i guldrikt område i Finland

Neil Atkinson spår att priset på olja kommer att stiga till 70 USD
Increasing risk that OPEC+ will unwind the last 1.65 mb/d of cuts when they meet on 7 September

Uppgång i oljepriset väntas under hösten enligt den tekniska analysen
Brent edges higher as India–Russia oil trade draws U.S. ire and Powell takes the stage at Jackson Hole

Kopparpriset i fritt fall i USA efter att tullregler presenterats

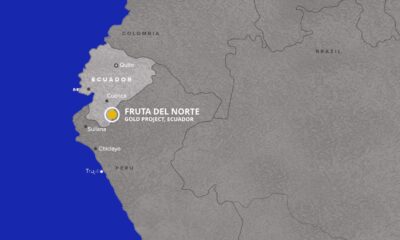
Lundin Gold rapporterar enastående borrresultat vid Fruta del Norte

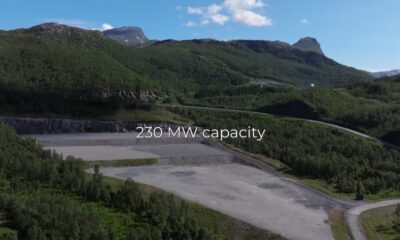
Stargate Norway, AI-datacenter på upp till 520 MW etableras i Narvik

Mängden M1-pengar ökar kraftigt

Omgående mångmiljardfiasko för Equinors satsning på Ørsted och vindkraft
-
 Nyheter4 veckor sedan
Kopparpriset i fritt fall i USA efter att tullregler presenterats
-
 Nyheter4 veckor sedan
Lundin Gold rapporterar enastående borrresultat vid Fruta del Norte
-
 Nyheter4 veckor sedan
Stargate Norway, AI-datacenter på upp till 520 MW etableras i Narvik
-
Nyheter4 veckor sedan
Mängden M1-pengar ökar kraftigt
-
 Nyheter2 veckor sedan
Omgående mångmiljardfiasko för Equinors satsning på Ørsted och vindkraft
-
 Nyheter3 veckor sedan
Lundin Gold hittar ny koppar-guld-fyndighet vid Fruta del Norte-gruvan
-

 Nyheter3 veckor sedan
Guld stiger till över 3500 USD på osäkerhet i världen
-

 Nyheter3 veckor sedan
Alkane Resources och Mandalay Resources har gått samman, aktör inom guld och antimon