

Analys
Market at unease over high Brent specs and OPEC+ 2018 decision but Brent backwardation should attract yet more long Brent specs

 OPEC compliance is back in focus as compliance fell in September to 990 kb/d of cust versus a pledge of 1200 kb/d for the cutters. OPEC’s meeting on November 30th in Vienna thus coming into focus. Market is concernd for oil market balance in 2018 and is starting to feel at unease over whether OPEC+ will cut all through 2018 or not. We think they need to but we also think they will.
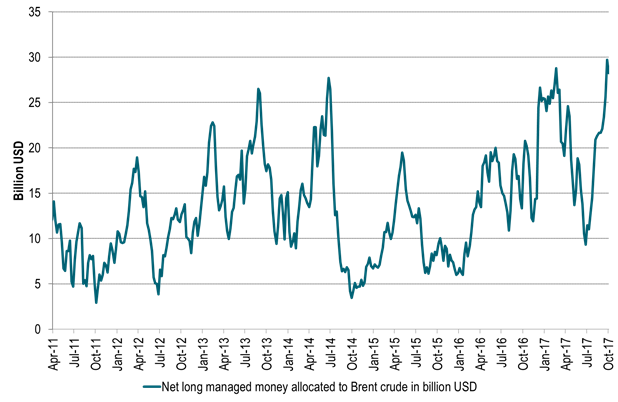
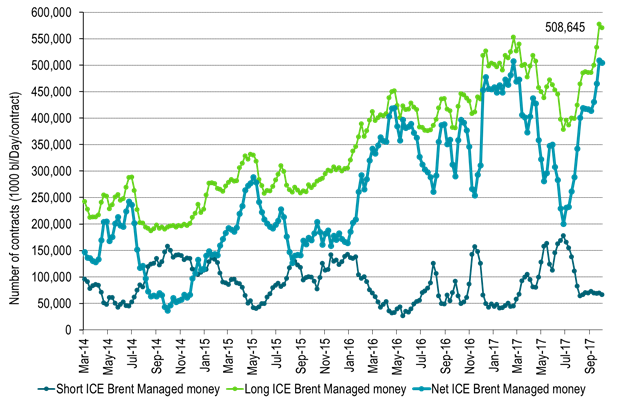
Brent net long managed money reached a record high level the week before last. It fell back only marginally last week. Brent crude is thus at risk to the downside if speculators/investors decides to take yet more money off the table. Thus correction since Brent 1mth reached a new ytd high the week before last may not be over. The general backdrop for Brent does however continue to be positive. The global financial and economic backdrop is positive. Oil inventories continues to decline on the back of strong oil demand growth and cuts by OPEC+ with the result that Brent backwardation should continue to strengthen. Thus even if we see a correction in Brent now driven by speculative money we should see more money heading for Brent long specs going forward. Not less.
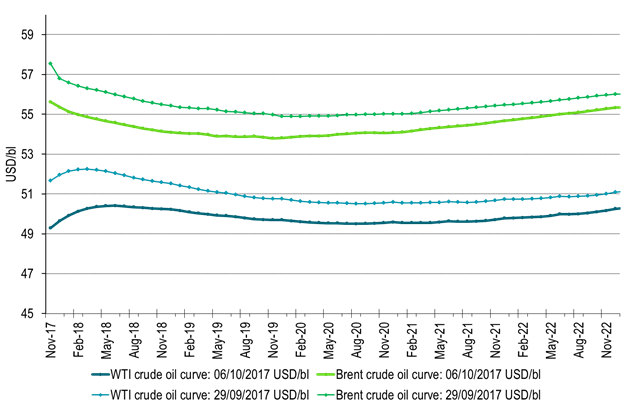
From Friday to Friday the Brent Dec-17 contract lost 2.9% closing the week at $55.62/b. The longer dated contract Brent Dec-2020 lost 1.7% with a close of $54.06/b.
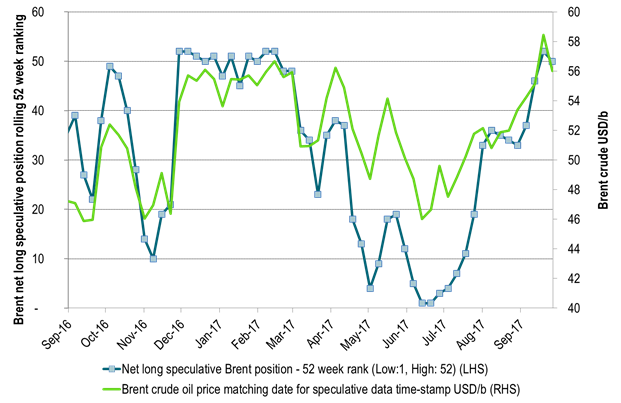
Last week’s sell-off was clearly a continuation of the sell-off that kicked in when Brent crude front month reached a new year to date high the week before last when it printed $59.49/b.
To us the sell-off seems technically driven as a counter reaction to Brent crude front month reaching a new year to date high. Net long Brent speculative positions reached its highest historical level in the week before last (records back to 2011) while it fell back marginally last week. With such high levels it does not take much for a correction to take place.
The general back-drop last week was positive with global equities gaining 1%, industrial metals gaining 2.4% while natural gas and coal gaining 3.8% (ARA coal Dec-18) and 1% (EU gas Q4-18).
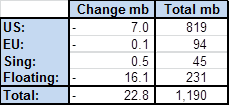
On oil specifics we saw US crude, distillates and gasoline stocks declining 7 mb while global floating storage of crude and products fell 16 mb. In sum there were a lot of supportive winds last week but Brent crude countered it with a continued to sell off as record high specs took money off the table in a technical reaction to the high print of the year in the week before last.
This morning Brent crude has been trading in positive and negative territory but clos to unchanged and undecided.
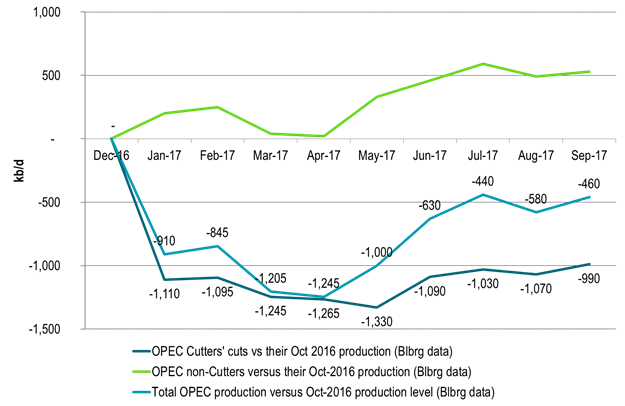
In focus this morning is OPEC compliance for September which fell back slightly from August. The members with pledges delivered a cut of 990 kb/d of in September versus pledges of 1.2 mb/d. The OPEC producers with no obligations to cut have increased production by 530 kb/d (versus their October production). In effect OPEC’s total cuts versus its 2017 October level only amounted to 460 kb/d in September.
This is negative since it not a lot. It is positive since inventories are falling rapidly despite the fact that OPEC in total is not cutting a lot. However, the 990 kb/d held back by the cutters in OPEC in September will move back into the market at some point in time in the future again.
Some concern now is that OPEC’s exports will rise since the peak domestic oil demand in OPEC is behind us. In addition refineries will move off-line for autumn maintenance also reducing off-take for crude. OPEC’s upcoming meeting on Nov 30th is putting the spot light back on the 2018 balance. Will they or won’t they roll cuts beyond 1Q18? In our view it is needed and that view is shared by many. Our view is also that they will roll cuts forward since the magnitude of needed cuts is manageable. However the issue creates unease in the market as we run towards the Nov 30th meeting and proper decision by OPEC (+ Russia etc) some time in 1Q18.
Have we now come to the end of the correction we have seen the last two weeks? Brent speculative positions are still close to record high with room to pull more money off the table. However, the backdrop is still fairly positive as inventories continue to draw down which should be supportive for further strengthening of the backwardation of the Brent crude forward curve which is attractive for long positions.
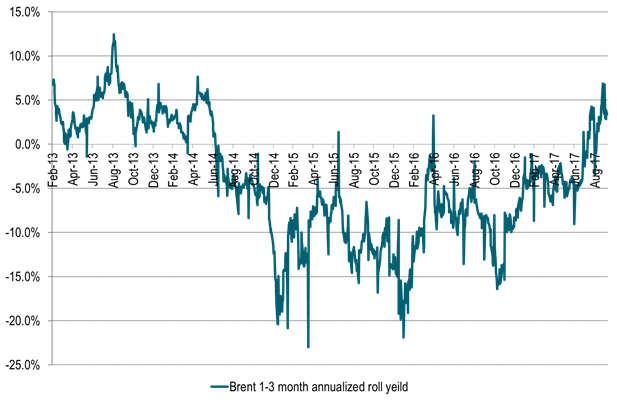
In our view the Backwardation of the Brent crude forward curve is likely to continue to attract yet more money into additional net long speculative positions. This is because the backwardation hands investors/speculators a positive roll yield even if the Brent front month only trades sideways. And as we see in the rest of financial markets there is lots of money chasing yield in a low yield world. Over the past 20 trading days the Brent backwardation measured on the back of the 1-3 mth Brent time spread has averaged an annualized positive roll yield of +3.9%.
Thus despite the fact that net long Brent spec is close to record high we should see more passive money being allocated to Brent long positions. As long as inventories continue to draw down as they currently do with further strengthening of the Brent backwardation. As long as alternative yields around the world is very low as they are. As long as the general global growth outlook looks positive as it does with strong oil demand growth. Yes then we should see more long specs heading to Brent.
The current sell-off may thus not be too deep. The general backdrop is positive. Inventories are declining. Brent backwardation is likely to strengthen further and yet more passive money is likely going to head the Brent long positions.
Ch1: Brent 1-3 mth annualized roll-yield in the positive – Attracting long specs
Passive money likely to continue to roll into long front end Brent positions with a positive roll yield
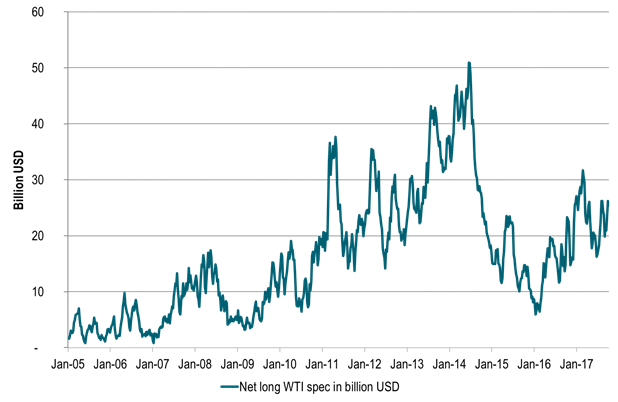
Ch2: WTI oil in dollar allocation still well below prior highs
But the WTI curve is in contango so no rush to enter additional longs there
Ch3: Brent net long allocation recently reached record high of close to USD 30 billion
Thus plenty of room for a pull-back as we have seen the last two weeks
But Brent backwardation is likely to lure yet more passive long allocations to Brent front end contracts
Ch4: Brent net long managed money allocations at uncomfortable high levels
Ch5: Brent net long managed money allocations at uncomfortable high levels
Ch6: OPEC cutters delivered close to promissed cuts even though they inched slightly higher in Sep
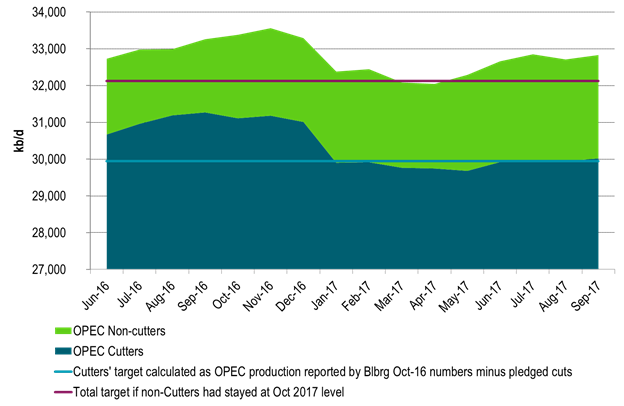
Ch7: OPEC cutters and no-cutters. Net cuts of only 460 kb/d. But cutters deliver close to target
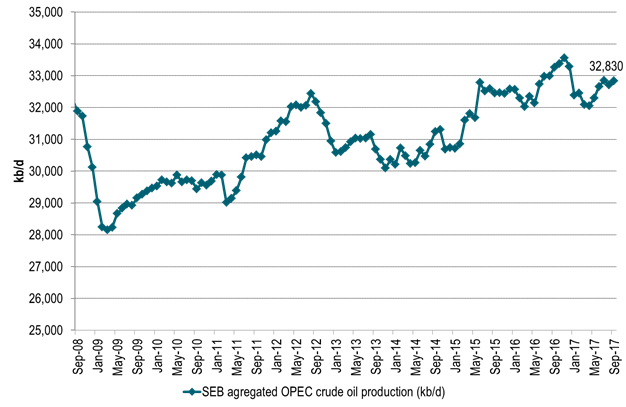
Ch8: OPEC total production. Not cutting all that much. Ytd YoY OPEC’s production is down only 115 kb/d
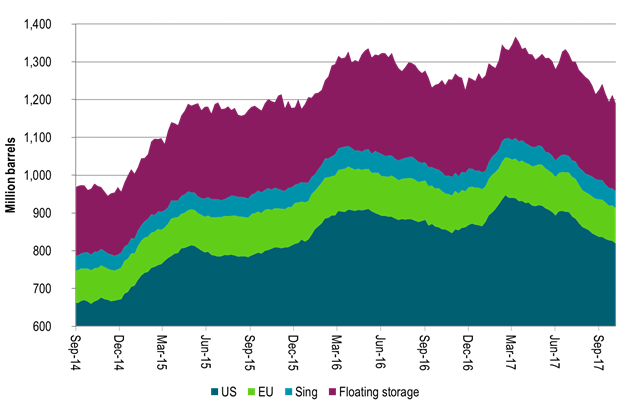
Ch9: Inventories continue to fall in weekly data
Ch10: Crude forward curves. Sell-off along the curve but Brent still in backwardation
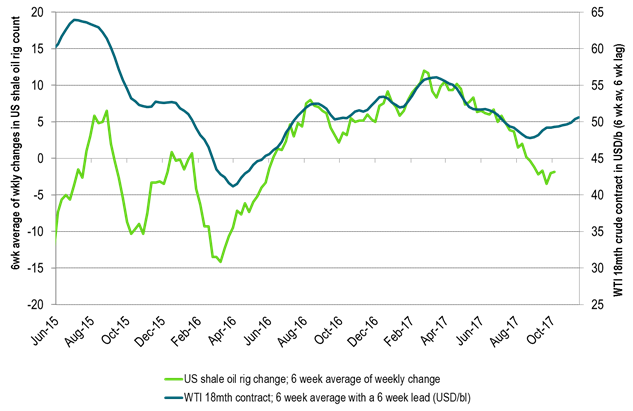
Ch11: US oil rig count down by 2 last week
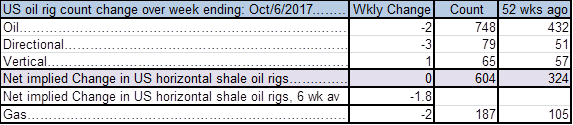
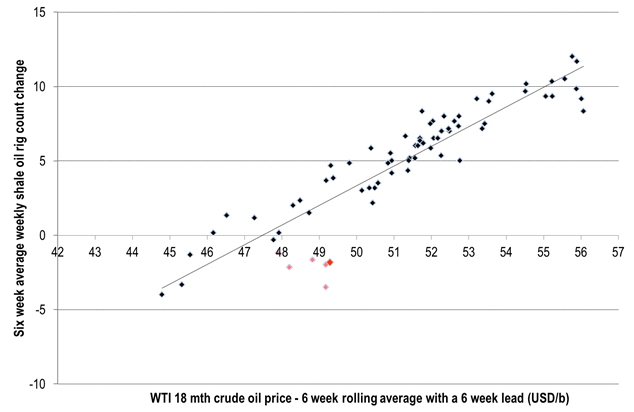
Ch12: US shale oil rigs count change. Price – rig relationship not what it used to be
Kind regards
Bjarne Schieldrop
Chief analyst, Commodities
SEB Markets
Merchant Banking
When it starts to move lower it moves rather quickly. Gaza, China, IEA. Brent crude is down 2.1% today to $62/b after having traded as high as $66.58/b last Thursday and above $70/b in late September. The sell-off follows the truce/peace in Gaze, a flareup in US-China trade and yet another bearish oil outlook from the IEA.

A lasting peace in Gaze could drive crude oil at sea to onshore stocks. A lasting peace in Gaza would probably calm down the Houthis and thus allow more normal shipments of crude oil to sail through the Suez Canal, the Red Sea and out through the Bab-el-Mandeb Strait. Crude oil at sea has risen from 48 mb in April to now 91 mb versus a pre-Covid normal of about 50-60 mb. The rise to 91 mb is probably the result of crude sailing around Africa to be shot to pieces by the Houthis. If sailings were to normalize through the Suez Canal, then it could free up some 40 mb in transit at sea moving onshore into stocks.
The US-China trade conflict is of course bearish for demand if it continues.
Bearish IEA yet again. Getting closer to 2026. Credibility rises. We expect OPEC to cut end of 2025. The bearish monthly report from the IEA is what it is, but the closer we get to 2026, the more likely the IEA is of being ball-park right in its outlook. In its monthly report today the IEA estimates that the need for crude oil from OPEC in 2026 will be 25.4 mb/d versus production by the group in September of 29.1 mb/d. The group thus needs to do some serious cutting at the end of 2025 if it wants to keep the market balanced and avoid inventories from skyrocketing. Given that IEA is correct that is. We do however expect OPEC to implement cuts to avoid a large increase in inventories in Q1-26. The group will probably revert to cuts either at its early December meeting when they discuss production for January or in early January when they discuss production for February. The oil price will likely head yet lower until the group reverts to cuts.
Dubai: The Mid-East anchor dragging crude oil lower. Surplus emerging in Mid-East pricing. Crude oil prices held surprisingly strong all through the summer. A sign and a key source of that strength came from the strength in the front-end backwardation of the Dubai crude oil curve. It held out strong from mid-June and all until late September with an average 1-3mth time-spread premium of $1.8/b from mid-June to end of September. The 1-3mth time-spreads for Brent and WTI however were in steady deterioration from late June while their flat prices probably were held up by the strength coming from the Persian Gulf. Then in late September the strength in the Dubai curve suddenly collapsed. Since the start of October it has been weaker than both the Brent and the WTI curves. The Dubai 1-3mth time-spread now only stands at $0.25/b. The Middle East is now exporting more as it is producing more and also consuming less following elevated summer crude burn for power (Aircon) etc.
The only bear-element missing is a sudden and solid rise in OECD stocks. The only thing that is missing for the bear-case everyone have been waiting for is a solid, visible rise in OECD stocks in general and US oil stocks specifically. So watch out for US API indications tomorrow and official US oil inventories on Thursday.
No sign of any kind of fire-sale of oil from Saudi Arabia yet. To what we can see, Saudi Arabia is not at all struggling to sell its oil. It only lowered its Official Selling Prices (OSPs) to Asia marginally for November. A surplus market + Saudi determination to sell its oil to the market would normally lead to a sharp lowering of Saudi OSPs to Asia. Not yet at least and not for November.
The 5yr contract close to fixed at $68/b. Of importance with respect to how far down oil can/will go. When the oil market moves into a surplus then the spot price starts to trade in a large discount to the 5yr contract. Typically $10-15/b below the 5yr contract on average in bear-years (2009, 2015, 2016, 2020). But the 5yr contract is usually pulled lower as well thus making this approach a moving target. But the 5yr contract price has now been rock solidly been pegged to $68/b since 2022. And in the 2022 bull-year (Brent spot average $99/b), the 5yr contract only went to $72/b on average. If we assume that the same goes for the downside and that 2026 is a bear-year then the 5yr goes to $64/b while the spot is trading at a $10-15/b discount to that. That would imply an average spot price next year of $49-54/b. But that is if OPEC doesn’t revert to cuts and instead keeps production flowing. We think OPEC(+) will trim/cut production as needed into 2026 to prevent a huge build-up in global oil stocks and a crash in prices. But for now we are still heading lower. Into the $50ies/b.
Some rebound but not much. Brent crude rebounded 1.5% yesterday to $65.47/b. This morning it is inching 0.2% up to $65.6/b. The lowest close last week was on Thursday at $64.11/b.
The curve structure is almost as week as it was before the weekend. The rebound we now have gotten post the message from OPEC+ over the weekend is to a large degree a rebound along the curve rather than much strengthening at the front-end of the curve. That part of the curve structure is almost as weak as it was last Thursday.
We are still on a weakening path. The message from OPEC+ over the weekend was we are still on a weakening path with rising supply from the group. It is just not as rapidly weakening as was feared ahead of the weekend when a quota hike of 500 kb/d/mth for November was discussed.
The Brent curve is on its way to full contango with Brent dipping into the $50ies/b. Thus the ongoing weakening we have had in the crude curve since the start of the year, and especially since early June, will continue until the Brent crude oil forward curve is in full contango along with visibly rising US and OECD oil inventories. The front-month Brent contract will then flip down towards the $60/b-line and below into the $50ies/b.
At what point will OPEC+ turn to cuts? The big question then becomes: When will OPEC+ turn around to make some cuts? At what (price) point will they choose to stabilize the market? Because for sure they will. Higher oil inventories, some more shedding of drilling rigs in US shale and Brent into the 50ies somewhere is probably where the group will step in.
There is nothing we have seen from the group so far which indicates that they will close their eyes, let the world drown in oil and the oil price crash to $40/b or below.
The message from OPEC+ is also about balance and stability. The world won’t drown in oil in 2026. The message from the group as far as we manage to interpret it is twofold: 1) Taking back market share which requires a lower price for non-OPEC+ to back off a bit, and 2) Oil market stability and balance. It is not just about 1. Thus fretting about how we are all going to drown in oil in 2026 is totally off the mark by just focusing on point 1.
When to buy cal 2026? Before Christmas when Brent hits $55/b and before OPEC+ holds its last meeting of the year which is likely to be in early December.
Brent crude oil prices have rebounded a bit along the forward curve. Not much strengthening in the structure of the curve. The front-end backwardation is not much stronger today than on its weakest level so far this year which was on Thursday last week.

The front-end backwardation fell to its weakest level so far this year on Thursday last week. A slight pickup yesterday and today, but still very close to the weakest year to date. More oil from OPEC+ in the coming months and softer demand and rising inventories. We are heading for yet softer levels.

Down to the lowest since early May. Brent crude has fallen sharply the latest four days. It closed at USD 64.11/b yesterday which is the lowest since early May. It is staging a 1.3% rebound this morning along with gains in both equities and industrial metals with an added touch of support from a softer USD on top.
What stands out the most to us this week is the collapse in the Dubai one to three months time-spread.
Dubai is medium sour crude. OPEC+ is in general medium sour crude production. Asian refineries are predominantly designed to process medium sour crude. So Dubai is the real measure of the balance between OPEC+ holding back or not versus Asian oil demand for consumption and stock building.
A sharp weakening of the front-end of the Dubai curve. The front-end of the Dubai crude curve has been holding out very solidly throughout this summer while the front-end of the Brent and WTI curves have been steadily softening. But the strength in the Dubai curve in our view was carrying the crude oil market in general. A source of strength in the crude oil market. The core of the strength.
The now finally sharp decline of the front-end of the Dubai crude curve is thus a strong shift. Weakness in the Dubai crude marker is weakness in the core of the oil market. The core which has helped to hold the oil market elevated.
Facts supports the weakening. Add in facts of Iraq lifting production from Kurdistan through Turkey. Saudi Arabia lifting production to 10 mb/d in September (normal production level) and lifting exports as well as domestic demand for oil for power for air con is fading along with summer heat. Add also in counter seasonal rise in US crude and product stocks last week. US oil stocks usually decline by 1.3 mb/week this time of year. Last week they instead rose 6.4 mb/week (+7.2 mb if including SPR). Total US commercial oil stocks are now only 2.1 mb below the 2015-19 seasonal average. US oil stocks normally decline from now to Christmas. If they instead continue to rise, then it will be strongly counter seasonal rise and will create a very strong bearish pressure on oil prices.
Will OPEC+ lift its voluntary quotas by zero, 137 kb/d, 500 kb/d or 1.5 mb/d? On Sunday of course OPEC+ will decide on how much to unwind of the remaining 1.5 mb/d of voluntary quotas for November. Will it be 137 kb/d yet again as for October? Will it be 500 kb/d as was talked about earlier this week? Or will it be a full unwind in one go of 1.5 mb/d? We think most likely now it will be at least 500 kb/d and possibly a full unwind. We discussed this in a not earlier this week: ”500 kb/d of voluntary quotas in October. But a full unwind of 1.5 mb/d”
The strength in the front-end of the Dubai curve held out through summer while Brent and WTI curve structures weakened steadily. That core strength helped to keep flat crude oil prices elevated close to the 70-line. Now also the Dubai curve has given in.

Brent crude oil forward curves

Total US commercial stocks now close to normal. Counter seasonal rise last week. Rest of year?

Total US crude and product stocks on a steady trend higher.


Guld och silver stiger hela tiden mot nya höjder
The Mid-East anchor dragging crude oil lower

Samtal om sällsynta jordartsmetaller, guld och silver

Brookfield köper bränsleceller för 5 miljarder USD av Bloom Energy för att driva AI-datacenter

Teck Resources kan förse Nordamerika och kanske hela G7 med all germanium som behövs

Tyskland har så höga elpriser att företag inte har råd att använda elektricitet

OPEC+ missar produktionsmål, stöder oljepriserna

Ett samtal om guld, olja, fjärrvärme och förnybar energi
Brent crude ticks higher on tension, but market structure stays soft

Guld nära 4000 USD och silver 50 USD, därför kan de fortsätta stiga
-
Nyheter4 veckor sedan
Tyskland har så höga elpriser att företag inte har råd att använda elektricitet
-
 Nyheter3 veckor sedan
OPEC+ missar produktionsmål, stöder oljepriserna
-
 Nyheter3 veckor sedan
Ett samtal om guld, olja, fjärrvärme och förnybar energi
-
Analys4 veckor sedan
Brent crude ticks higher on tension, but market structure stays soft
-
 Nyheter2 veckor sedan
Guld nära 4000 USD och silver 50 USD, därför kan de fortsätta stiga
-
Analys3 veckor sedan
Are Ukraine’s attacks on Russian energy infrastructure working?
-

 Nyheter3 veckor sedan
Guldpriset uppe på nya höjder, nu 3750 USD
-

 Nyheter2 veckor sedan
Blykalla och amerikanska Oklo inleder ett samarbete