

Analys
The long game is the wrong game (from short term intervention to longer term structural battle)

 OPEC yesterday decided to roll existing cuts over for another 9 months lasting all the way to March 2018. Maintaining production cuts also in Q1-18 was however communicated as a measure mainly to avoid driving inventories higher again in the demand wise seasonally weak first quarter of the year. To the surprise of many the market did not take the deal well and Brent crude oil fell $4.6% to a close of the day of $51.46/b with a low of the day of $51.03/b.
In hindsight we can now clearly say that there must have been a substantial amount of anticipation in the market for not only an extension of cuts but also for deeper cuts. Saudi Arabia’s communication to the market ahead of the meeting has clearly been misinterpreted when he stated that OPEC “will do whatever it takes” to draw inventories down to the 5 year average. The market view must have been that what OPEC & Co. did in H1-17 was far from enough. Thus “whatever it takes” should be MORE. Thus the moment Khalid Al-Falih said to reporters in Vienna yesterday at 10:20 CEST that “deeper cuts are not needed”, that was when the oil price started to fall. Long speculative positions which had run hard into the meeting and then instead ran for cover when the oil price started to tumble.
When OPEC launched the cuts last year they were dubbed as a “short term intervention”. Now it increasingly starts to look like a long haul structural battle. We do think that OPEC’s decision to cut will drive inventories down towards normal by the end of the year. Thus yesterday’s decision by OPEC & Co. is in our view making $60/b a sensible target for the front month Brent crude at the end of 2017. Thus as such we think that yesterday’s sell-off should be used as a buying opportunity. At the same time however it is likely leading to another 9 months during which a positive crude oil price signal leads US shale oil production to accelerate yet more.
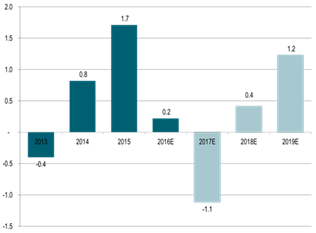
US shale oil production has accelerated massively since November when OPEC & Co. decided to cut production. US crude oil production is now up more than 600 kb/d since the start of December 2016 which is more than the total 558 kb/d in pledged cuts from the 11 countries which have joined OPEC in cutting production at the moment. Their cuts are now basically wiped out. The US shale oil stimulus from the price gains following OPEC’s decision to cut in November has added some 250 shale oil rigs to the market. If we assume that there will not be a single additional US shale oil rig added to the market from July 2017 and all through to the end of 2018 we still expect that US crude oil production will grow by 0.5 mb/d y/y in 2017, 1.5 mb/d y/y in 2018 and by 1 mb/d y/y in 2019. However, as a consequence of the extension of the cuts all until March 2018 we are likely going to see a more supportive oil price and thus yet more US shale oil rigs being added to the market over the coming 9 months of cuts. In our view this is likely going to flip the global supply/demand balance for 2018 and 2019 into surplus.
Thus OPEC is increasingly painting itself into a corner. OPEC’s choice next year will be
1) Roll some cuts forward in both 2018 and 2019 (longer term structural battle) or
2) Put 1.8 mb/d of production cuts (OPEC & Co.) back into the market. Produce at will and let the price regulate the market yet again. I.e. the oil price needs to drop in order to push non-OPEC production lower in order to make room for OPEC & Co’s production revival.
It is often said that generals always fight the previous war meaning that they use tactics and strategy from the last war because that is what they know even if these are outdated. In a way this is what OPEC & Co are doing. In a shale oil world they should have med the cuts quick and dirty. It should definitely have been a short term intervention and not a long term structural battle. In the old days when non-OPEC production solely consisted of conventional oil production with a lead time from investments to production of some 5 years then gradual, enduring cuts did work. Now however keeping cuts going just leaves US shale oil producers all the time in the world to respond and revive. Rather than OPEC & Co cutting 1.8 mb/d for a full 5 quarters (2017 + Q1-18) they should rather have cut production by 3 mb/d for one quarter. That would have left little time for US shale oil players to ramp up investments and thus have limited the cumulative production impact on 2018 and 2019.
At yesterday’s meeting they should have decided massive cuts in Q3-17 and then no more. That would have been the right medicine for the market. Draw down the inventories in a flash. No lengthy time for US shale oil producers to revive and voila, inventories down to normal. A flat or backwardated crude oil forward curve where the mid-term WTI forward curve could be kept in check from there onwards.
It is still not too late for Saudi Arabia to follow this kind of strategy. They have basically promised what they are going to produce over the next 9 months. They could possibly do all of it in Q3-17. Rather than placing production at 10.06 mb/d for 9 months (a cut of 486 kb/d) they could instead produce 9.07 mb/d for the three months in Q3-17 which would mean a cut of 1.458 kb/d versus its October 2017 level. That would have drawn the inventories down by an additional 90 mb in Q3-17. At the same time Saudi Arabia should sell a comparable amount of volumes on a forward basis 2018 and 2019. This would help to prevent the medium term forward curve from rising. Thus again limiting the price signals and hedging opportunities for US shale oil producers.
Khalid Al-Falih has said that US shale oil producers are not the enemy. He welcomes their production revival. However, it still needs to be managed in the right way. At least as long as OPEC & Co is trying to manage the market. And the right way in our view is quick and dirty cuts. Do it all in one go rather than extended and do manage the price level of the mid-term forward crude oil prices.
JPM this morning cut its 2018 Brent crude oil price outlook to $45/b. That is great news for OPEC & Co because it will help to hold price expectations low for 2018 and 2019 and thus help to keep the mid-term forward crude prices in check and thus help to limit the positive price signals to US shale oil producers and thus limit further strong additions and activations of rigs.
As of now however the picture is for a lengthy nine months of additional production cuts and thus more US shale oil rigs being activated driving both 2018 and 2019 into surplus. As such there is increasing concern in the market for the exit from cuts. It is easy to take 1.8 mb/d off the market (1.2 mb/d for OPEC and 0.6 for Co.). With further revival of US shale oil it will be increasingly difficult to put the volumes back into the market again. An exit strategy was not discussed at the OPEC meeting. “We will cross that bridge when we get there” was Khalid Al-Falih’s comment. The market is worried however that come April 2018 then OPEC & Co moves back to “produce at will”. If that was the case following 5 quarters of US shale oil stimulating production cuts from OPEC & Co that would mean that the front month Brent crude oil price probably would have to move down to $35/b in order to slow down US shale oil production again.
With increasingly a surplus becoming the likely outlook for 2018 and 2019 (due to nine more months of cuts) the price outlook for these years increasingly becomes tied to OPEC & Co’s strategy of rolling cuts yet further down the road or not.
For now we are positive to oil prices for the rest of the year in 2017 where we expect OECD inventories at normal level at the end of 2017 with the Brent crude curve moving into backwardation with the front end contract standing at $60/b. We then expect the market price structure to be as follows. The WTI 18 month contract standing at $52.5/b. The Brent crude 18 month contract standing at a $2.5/b premium at $55/b and lastly the front month Brent crude oil contract having a $5/b premium backwardation the 18 months contract thus placing Brent crude front month contract at $60/b at year end 2017.
We are however increasingly concerned about the oil market balance and thus oil prices in 2018 and 2019. The fact that Algeria’s Energy Minister, Noureddine Bouterfa, was replaced in a minister re-shuffle yesterday is concerning. He was at the heart of last year’s negotiations. He was the oil diplomat which criss-crossed between OPEC and non-OPEC members to make the production cut deal last year happen. Thus losing him as oil minister is probably not a good thing with respect to further cuts beyond March 2018.
Global supply/demand oil market balance:
This is what OPEC hopes for:
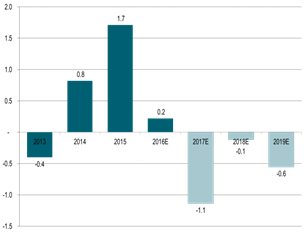
This is however probably what they might get:
Kind regards
Bjarne Schieldrop
Chief analyst, Commodities
SEB Markets
Merchant Banking
Market is starting to take US/Iran headlines with a pinch of salt. Brent crude rose $2.8/b yesterday to an official close of $112.1/b. But after that it traded as low as $108.05/b before ending late night at around $109.7/b. Through the day it traded in a range of $106.87 – 112.72/b amid a flurry of news or rumors from Iran and the US. ”US temporary sanctions during negotiations” (falls alarm). ”We will bomb Iran” (not anyhow),… etc. While the market is still fluctuating to this kind of news flow, it is starting to take such headlines with a pinch of salt.

We’ll see. Maybe, maybe not. The Brent M1 contract is trading at $110.2/b this morning which very close to the average ticks through yesterday of $110.4/b.
Trump with bearish, verbal intervention whenever Brent trades above $110/b it seems. What seems to be a pattern is that Trump states something like ”very good negotiations going on with Iran”, ”New leaders in Iran are great,..”, ”Great progress in negotiations,…”, ”Deal in sight,..” etc whenever the Brent M1 contract trades above $110/b. An effort to cool the market. These hot air verbal interventions from Trump used to have a heavy bearish impact on prices, but they now seems to have less and less effect unless they are backed by reality.
As far as we can see there has been no real progress in the negotiations between the US and Iran with both sides still standing by their previous demands.
Iran is getting stronger while the cease fire lasts making a return to war for Trump yet harder. Iran is naturally in constant preparation for a return to war given Trump’s steady threats of bombing Iran again. Iran is naturally doing what ever is possible to prepare for a return to war. And every day the cease fire lasts it is better prepared. This naturally makes it more and more difficult and dangerous for the US to return to warring activity versus Iran as the consequences for energy infrastructure in the Persian Gulf will be more and more severe the longer the cease fire lasts. Israel seems to see it this way as well. That the war is not won and that current frozen state of a cease fire gives Iran opportunity to rebuild military and politically.
Global inventories are drawing down day by day. How much? In the meantime the Strait of Hormuz stays closed. There is varying measures and estimates of how much global inventories are drawing down. Our rough estimate, back of the envelope, is that global inventories are drawing down by at least some 10 mb/d or about 300 mb/d in a balance between loss of supply versus demand destruction. Other estimates we see are a monthly draw of 250-270 mb/d. The IEA only ’measured’ a draw in global observable stocks of 117 mb in April with oil on water rising 53 mb while on shore stocks fell 170 mb. But global stocks are hard to measure with large invisible, unmeasured stocks. As such a back of the envelope approach may be better.
Oil products is what the world is consuming. Oil product prices likely to rise while product stocks fall. Strategic Petroleum Reserves (SPR) are predominantly crude oil. Discharging oil from OECD SPR stocks, a sharp reduction in Chinese crude imports and a reduction in global refinery throughput of 6-7 mb/d has helped to keep crude oil markets satisfactorily supplied. But global inventories are drawing down none the less. And oil products is really what the world is consuming. So if global refinery throughput stays subdued, then demand will eventually have to match the supply of oil products. The likely path forward this summer is a steady draw down in jet fuel, diesel and gasoline. Higher prices for these. Then, if possible, higher refinery throughput and higher usage of crude in response to very profitable refinery margins. And lastly sharper draw in crude stocks and higher prices for these. But some 6 mb/d of oil products used to be exported through the Strait of Hormuz. And it may not be so easy to ramp up refinery activity across the world to compensate. Especially as Ukraine continues to damage Russian refineries as well as Russian crude production and export facilities.
Watch oil product stocks and prices as well as Brent calendar 2027. What to watch for this summer is thus oil product inventories falling and oil product premiums to crude rising. Another measure to watch is the Brent crude 2027 contract as it rises steadily day by day as the Strait of Hormuz stays closed and global oil inventories decline. The latter is close to the highest level since the start of the war and keeps rising.
The Brent M1 contract and the Brent 2027 prices and current price of jet fuel in Europe (ARA). All in USD/b

Our back of the envelope calculation of the global shortage created by the closure of the Strait of Hormuz. Note that 3.5 mb/d of discharge from SPR is also a draw. Note also that ’Forced demand loss’ of 2.5 mb/d is probably temporary and will fall back towards zero as logistics are sorted out leaving ’Price demand loss’ to do the job of balancing the market. Thus a shortfall of at least 9 mb/d created by the closure. More if SPR discharge is included and more if Forced demand loss recedes.

Brent is climbing higher. Front-month is at USD 106.3/bl this morning, close to a weekly high and a USD 9/bl jump from Mondays open. This is the move we flagged as a risk earlier in the week: the market shifting from ”a deal is around the corner” to ”this is going to take longer than we thought”.

Analyst Commodities, SEB
During April, rest-of-year Brent remained remarkably stable around USD 90/bl. A stability which rested on one single assumption: the SoH reopens around 1 May. That assumption is now slowly falling apart.
As we highlighted yesterday: every week of delay beyond 1 May adds (theoretically) ish USD 5/bl to the rest-of-year average, as global inventories draw 100 million barrels per week. i.e., a mid-May reopening implies rest-of-year Brent closer to USD 100/bl, and anything pushing into June or July takes us meaningfully higher.
What’s changed in the last 48 hours:
#1: The US military has formally warned that clearing suspected sea mines from SoH could take up to six months. That is a completely different timescale from what the financial market is pricing. Even a political deal tomorrow does not immediately reopen the strait.
#2: Trump has shifted his tone from urgency to ”strategic patience”. In yesterday’s press conference: ”Don’t rush me… I want a great deal.” The market is reading this as a president no longer feeling pressured by timelines, with the naval blockade running in the background.
#3: So far, the military activity is escalating, not de-escalating. Axios reports Iran is laying more mines in SoH. The US 3rd carrier strike group (USS George H.W. Bush) is arriving with two countermine vessels. Trump yesterday ordered the US Navy to destroy any Iranian boats caught laying mines. While CNN reports that the Pentagon is actively drawing up plans to strike Iranian SoH capabilities and individual Iranian military leaders if the ceasefire collapses. i.e., NOT a attitude consistent with an imminent deal!
Spot crude and product prices eased off the early-April highs on a combination of system rerouting and deal optimism. Both now weakening. Goldman estimates April Gulf output is reduced by 14.5 mbl/d, or 57% of pre-war supply, a number that keeps getting worse the longer this drags on.
Demand-side adaptation is ongoing: S. Korea has cut its Middle East crude dependence from 69% to 56% by pulling more from the Americas and Africa, and Japan is kicking off a second round of SPR releases from 1 May. But SPRs are finite.
Ref. to the negotiations, we should not bet on speed. The current Iranian leadership is dominated by genuine hardliners willing to absorb economic pain and run the clock to extract concessions. That is not a setup for a rapid resolution. US/Israeli media briefings keep framing the delay as ”internal Iranian divisions”, the reality is more complicated and points toward weeks and months, not days.
Our point is that the complexity is large, and higher prices have only just started (given a scenario where the negotiations drag out in time). The market spent April leaning on the USD 90/bl rest-of-year assumption; that case is diminishing by the hour. If ”early May reopening” is replaced by ”June, July or later” over the next week or two, both crude and products have meaningful room to reprice higher from here. There is a high risk being short energy and betting on any immediate political resolution(!).
Down on Friday. Up on Monday. The Brent June crude oil contract traded down 5.1% last week to a close of $90.38/b. It reached a high of $103.87/b last Monday and a low of $86.09/b on Friday as Iran announced that the Strait of Hormuz was fully open for transit. That quickly changed over the weekend as the US upheld its blockade of Iranian oil exports while Iran naturally responded by closing the SoH again. The US blew a hole in the engine room of the Iranian ship TOUSKA and took custody of the ship on Sunday. Brent crude is up 5.6% this morning to $95.4/b.
The cease-fire is expiring tomorrow. The US has said it will send a delegation for a second round of negotiations in Islamabad in Pakistan. But Iran has for now rejected a second round of talks as it views US demands as unrealistic and excessive while the US is also blocking the Strait of Hormuz.
While Brent is up 5% this morning, the financial market is still very optimistic that progress will be made. That talks will continue and that the SoH will fully open by the start of May which is consistent with a rest-of-year average Brent crude oil price of around $90/b with the market now trading that balance at around $88/b.
Financial optimism vs. physical deterioration. We have a divergence where the financial market is trading negotiations, improvements and resolution while at the same time the physical market is deteriorating day by day. Physical oil flows remain constrained by disrupted flows, longer voyage times and elevated freight and insurance costs.
Financial markets are betting that a US/Iranian resolution will save us in time from violent shortages down the road. But every day that the SoH remains closed is bringing us closer to a potentially very painful point of shortages and much higher prices.
The US blockade is also a weapon of leverage against its European and Asian allies. When Iran closed the SoH it held the world economy as a hostage against the US. The US blockade of the SoH is of course blocking Iranian oil exports. But it is also an action of disruption directed towards Europe and Asia. The US has called for the rest of the world to engaged in the war with Iran: ”If you want oil from the Persian Gulf, then go and get it”. A risk is that the US plays brinkmanship with the global oil market directed towards its European and Asian allies and maybe even towards China to force them to engage and take part. Maybe unthinkable. But unthinkable has become the norm with Trump in the White House.


Oil product price pain is set to rise as the Strait of Hormuz stays closed into summer

Solkraften pressar elpriserna dagtid

Michel Gubel ger sin syn på oljemarknaden


