

Analys
The long game is the wrong game (from short term intervention to longer term structural battle)

 OPEC yesterday decided to roll existing cuts over for another 9 months lasting all the way to March 2018. Maintaining production cuts also in Q1-18 was however communicated as a measure mainly to avoid driving inventories higher again in the demand wise seasonally weak first quarter of the year. To the surprise of many the market did not take the deal well and Brent crude oil fell $4.6% to a close of the day of $51.46/b with a low of the day of $51.03/b.
In hindsight we can now clearly say that there must have been a substantial amount of anticipation in the market for not only an extension of cuts but also for deeper cuts. Saudi Arabia’s communication to the market ahead of the meeting has clearly been misinterpreted when he stated that OPEC “will do whatever it takes” to draw inventories down to the 5 year average. The market view must have been that what OPEC & Co. did in H1-17 was far from enough. Thus “whatever it takes” should be MORE. Thus the moment Khalid Al-Falih said to reporters in Vienna yesterday at 10:20 CEST that “deeper cuts are not needed”, that was when the oil price started to fall. Long speculative positions which had run hard into the meeting and then instead ran for cover when the oil price started to tumble.
When OPEC launched the cuts last year they were dubbed as a “short term intervention”. Now it increasingly starts to look like a long haul structural battle. We do think that OPEC’s decision to cut will drive inventories down towards normal by the end of the year. Thus yesterday’s decision by OPEC & Co. is in our view making $60/b a sensible target for the front month Brent crude at the end of 2017. Thus as such we think that yesterday’s sell-off should be used as a buying opportunity. At the same time however it is likely leading to another 9 months during which a positive crude oil price signal leads US shale oil production to accelerate yet more.
US shale oil production has accelerated massively since November when OPEC & Co. decided to cut production. US crude oil production is now up more than 600 kb/d since the start of December 2016 which is more than the total 558 kb/d in pledged cuts from the 11 countries which have joined OPEC in cutting production at the moment. Their cuts are now basically wiped out. The US shale oil stimulus from the price gains following OPEC’s decision to cut in November has added some 250 shale oil rigs to the market. If we assume that there will not be a single additional US shale oil rig added to the market from July 2017 and all through to the end of 2018 we still expect that US crude oil production will grow by 0.5 mb/d y/y in 2017, 1.5 mb/d y/y in 2018 and by 1 mb/d y/y in 2019. However, as a consequence of the extension of the cuts all until March 2018 we are likely going to see a more supportive oil price and thus yet more US shale oil rigs being added to the market over the coming 9 months of cuts. In our view this is likely going to flip the global supply/demand balance for 2018 and 2019 into surplus.
Thus OPEC is increasingly painting itself into a corner. OPEC’s choice next year will be
1) Roll some cuts forward in both 2018 and 2019 (longer term structural battle) or
2) Put 1.8 mb/d of production cuts (OPEC & Co.) back into the market. Produce at will and let the price regulate the market yet again. I.e. the oil price needs to drop in order to push non-OPEC production lower in order to make room for OPEC & Co’s production revival.
It is often said that generals always fight the previous war meaning that they use tactics and strategy from the last war because that is what they know even if these are outdated. In a way this is what OPEC & Co are doing. In a shale oil world they should have med the cuts quick and dirty. It should definitely have been a short term intervention and not a long term structural battle. In the old days when non-OPEC production solely consisted of conventional oil production with a lead time from investments to production of some 5 years then gradual, enduring cuts did work. Now however keeping cuts going just leaves US shale oil producers all the time in the world to respond and revive. Rather than OPEC & Co cutting 1.8 mb/d for a full 5 quarters (2017 + Q1-18) they should rather have cut production by 3 mb/d for one quarter. That would have left little time for US shale oil players to ramp up investments and thus have limited the cumulative production impact on 2018 and 2019.
At yesterday’s meeting they should have decided massive cuts in Q3-17 and then no more. That would have been the right medicine for the market. Draw down the inventories in a flash. No lengthy time for US shale oil producers to revive and voila, inventories down to normal. A flat or backwardated crude oil forward curve where the mid-term WTI forward curve could be kept in check from there onwards.
It is still not too late for Saudi Arabia to follow this kind of strategy. They have basically promised what they are going to produce over the next 9 months. They could possibly do all of it in Q3-17. Rather than placing production at 10.06 mb/d for 9 months (a cut of 486 kb/d) they could instead produce 9.07 mb/d for the three months in Q3-17 which would mean a cut of 1.458 kb/d versus its October 2017 level. That would have drawn the inventories down by an additional 90 mb in Q3-17. At the same time Saudi Arabia should sell a comparable amount of volumes on a forward basis 2018 and 2019. This would help to prevent the medium term forward curve from rising. Thus again limiting the price signals and hedging opportunities for US shale oil producers.
Khalid Al-Falih has said that US shale oil producers are not the enemy. He welcomes their production revival. However, it still needs to be managed in the right way. At least as long as OPEC & Co is trying to manage the market. And the right way in our view is quick and dirty cuts. Do it all in one go rather than extended and do manage the price level of the mid-term forward crude oil prices.
JPM this morning cut its 2018 Brent crude oil price outlook to $45/b. That is great news for OPEC & Co because it will help to hold price expectations low for 2018 and 2019 and thus help to keep the mid-term forward crude prices in check and thus help to limit the positive price signals to US shale oil producers and thus limit further strong additions and activations of rigs.
As of now however the picture is for a lengthy nine months of additional production cuts and thus more US shale oil rigs being activated driving both 2018 and 2019 into surplus. As such there is increasing concern in the market for the exit from cuts. It is easy to take 1.8 mb/d off the market (1.2 mb/d for OPEC and 0.6 for Co.). With further revival of US shale oil it will be increasingly difficult to put the volumes back into the market again. An exit strategy was not discussed at the OPEC meeting. “We will cross that bridge when we get there” was Khalid Al-Falih’s comment. The market is worried however that come April 2018 then OPEC & Co moves back to “produce at will”. If that was the case following 5 quarters of US shale oil stimulating production cuts from OPEC & Co that would mean that the front month Brent crude oil price probably would have to move down to $35/b in order to slow down US shale oil production again.
With increasingly a surplus becoming the likely outlook for 2018 and 2019 (due to nine more months of cuts) the price outlook for these years increasingly becomes tied to OPEC & Co’s strategy of rolling cuts yet further down the road or not.
For now we are positive to oil prices for the rest of the year in 2017 where we expect OECD inventories at normal level at the end of 2017 with the Brent crude curve moving into backwardation with the front end contract standing at $60/b. We then expect the market price structure to be as follows. The WTI 18 month contract standing at $52.5/b. The Brent crude 18 month contract standing at a $2.5/b premium at $55/b and lastly the front month Brent crude oil contract having a $5/b premium backwardation the 18 months contract thus placing Brent crude front month contract at $60/b at year end 2017.
We are however increasingly concerned about the oil market balance and thus oil prices in 2018 and 2019. The fact that Algeria’s Energy Minister, Noureddine Bouterfa, was replaced in a minister re-shuffle yesterday is concerning. He was at the heart of last year’s negotiations. He was the oil diplomat which criss-crossed between OPEC and non-OPEC members to make the production cut deal last year happen. Thus losing him as oil minister is probably not a good thing with respect to further cuts beyond March 2018.
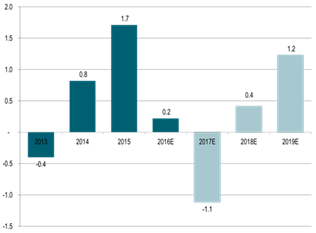
Global supply/demand oil market balance:
This is what OPEC hopes for:
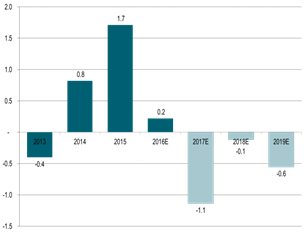
This is however probably what they might get:
Kind regards
Bjarne Schieldrop
Chief analyst, Commodities
SEB Markets
Merchant Banking
Rebounding along with most markets. But concerns over solidity of Gaza peace may also contribute. Brent crude fell 0.8% yesterday to $61.91/b and its lowest close since May this year. This morning it is bouncing up 0.9% to $62.5/b along with a softer USD amid positive sentiment with both equities and industrial metals moving higher. Concerns that the peace in Gaza may be less solid than what one might hope for also yields some support to Brent. Bets on tech stocks are rebounding, defying fears of trade war. Money moving back into markets. Gold continues upwards its strong trend and a softer dollar helps it higher today as well.

US crude & products probably rose 5.6 mb last week (API) versus a normal seasonal decline of 2.4 mb. The US API last night partial and thus indicative data for US oil inventories. Their data indicates that US crude stocks rose 7.4 mb last week, gasoline stocks rose 3.0 mb while Distillate stocks fell 4.8 mb. Altogether an increase in commercial crude and product stocks of 5.6 mb. Commercial US crude and product stocks normally decline by 2.4 mb this time of year. So seasonally adjusted the US inventories rose 8 mb last week according to the indicative numbers by the API. That is a lot. Also, the counter seasonal trend of rising stocks versus normally declining stocks this time of year looks on a solid pace of continuation. If the API is correct then total US crude and product stocks would stand 41 mb higher than one year ago and 6 mb higher than the 2015-19 average. And if we combine this with our knowledge of a sharp increase in production and exports by OPEC(+) and a large increase in oil at sea, then the current trend in US oil inventories looks set to continue. So higher stocks and lower crude oil prices until OPEC(+) switch to cuts. Actual US oil inventory data today at 18:00 CET.
US commercial crude and product stocks rising to 1293 mb in week 41 if last nights indicative numbers from API are correct.

Crude oil soon coming to a port near you. OPEC has lifted production sharply higher this autumn. At the same time demand for oil in the Middle-East has fallen as we have moved out of summer heat and crude oil burn for power for air-conditioning. The Middle-East oil producers have thus been able to lift exports higher on both accounts. Crude oil and condensates on water has shot up by 177 mb since mid-August. This oil is now on its way to ports around the world. And when they arrive, it will likely help to lift stocks onshore higher. That is probably when we will lose the last bit of front-end backwardation the the crude oil curves. That will help to drive the front-month Brent crude oil price down to the $60/b line and revisit the high $50ies/b. Then the eyes will be all back on OPEC+ when they meet in early November and then again in early December.
Crude oil and condensates at sea have moved straight up by 177 mb since mid-August as OPEC(+) has produced more, consumed less and exported more.

When it starts to move lower it moves rather quickly. Gaza, China, IEA. Brent crude is down 2.1% today to $62/b after having traded as high as $66.58/b last Thursday and above $70/b in late September. The sell-off follows the truce/peace in Gaze, a flareup in US-China trade and yet another bearish oil outlook from the IEA.
A lasting peace in Gaze could drive crude oil at sea to onshore stocks. A lasting peace in Gaza would probably calm down the Houthis and thus allow more normal shipments of crude oil to sail through the Suez Canal, the Red Sea and out through the Bab-el-Mandeb Strait. Crude oil at sea has risen from 48 mb in April to now 91 mb versus a pre-Covid normal of about 50-60 mb. The rise to 91 mb is probably the result of crude sailing around Africa to be shot to pieces by the Houthis. If sailings were to normalize through the Suez Canal, then it could free up some 40 mb in transit at sea moving onshore into stocks.
The US-China trade conflict is of course bearish for demand if it continues.
Bearish IEA yet again. Getting closer to 2026. Credibility rises. We expect OPEC to cut end of 2025. The bearish monthly report from the IEA is what it is, but the closer we get to 2026, the more likely the IEA is of being ball-park right in its outlook. In its monthly report today the IEA estimates that the need for crude oil from OPEC in 2026 will be 25.4 mb/d versus production by the group in September of 29.1 mb/d. The group thus needs to do some serious cutting at the end of 2025 if it wants to keep the market balanced and avoid inventories from skyrocketing. Given that IEA is correct that is. We do however expect OPEC to implement cuts to avoid a large increase in inventories in Q1-26. The group will probably revert to cuts either at its early December meeting when they discuss production for January or in early January when they discuss production for February. The oil price will likely head yet lower until the group reverts to cuts.
Dubai: The Mid-East anchor dragging crude oil lower. Surplus emerging in Mid-East pricing. Crude oil prices held surprisingly strong all through the summer. A sign and a key source of that strength came from the strength in the front-end backwardation of the Dubai crude oil curve. It held out strong from mid-June and all until late September with an average 1-3mth time-spread premium of $1.8/b from mid-June to end of September. The 1-3mth time-spreads for Brent and WTI however were in steady deterioration from late June while their flat prices probably were held up by the strength coming from the Persian Gulf. Then in late September the strength in the Dubai curve suddenly collapsed. Since the start of October it has been weaker than both the Brent and the WTI curves. The Dubai 1-3mth time-spread now only stands at $0.25/b. The Middle East is now exporting more as it is producing more and also consuming less following elevated summer crude burn for power (Aircon) etc.
The only bear-element missing is a sudden and solid rise in OECD stocks. The only thing that is missing for the bear-case everyone have been waiting for is a solid, visible rise in OECD stocks in general and US oil stocks specifically. So watch out for US API indications tomorrow and official US oil inventories on Thursday.
No sign of any kind of fire-sale of oil from Saudi Arabia yet. To what we can see, Saudi Arabia is not at all struggling to sell its oil. It only lowered its Official Selling Prices (OSPs) to Asia marginally for November. A surplus market + Saudi determination to sell its oil to the market would normally lead to a sharp lowering of Saudi OSPs to Asia. Not yet at least and not for November.
The 5yr contract close to fixed at $68/b. Of importance with respect to how far down oil can/will go. When the oil market moves into a surplus then the spot price starts to trade in a large discount to the 5yr contract. Typically $10-15/b below the 5yr contract on average in bear-years (2009, 2015, 2016, 2020). But the 5yr contract is usually pulled lower as well thus making this approach a moving target. But the 5yr contract price has now been rock solidly been pegged to $68/b since 2022. And in the 2022 bull-year (Brent spot average $99/b), the 5yr contract only went to $72/b on average. If we assume that the same goes for the downside and that 2026 is a bear-year then the 5yr goes to $64/b while the spot is trading at a $10-15/b discount to that. That would imply an average spot price next year of $49-54/b. But that is if OPEC doesn’t revert to cuts and instead keeps production flowing. We think OPEC(+) will trim/cut production as needed into 2026 to prevent a huge build-up in global oil stocks and a crash in prices. But for now we are still heading lower. Into the $50ies/b.
Some rebound but not much. Brent crude rebounded 1.5% yesterday to $65.47/b. This morning it is inching 0.2% up to $65.6/b. The lowest close last week was on Thursday at $64.11/b.
The curve structure is almost as week as it was before the weekend. The rebound we now have gotten post the message from OPEC+ over the weekend is to a large degree a rebound along the curve rather than much strengthening at the front-end of the curve. That part of the curve structure is almost as weak as it was last Thursday.
We are still on a weakening path. The message from OPEC+ over the weekend was we are still on a weakening path with rising supply from the group. It is just not as rapidly weakening as was feared ahead of the weekend when a quota hike of 500 kb/d/mth for November was discussed.
The Brent curve is on its way to full contango with Brent dipping into the $50ies/b. Thus the ongoing weakening we have had in the crude curve since the start of the year, and especially since early June, will continue until the Brent crude oil forward curve is in full contango along with visibly rising US and OECD oil inventories. The front-month Brent contract will then flip down towards the $60/b-line and below into the $50ies/b.
At what point will OPEC+ turn to cuts? The big question then becomes: When will OPEC+ turn around to make some cuts? At what (price) point will they choose to stabilize the market? Because for sure they will. Higher oil inventories, some more shedding of drilling rigs in US shale and Brent into the 50ies somewhere is probably where the group will step in.
There is nothing we have seen from the group so far which indicates that they will close their eyes, let the world drown in oil and the oil price crash to $40/b or below.
The message from OPEC+ is also about balance and stability. The world won’t drown in oil in 2026. The message from the group as far as we manage to interpret it is twofold: 1) Taking back market share which requires a lower price for non-OPEC+ to back off a bit, and 2) Oil market stability and balance. It is not just about 1. Thus fretting about how we are all going to drown in oil in 2026 is totally off the mark by just focusing on point 1.
When to buy cal 2026? Before Christmas when Brent hits $55/b and before OPEC+ holds its last meeting of the year which is likely to be in early December.
Brent crude oil prices have rebounded a bit along the forward curve. Not much strengthening in the structure of the curve. The front-end backwardation is not much stronger today than on its weakest level so far this year which was on Thursday last week.

The front-end backwardation fell to its weakest level so far this year on Thursday last week. A slight pickup yesterday and today, but still very close to the weakest year to date. More oil from OPEC+ in the coming months and softer demand and rising inventories. We are heading for yet softer levels.


Vad guldets uppgång egentligen betyder för världen

Spotpriset på guld över 4300 USD och silver över 54 USD
Crude oil soon coming to a port near you

Guld och silver stiger hela tiden mot nya höjder
The Mid-East anchor dragging crude oil lower

OPEC+ missar produktionsmål, stöder oljepriserna

Ett samtal om guld, olja, fjärrvärme och förnybar energi

Goldman Sachs höjer prognosen för guld, tror priset når 4900 USD
Guld nära 4000 USD och silver 50 USD, därför kan de fortsätta stiga
Are Ukraine’s attacks on Russian energy infrastructure working?
-
 Nyheter3 veckor sedan
OPEC+ missar produktionsmål, stöder oljepriserna
-
 Nyheter4 veckor sedan
Ett samtal om guld, olja, fjärrvärme och förnybar energi
-
 Nyheter1 vecka sedan
Goldman Sachs höjer prognosen för guld, tror priset når 4900 USD
-
 Nyheter2 veckor sedan
Guld nära 4000 USD och silver 50 USD, därför kan de fortsätta stiga
-
Analys3 veckor sedan
Are Ukraine’s attacks on Russian energy infrastructure working?
-

 Nyheter2 veckor sedan
Blykalla och amerikanska Oklo inleder ett samarbete
-

 Nyheter4 veckor sedan
Guldpriset uppe på nya höjder, nu 3750 USD
-
Nyheter2 veckor sedan
Ett samtal om guld, olja, koppar och stål