

Analys
Gold outlook 2019 – recovery expected to continue
 Gold staged a recovery late in 2018. The yellow metal has recovered most of its losses since June 2018. A collapse in speculative positioning in gold futures drove prices down in the second half of the year, sentiment toward gold is clearly recovering in recent weeks. We expect the recovery to continue as many risks that were being ignored by the market start to get priced-in to gold. Our base case scenario is for gold to reach close to US$1370/oz by year end.
Figure 1: Gold price forecast
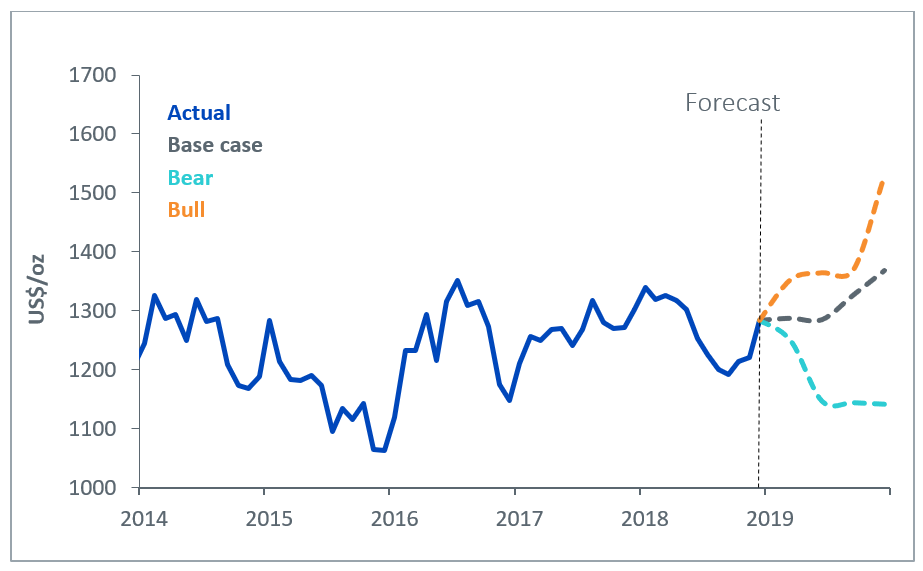
Source: WisdomTree Model Forecasts, Bloomberg Historical Data, data available as of close 31 December 2018. Forecasts are not an indicator of future performance and any investments are subject to risks and uncertainties.
Approach
Using the framework we outlined in our paper Gold outlook: gold to flatline out to June 2019 in the absence of shocks, we apply our views on inflation, exchange rates, interest rates and investor sentiment to try to project where gold will be by the end of the year.
Speculative positioning drives recovery
In 2018 speculative positioning fell to the lowest level since 2001 briefly before recovering very late in the year. Judging by flows into gold Exchange Traded Products, sentiment toward the metal is clearly recovering. Asset market volatility in the final weeks of the year was one of the main catalysts behind the recovery in gold positioning. The S&P 500 lost 14% and Brent oil fell by 35% in the final quarter of 2018. Moreover, the volatility of both benchmarks has risen substantially.
A government shutdown in the US acted as a jolt to investors to remind them that the world’s engine of growth (at least in recent times) is not invincible. Meanwhile concerns around China’s slowing growth rate also led investors to become less optimistic about cyclical assets.
Fed to continue to tighten policy
We expect the Federal Reserve (Fed) to raise rates twice in 2019 (50 basis points), in line with the dot-plots in the central bank’s recent economic forecasts . That’s also in line with consensus forecasts by economists, however, Fed fund futures are not pricing in any rate increases for 2019. We side with the Fed’s guidance as we believe that economic data from the country is strong enough and labour markets are tight enough for the central bank to continue to raise rates. However, we acknowledge the risk to rates is on the downside – which in general should play to the upside for gold prices.
US Treasury bond yield curve to invert
Although we expect a total of 50 basis points increase in policy rates by Q4 2019, we think that 10-year bond yields will only increase around 25 basis points to 3.0% in that time horizon. 2-year bond yields are likely to capture more of the gains in policy rates, but further out in the curve, we are likely to see less yield increases. That’s because the Fed’s holding of a large stock of bonds is likely to hold yields back from rising too aggressively. Also, recent tax cuts are likely to have the most impact in the very short term. As the growth impact peters out over longer horizons, the uplift to yields at the longer end of the curve will be less than at the short end. Although many people see yield curve inversion as a financial signal of impending economic downturn, we believe that an inversion can occur for the less benign reasons outlined above and so it is not necessarily a precursor to an economic recession. If anything, we believe the Fed will err on the side of dovishness, as it will be reluctant to drive policy too far from other central banks. In fact, Fed fund futures indicate that the market thinks that the Fed will stop raising rates altogether this year. That could prove to be supportive for gold prices over the course of 2019.
Figure 2: Nominal US 10 year Bond Yields forecast
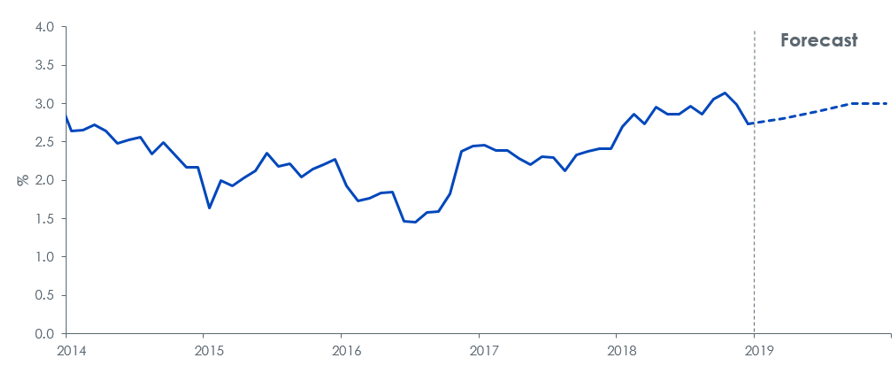
Source: WisdomTree Model Forecasts, Bloomberg Historical Data, data available as of close 31 December 2018. Forecasts are not an indicator of future performance and any investments are subject to risks and uncertainties.
US Dollar appreciation to be short-lived
While the Fed remains the only major central bank raising interest rates over in the first half of the year, we expect the US Dollar to continue to appreciate, especially as judging by Fed fund futures, the market is currently not expecting further tightening. However, as other major central banks – the European Central Bank, Bank of Japan, Bank of England for example start to think about policy normalisation, we could see interest rate differentials narrow and the US Dollar weaken. Additionally, with growing indebtedness in the US – exacerbated by recent tax cuts – we expect a depreciation in the US Dollar.
Figure 3: US Dollar Exchange Rate Forecast
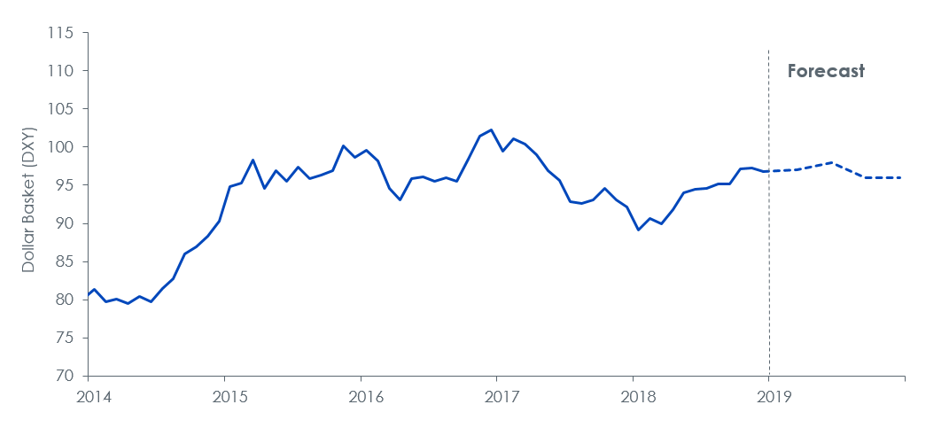
Source: WisdomTree Model Forecasts, Bloomberg Historical Data, data available as of close 31 December 2018. Forecasts are not an indicator of future performance and any investments are subject to risks and uncertainties.
Inflationary pressures to persist, but remain contained by Fed’s policy
US consumer price index (CPI) inflation peaked at 2.9% in July 2018 and declined to 2.2% in November 2018. Volatile energy prices were responsible for a large part of the rise and decline. We expect the Fed’s policy tightening to continue to keep demand-driven inflation in check, but a recovery in oil prices will likely place upward pressure on inflation at the headline level. We expect a small increase in inflation to 2.3% by year-end.
Figure 4: Consumer Price Index inflation forecast
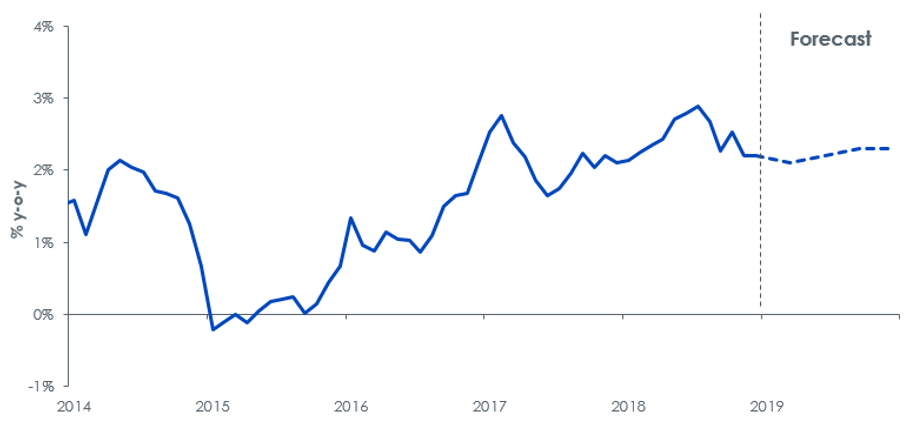
Source: WisdomTree Model Forecasts, Bloomberg Historical Data, data available as of close 31 December 2018. Forecasts are not an indicator of future performance and any investments are subject to risks and uncertainties.
What will help sentiment toward gold improve?
Summarising the monetary/economic drivers of gold – small increases in interest rates, minor appreciation followed by depreciation of the US Dollar and inflation moving marginally higher – are not going to move the dial for gold in a big way. We believe that that gold prices will end the forecast period higher mainly as a result of sentiment towards gold continuing to move out of a depressed state. This process had started already in the final week of 2018 as most markets displayed excessive volatility. We have had multiple bouts of equity market volatility in 2018, but for most part developed world equities have snapped back. That does not guarantee resilience in the face of the next shock. We note that the last time speculative positioning in gold hit levels as low as they did in 2018 was in 2001 – the year when an Argentine debt crisis was brewing, and an overvalued technology sector was imploding. Gold reacted to the stress scenario but with latency. Gold prices rose 25% in 2002 (compared to 2% in 2001).
There are other risks, that could be supportive for gold as historically a safe haven asset, which could drive positioning in gold futures higher:
- No deal Brexit– The UK’s prime minister appears to have insufficient support for the terms of withdrawal from the EU that she has been responsible for negotiating. Although she survived a vote of no confidence from her own party, it clear that the proposal is detested by leave and remain MPs alike. Renegotiating the terms of withdrawal appear impossible at this stage and so it is difficult to see how either side will be appeased by the current deal. We believe the most likely outcome will be for some form of extension beyond the March 30th deadline, however, there is a risk that doesn’t happen and there would be` no withdrawal deal in place. Leaving the EU in such an uncertain manner is likely to be very disruptive for both the UK and EU. Even if there is an extension to the deadline, uncertainty will linger, which will support demand for haven assets.
- Trade-wars – Our working assumption is that rising protectionism in the US is not going to damage global economic demand. In fact, there are signs that the rift between the US and China is beginning to thaw. However, we have seen similar signs before which have been followed by a deterioration of the relationship. If tit-for-tat protectionist measures escalate, the market could be driven into a risk-off mindset.
- The US government is currently shut down as President Trump vies congress to fund his border wall with Mexico. The risk of the standoff becoming prolonged could support demand for haven assets. Indeed, even if the government reopens soon, the risk of the Trump administration continuously using the threat of shutdowns as a strategy to gain leverage over congress is likely to hurt investor confidence in cyclical assets.
In our forecast, we bring back speculative positioning in gold futures to levels consistent with what we have seen in the past five years.
Figure 5: Gold futures speculative positioning
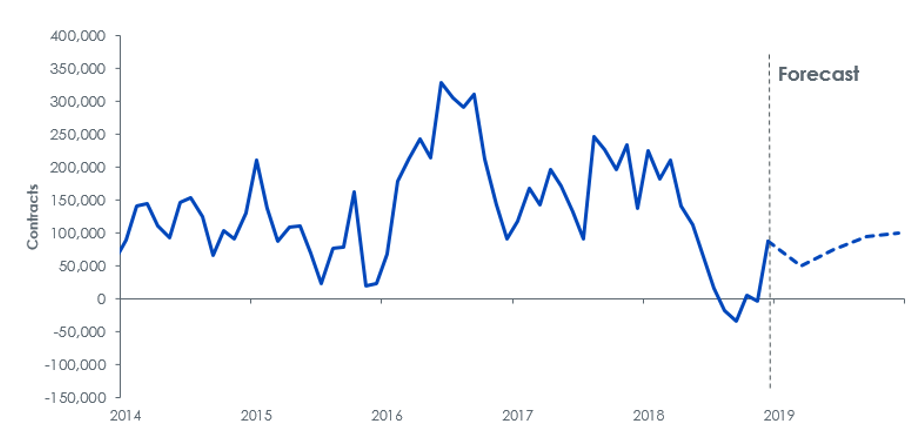
Source: WisdomTree Model Forecasts, Bloomberg Historical Data, data available as of close 31 December 2018. Forecasts are not an indicator of future performance and any investments are subject to risks and uncertainties.
Combining the monetary, economic and sentiment driven factors affecting gold, we believe gold will reach close to US$1370/oz by the end of this year.
Alternative scenarios
We have also developed alternative scenarios for gold as summarised below. Most of the sensitivity comes from our measure of sentiment, speculative positioning. But even in our bear case, we increase positioning into positive territory. In our bull case scenario, we assume the Fed will allow the economy to run hot, only raising rates once, which will put less pressure on bond yields to rise, aid US Dollar depreciation and keep inflation elevated at 2.9%. In the bear case, conversely, we assume the Fed acts more hawkishly and has more impact on the longer bond yields. The US Dollar appreciates as the Fed surprises the market with its hawkishness.
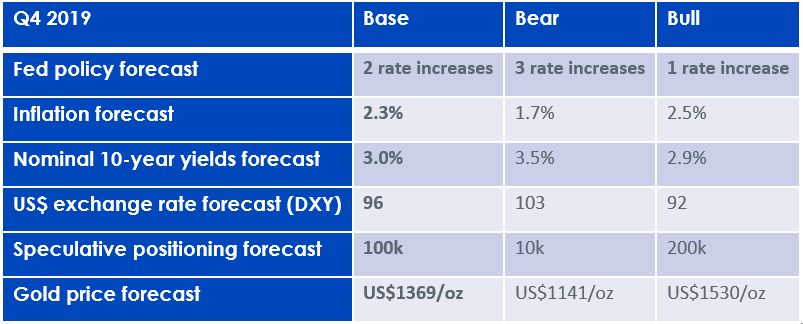
Source: WisdomTree Model Forecasts, Bloomberg Historical Data, data available as of close 31 December 2018. Forecasts are not an indicator of future performance and any investments are subject to risks and uncertainties.
Conclusion
In our base case scenario, we expect gold prices to rise close to US$1370/oz by Q4 2019, mainly as a result of speculative positioning in the futures market being restored. Some US Dollar depreciation and small gains in inflation will also aid gold’s rise.


Selling down on a ”deal”. Brent crude fell 6.2% last week with accelerated weakness towards the end of the week. Close of the week at $87.33/b and low of the week (and on Friday) of $85.8/b. Brent is falling another 4% this morning to $83.7/b on confirmation by Iran that a MoU text has been reached and that it will be signed on Friday this week.

So what is this ”deal” worth? Talk on the desk here this morning is that it is much like ”putting lipstick on a pig” where Trump has to sell this at home as a victory where ”the SoH has reopened”, the nuclear issue will be ironed out over the coming 60 days (or maybe 600 days?) and US consumers are getting a lower gasoline price and maybe US republicans survives the midterm elections.
The importance for Iran is that it emerges as the defacto winner of this war in the eyes of the non-US public world. That Iran now onwards is the ”ruler of the SoH” (combo of geography and new weapons systems like drones) or more softer: ”the guarantor of safe passage through the SoH”.
Iran doesn’t need nuclear weapons any more. Nuclear deterrence doesn’t work any more. Ukraine has made many attacks deep into Russia without being nuked in return. Plenty of Iranian ballistic rockets blasts over Israel but Iran wasn’t nuked in return.
There is no trust between the US and Iran. We don’t know all the details yet of the MoU. But what we do know is that there is no trust between the US and Iran what so ever. This is probably more like a descriptive text on how they can cooperate in a way where both sides keeps tactical leverage. Neither side makes irreversible concessions. Violations can be punished quickly. Cooperation produces immediate benefits.
This is a fragile structure. It can easily break down. There may be details which cannot be overcome. To be seen on Friday. The US has to show that it is willing put enough force behind managing and restraining Israel versus Hezbollah in Lebanon. We have seen that Netanyahu hasn’t listened all that much to Trump’s directives and wishes. This could be a major obstacle.
A gradual reopening is tactically preferable for Iran. A tactical leverage for Iran right now is that global oil stocks have been drawn down towards painful and increasingly dangerous levels with increasing risks for oil price spikes in mid-July to August. This together with US midterm elections on 3 November gives tactical leverage to Iran. Iran probably doesn’t want to fully give up on that leverage. A rapid, full reopening where global stocks are able to refill over the coming 60 days will significantly erode that leverage. If Iran reinstates a closure of the SoH after 60 days (if talks break down again), then the effect won’t be that impactful in terms of prices and the US midterm elections.
So a gradual and partial reopening where global markets gets the oil they need while they are unable to rebuild stocks could be a practical middle way for both parties. Trump can sell it as ”the SoH has reopened” and get affordable gasoline for US consumers. Iran can sell it as ”the SoH has fully reopened, but there is some friction” so flow is only 60-80% of normal.
Not much real demand destruction below $100/b. What we do know is that there is not much real price pain demand destruction for oil globally at an oil price below $100/b. A lot of demand-shock destruction. Fear. But demand should now come roaring back towards normal with fear for exceptionally high prices now is rapidly receding.
Sudden China demand destruction due to EVs? Bullocks. EV share of total Chinese carpool now around 13%. Share of new sales of EVs has reached 50%. This is a very gradual process. It doesn’t make oil demand fall like a rock over night. When EV new sales share reaches 100%, then the gasoline car pool will contract by some 5-10% per year. But that is only gasoline. Sudden reduction in Chinese oil demand is more about shock and risk.
Chinese crude oil imports will come roaring back. At what price? Today’s ”neutral” oil price is $70/b. That is the five year price which has steadily traded around the $70/b mark over the past 3-4 years. With still a risky picture one would think that China and the rest of the world will be big buyers of oil in the range of $70-85/b.
Global demand will likely snap back towards normal, forecasted demand and growth at such prices.
Physical reopening is a gradual process. The physical and practical reopening of the SoH will likely be gradual rather than sudden. And that probably suites Iran tactically as well.
Brent M1 price versus the Brent 5-yr (today’s ”normal” price)

Market is starting to take US/Iran headlines with a pinch of salt. Brent crude rose $2.8/b yesterday to an official close of $112.1/b. But after that it traded as low as $108.05/b before ending late night at around $109.7/b. Through the day it traded in a range of $106.87 – 112.72/b amid a flurry of news or rumors from Iran and the US. ”US temporary sanctions during negotiations” (falls alarm). ”We will bomb Iran” (not anyhow),… etc. While the market is still fluctuating to this kind of news flow, it is starting to take such headlines with a pinch of salt.
We’ll see. Maybe, maybe not. The Brent M1 contract is trading at $110.2/b this morning which very close to the average ticks through yesterday of $110.4/b.
Trump with bearish, verbal intervention whenever Brent trades above $110/b it seems. What seems to be a pattern is that Trump states something like ”very good negotiations going on with Iran”, ”New leaders in Iran are great,..”, ”Great progress in negotiations,…”, ”Deal in sight,..” etc whenever the Brent M1 contract trades above $110/b. An effort to cool the market. These hot air verbal interventions from Trump used to have a heavy bearish impact on prices, but they now seems to have less and less effect unless they are backed by reality.
As far as we can see there has been no real progress in the negotiations between the US and Iran with both sides still standing by their previous demands.
Iran is getting stronger while the cease fire lasts making a return to war for Trump yet harder. Iran is naturally in constant preparation for a return to war given Trump’s steady threats of bombing Iran again. Iran is naturally doing what ever is possible to prepare for a return to war. And every day the cease fire lasts it is better prepared. This naturally makes it more and more difficult and dangerous for the US to return to warring activity versus Iran as the consequences for energy infrastructure in the Persian Gulf will be more and more severe the longer the cease fire lasts. Israel seems to see it this way as well. That the war is not won and that current frozen state of a cease fire gives Iran opportunity to rebuild military and politically.
Global inventories are drawing down day by day. How much? In the meantime the Strait of Hormuz stays closed. There is varying measures and estimates of how much global inventories are drawing down. Our rough estimate, back of the envelope, is that global inventories are drawing down by at least some 10 mb/d or about 300 mb/d in a balance between loss of supply versus demand destruction. Other estimates we see are a monthly draw of 250-270 mb/d. The IEA only ’measured’ a draw in global observable stocks of 117 mb in April with oil on water rising 53 mb while on shore stocks fell 170 mb. But global stocks are hard to measure with large invisible, unmeasured stocks. As such a back of the envelope approach may be better.
Oil products is what the world is consuming. Oil product prices likely to rise while product stocks fall. Strategic Petroleum Reserves (SPR) are predominantly crude oil. Discharging oil from OECD SPR stocks, a sharp reduction in Chinese crude imports and a reduction in global refinery throughput of 6-7 mb/d has helped to keep crude oil markets satisfactorily supplied. But global inventories are drawing down none the less. And oil products is really what the world is consuming. So if global refinery throughput stays subdued, then demand will eventually have to match the supply of oil products. The likely path forward this summer is a steady draw down in jet fuel, diesel and gasoline. Higher prices for these. Then, if possible, higher refinery throughput and higher usage of crude in response to very profitable refinery margins. And lastly sharper draw in crude stocks and higher prices for these. But some 6 mb/d of oil products used to be exported through the Strait of Hormuz. And it may not be so easy to ramp up refinery activity across the world to compensate. Especially as Ukraine continues to damage Russian refineries as well as Russian crude production and export facilities.
Watch oil product stocks and prices as well as Brent calendar 2027. What to watch for this summer is thus oil product inventories falling and oil product premiums to crude rising. Another measure to watch is the Brent crude 2027 contract as it rises steadily day by day as the Strait of Hormuz stays closed and global oil inventories decline. The latter is close to the highest level since the start of the war and keeps rising.
The Brent M1 contract and the Brent 2027 prices and current price of jet fuel in Europe (ARA). All in USD/b

Our back of the envelope calculation of the global shortage created by the closure of the Strait of Hormuz. Note that 3.5 mb/d of discharge from SPR is also a draw. Note also that ’Forced demand loss’ of 2.5 mb/d is probably temporary and will fall back towards zero as logistics are sorted out leaving ’Price demand loss’ to do the job of balancing the market. Thus a shortfall of at least 9 mb/d created by the closure. More if SPR discharge is included and more if Forced demand loss recedes.

Brent is climbing higher. Front-month is at USD 106.3/bl this morning, close to a weekly high and a USD 9/bl jump from Mondays open. This is the move we flagged as a risk earlier in the week: the market shifting from ”a deal is around the corner” to ”this is going to take longer than we thought”.

Analyst Commodities, SEB
During April, rest-of-year Brent remained remarkably stable around USD 90/bl. A stability which rested on one single assumption: the SoH reopens around 1 May. That assumption is now slowly falling apart.
As we highlighted yesterday: every week of delay beyond 1 May adds (theoretically) ish USD 5/bl to the rest-of-year average, as global inventories draw 100 million barrels per week. i.e., a mid-May reopening implies rest-of-year Brent closer to USD 100/bl, and anything pushing into June or July takes us meaningfully higher.
What’s changed in the last 48 hours:
#1: The US military has formally warned that clearing suspected sea mines from SoH could take up to six months. That is a completely different timescale from what the financial market is pricing. Even a political deal tomorrow does not immediately reopen the strait.
#2: Trump has shifted his tone from urgency to ”strategic patience”. In yesterday’s press conference: ”Don’t rush me… I want a great deal.” The market is reading this as a president no longer feeling pressured by timelines, with the naval blockade running in the background.
#3: So far, the military activity is escalating, not de-escalating. Axios reports Iran is laying more mines in SoH. The US 3rd carrier strike group (USS George H.W. Bush) is arriving with two countermine vessels. Trump yesterday ordered the US Navy to destroy any Iranian boats caught laying mines. While CNN reports that the Pentagon is actively drawing up plans to strike Iranian SoH capabilities and individual Iranian military leaders if the ceasefire collapses. i.e., NOT a attitude consistent with an imminent deal!
Spot crude and product prices eased off the early-April highs on a combination of system rerouting and deal optimism. Both now weakening. Goldman estimates April Gulf output is reduced by 14.5 mbl/d, or 57% of pre-war supply, a number that keeps getting worse the longer this drags on.
Demand-side adaptation is ongoing: S. Korea has cut its Middle East crude dependence from 69% to 56% by pulling more from the Americas and Africa, and Japan is kicking off a second round of SPR releases from 1 May. But SPRs are finite.
Ref. to the negotiations, we should not bet on speed. The current Iranian leadership is dominated by genuine hardliners willing to absorb economic pain and run the clock to extract concessions. That is not a setup for a rapid resolution. US/Israeli media briefings keep framing the delay as ”internal Iranian divisions”, the reality is more complicated and points toward weeks and months, not days.
Our point is that the complexity is large, and higher prices have only just started (given a scenario where the negotiations drag out in time). The market spent April leaning on the USD 90/bl rest-of-year assumption; that case is diminishing by the hour. If ”early May reopening” is replaced by ”June, July or later” over the next week or two, both crude and products have meaningful room to reprice higher from here. There is a high risk being short energy and betting on any immediate political resolution(!).


Vattenfalls och Industrikrafts kärnkraftsbolag Videberg Kraft har valt Rolls-Royce SMR
Selling down on a ”deal”

Sommarväder skapar prisrally på elbörsen
Oil product price pain is set to rise as the Strait of Hormuz stays closed into summer

Solkraften pressar elpriserna dagtid
Oil product price pain is set to rise as the Strait of Hormuz stays closed into summer
Sommarväder skapar prisrally på elbörsen
Vattenfalls och Industrikrafts kärnkraftsbolag Videberg Kraft har valt Rolls-Royce SMR
Selling down on a ”deal”
-
Analys4 veckor sedan
Oil product price pain is set to rise as the Strait of Hormuz stays closed into summer
-
Nyheter2 veckor sedan
Sommarväder skapar prisrally på elbörsen
-
 Nyheter2 dagar sedan
Vattenfalls och Industrikrafts kärnkraftsbolag Videberg Kraft har valt Rolls-Royce SMR
-
Analys3 dagar sedan
Selling down on a ”deal”