

Analys
Gold outlook 2019 – recovery expected to continue
 Gold staged a recovery late in 2018. The yellow metal has recovered most of its losses since June 2018. A collapse in speculative positioning in gold futures drove prices down in the second half of the year, sentiment toward gold is clearly recovering in recent weeks. We expect the recovery to continue as many risks that were being ignored by the market start to get priced-in to gold. Our base case scenario is for gold to reach close to US$1370/oz by year end.
Figure 1: Gold price forecast
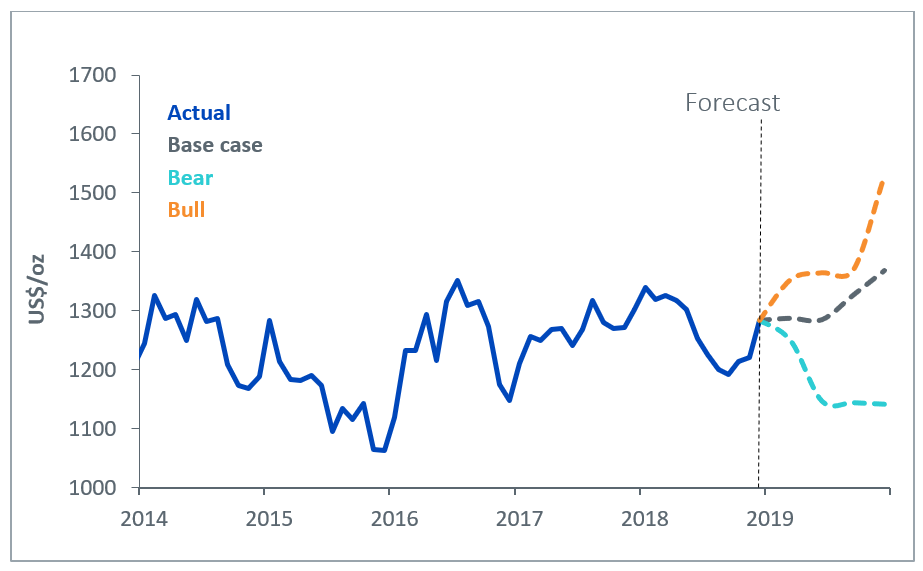
Source: WisdomTree Model Forecasts, Bloomberg Historical Data, data available as of close 31 December 2018. Forecasts are not an indicator of future performance and any investments are subject to risks and uncertainties.
Approach
Using the framework we outlined in our paper Gold outlook: gold to flatline out to June 2019 in the absence of shocks, we apply our views on inflation, exchange rates, interest rates and investor sentiment to try to project where gold will be by the end of the year.
Speculative positioning drives recovery
In 2018 speculative positioning fell to the lowest level since 2001 briefly before recovering very late in the year. Judging by flows into gold Exchange Traded Products, sentiment toward the metal is clearly recovering. Asset market volatility in the final weeks of the year was one of the main catalysts behind the recovery in gold positioning. The S&P 500 lost 14% and Brent oil fell by 35% in the final quarter of 2018. Moreover, the volatility of both benchmarks has risen substantially.
A government shutdown in the US acted as a jolt to investors to remind them that the world’s engine of growth (at least in recent times) is not invincible. Meanwhile concerns around China’s slowing growth rate also led investors to become less optimistic about cyclical assets.
Fed to continue to tighten policy
We expect the Federal Reserve (Fed) to raise rates twice in 2019 (50 basis points), in line with the dot-plots in the central bank’s recent economic forecasts . That’s also in line with consensus forecasts by economists, however, Fed fund futures are not pricing in any rate increases for 2019. We side with the Fed’s guidance as we believe that economic data from the country is strong enough and labour markets are tight enough for the central bank to continue to raise rates. However, we acknowledge the risk to rates is on the downside – which in general should play to the upside for gold prices.
US Treasury bond yield curve to invert
Although we expect a total of 50 basis points increase in policy rates by Q4 2019, we think that 10-year bond yields will only increase around 25 basis points to 3.0% in that time horizon. 2-year bond yields are likely to capture more of the gains in policy rates, but further out in the curve, we are likely to see less yield increases. That’s because the Fed’s holding of a large stock of bonds is likely to hold yields back from rising too aggressively. Also, recent tax cuts are likely to have the most impact in the very short term. As the growth impact peters out over longer horizons, the uplift to yields at the longer end of the curve will be less than at the short end. Although many people see yield curve inversion as a financial signal of impending economic downturn, we believe that an inversion can occur for the less benign reasons outlined above and so it is not necessarily a precursor to an economic recession. If anything, we believe the Fed will err on the side of dovishness, as it will be reluctant to drive policy too far from other central banks. In fact, Fed fund futures indicate that the market thinks that the Fed will stop raising rates altogether this year. That could prove to be supportive for gold prices over the course of 2019.
Figure 2: Nominal US 10 year Bond Yields forecast
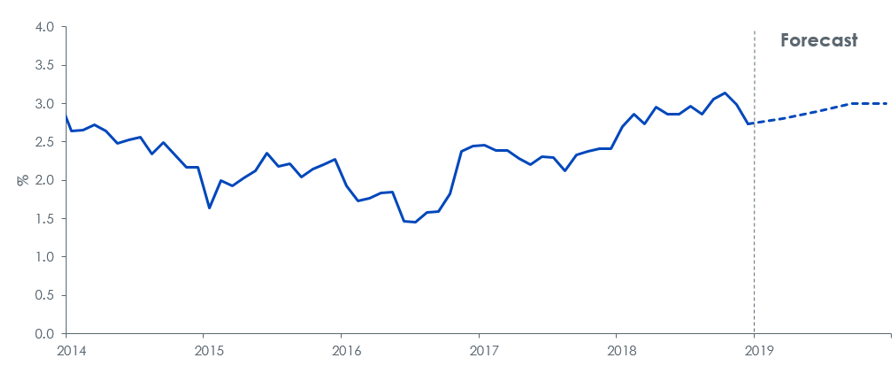
Source: WisdomTree Model Forecasts, Bloomberg Historical Data, data available as of close 31 December 2018. Forecasts are not an indicator of future performance and any investments are subject to risks and uncertainties.
US Dollar appreciation to be short-lived
While the Fed remains the only major central bank raising interest rates over in the first half of the year, we expect the US Dollar to continue to appreciate, especially as judging by Fed fund futures, the market is currently not expecting further tightening. However, as other major central banks – the European Central Bank, Bank of Japan, Bank of England for example start to think about policy normalisation, we could see interest rate differentials narrow and the US Dollar weaken. Additionally, with growing indebtedness in the US – exacerbated by recent tax cuts – we expect a depreciation in the US Dollar.
Figure 3: US Dollar Exchange Rate Forecast
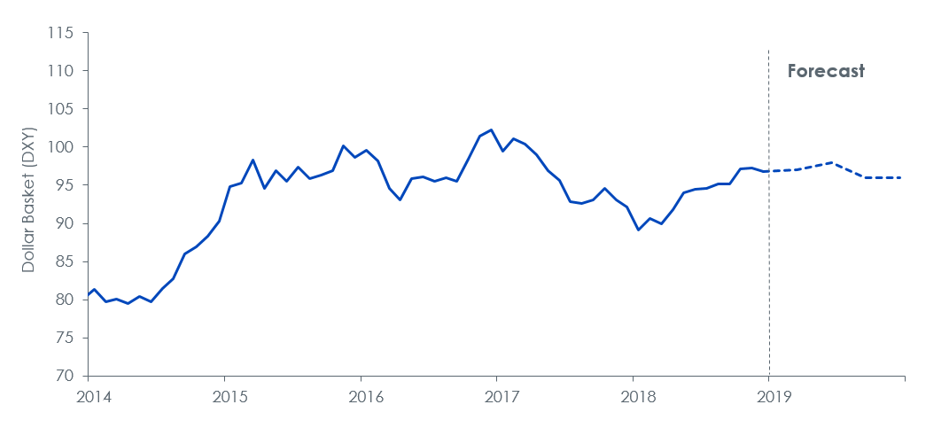
Source: WisdomTree Model Forecasts, Bloomberg Historical Data, data available as of close 31 December 2018. Forecasts are not an indicator of future performance and any investments are subject to risks and uncertainties.
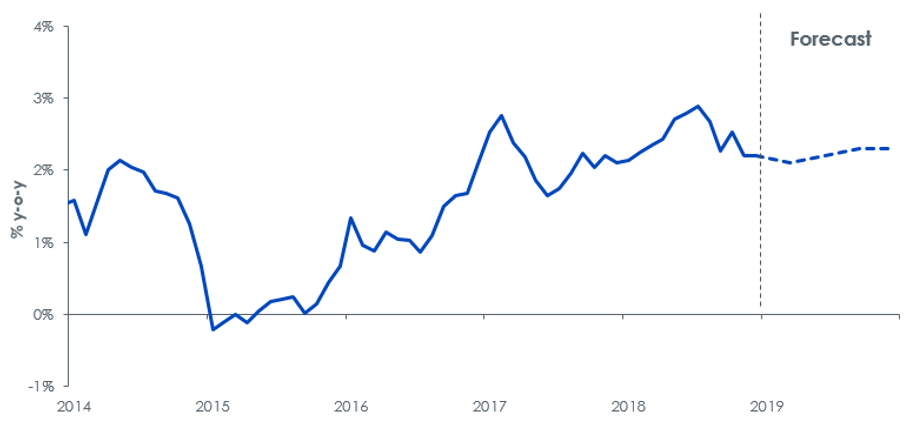
Inflationary pressures to persist, but remain contained by Fed’s policy
US consumer price index (CPI) inflation peaked at 2.9% in July 2018 and declined to 2.2% in November 2018. Volatile energy prices were responsible for a large part of the rise and decline. We expect the Fed’s policy tightening to continue to keep demand-driven inflation in check, but a recovery in oil prices will likely place upward pressure on inflation at the headline level. We expect a small increase in inflation to 2.3% by year-end.
Figure 4: Consumer Price Index inflation forecast
Source: WisdomTree Model Forecasts, Bloomberg Historical Data, data available as of close 31 December 2018. Forecasts are not an indicator of future performance and any investments are subject to risks and uncertainties.
What will help sentiment toward gold improve?
Summarising the monetary/economic drivers of gold – small increases in interest rates, minor appreciation followed by depreciation of the US Dollar and inflation moving marginally higher – are not going to move the dial for gold in a big way. We believe that that gold prices will end the forecast period higher mainly as a result of sentiment towards gold continuing to move out of a depressed state. This process had started already in the final week of 2018 as most markets displayed excessive volatility. We have had multiple bouts of equity market volatility in 2018, but for most part developed world equities have snapped back. That does not guarantee resilience in the face of the next shock. We note that the last time speculative positioning in gold hit levels as low as they did in 2018 was in 2001 – the year when an Argentine debt crisis was brewing, and an overvalued technology sector was imploding. Gold reacted to the stress scenario but with latency. Gold prices rose 25% in 2002 (compared to 2% in 2001).
There are other risks, that could be supportive for gold as historically a safe haven asset, which could drive positioning in gold futures higher:
- No deal Brexit– The UK’s prime minister appears to have insufficient support for the terms of withdrawal from the EU that she has been responsible for negotiating. Although she survived a vote of no confidence from her own party, it clear that the proposal is detested by leave and remain MPs alike. Renegotiating the terms of withdrawal appear impossible at this stage and so it is difficult to see how either side will be appeased by the current deal. We believe the most likely outcome will be for some form of extension beyond the March 30th deadline, however, there is a risk that doesn’t happen and there would be` no withdrawal deal in place. Leaving the EU in such an uncertain manner is likely to be very disruptive for both the UK and EU. Even if there is an extension to the deadline, uncertainty will linger, which will support demand for haven assets.
- Trade-wars – Our working assumption is that rising protectionism in the US is not going to damage global economic demand. In fact, there are signs that the rift between the US and China is beginning to thaw. However, we have seen similar signs before which have been followed by a deterioration of the relationship. If tit-for-tat protectionist measures escalate, the market could be driven into a risk-off mindset.
- The US government is currently shut down as President Trump vies congress to fund his border wall with Mexico. The risk of the standoff becoming prolonged could support demand for haven assets. Indeed, even if the government reopens soon, the risk of the Trump administration continuously using the threat of shutdowns as a strategy to gain leverage over congress is likely to hurt investor confidence in cyclical assets.
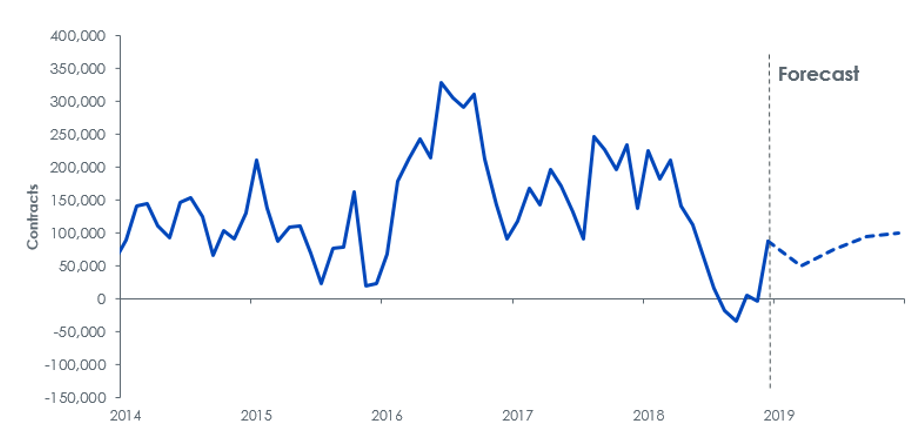
In our forecast, we bring back speculative positioning in gold futures to levels consistent with what we have seen in the past five years.
Figure 5: Gold futures speculative positioning
Source: WisdomTree Model Forecasts, Bloomberg Historical Data, data available as of close 31 December 2018. Forecasts are not an indicator of future performance and any investments are subject to risks and uncertainties.
Combining the monetary, economic and sentiment driven factors affecting gold, we believe gold will reach close to US$1370/oz by the end of this year.
Alternative scenarios
We have also developed alternative scenarios for gold as summarised below. Most of the sensitivity comes from our measure of sentiment, speculative positioning. But even in our bear case, we increase positioning into positive territory. In our bull case scenario, we assume the Fed will allow the economy to run hot, only raising rates once, which will put less pressure on bond yields to rise, aid US Dollar depreciation and keep inflation elevated at 2.9%. In the bear case, conversely, we assume the Fed acts more hawkishly and has more impact on the longer bond yields. The US Dollar appreciates as the Fed surprises the market with its hawkishness.
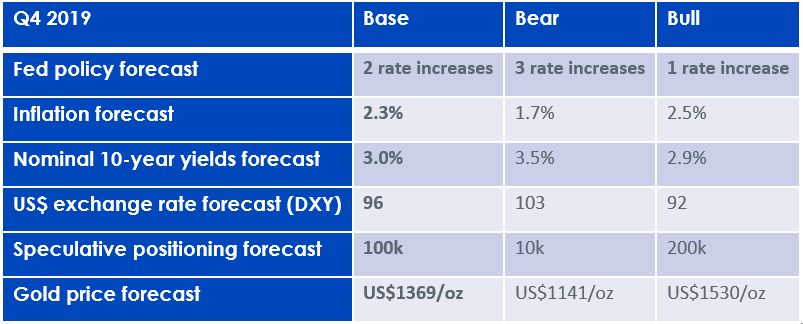
Source: WisdomTree Model Forecasts, Bloomberg Historical Data, data available as of close 31 December 2018. Forecasts are not an indicator of future performance and any investments are subject to risks and uncertainties.
Conclusion
In our base case scenario, we expect gold prices to rise close to US$1370/oz by Q4 2019, mainly as a result of speculative positioning in the futures market being restored. Some US Dollar depreciation and small gains in inflation will also aid gold’s rise.


Brent crude has climbed roughly USD 1.5-2 per barrel since Friday, yet falling USD 0.3 per barrel this mornig and currently trading near USD 67.25/bbl after yesterday’s climb. While the rally reflects short-term geopolitical tension, price action has been choppy, and crude remains locked in a broader range – caught between supply-side pressure and spot resilience.

Prices have been supported by renewed Ukrainian drone strikes targeting Russian infrastructure. Over the weekend, falling debris triggered a fire at the 20mtpa Kirishi refinery, following last week’s attack on the key Primorsk terminal.
Argus estimates that these attacks have halted ish 300 kbl/d of Russian refining capacity in August and September. While the market impact is limited for now, the action signals Kyiv’s growing willingness to disrupt oil flows – supporting a soft geopolitical floor under prices.
The political environment is shifting: the EU is reportedly considering sanctions on Indian and Chinese firms facilitating Russian crude flows, while the U.S. has so far held back – despite Bessent warning that any action from Washington depends on broader European participation. Senator Graham has also publicly criticized NATO members like Slovakia and Hungary for continuing Russian oil imports.
It’s worth noting that China and India remain the two largest buyers of Russian barrels since the invasion of Ukraine. While New Delhi has been hit with 50% secondary tariffs, Beijing has been spared so far.
Still, the broader supply/demand balance leans bearish. Futures markets reflect this: Brent’s prompt spread (gauge of near-term tightness) has narrowed to the current USD 0.42/bl, down from USD 0.96/bl two months ago, pointing to weakening backwardation.
This aligns with expectations for a record surplus in 2026, largely driven by the faster-than-anticipated return of OPEC+ barrels to market. OPEC+ is gathering in Vienna this week to begin revising member production capacity estimates – setting the stage for new output baselines from 2027. The group aims to agree on how to define “maximum sustainable capacity,” with a proposal expected by year-end.
While the IEA pegs OPEC+ capacity at 47.9 million barrels per day, actual output in August was only 42.4 million barrels per day. Disagreements over data and quota fairness (especially from Iraq and Nigeria) have already delayed this process. Angola even quit the group last year after being assigned a lower target than expected. It also remains unclear whether Russia and Iraq can regain earlier output levels due to infrastructure constraints.
Also, macro remains another key driver this week. A 25bp Fed rate cut is widely expected tomorrow (Wednesday), and commodities in general could benefit a potential cut.
Summing up: Brent crude continues to drift sideways, finding near-term support from geopolitics and refining strength. But with surplus building and market structure softening, the upside may remain capped.
Brent crude is essentially flat on the week, but after a volatile ride. Prices started Monday near USD 65.5/bl, climbed steadily to a mid-week high of USD 67.8/bl on Wednesday evening, before falling sharply – losing about USD 2/bl during Thursday’s session.
Brent is currently trading around USD 65.8/bl, right back where it began. The volatility reflects the market’s ongoing struggle to balance growing surplus risks against persistent geopolitical uncertainty and resilient refined product margins. Thursday’s slide snapped a three-day rally and came largely in response to a string of bearish signals, most notably from the IEA’s updated short-term outlook.
The IEA now projects record global oversupply in 2026, reinforcing concerns flagged earlier by the U.S. EIA, which already sees inventories building this quarter. The forecast comes just days after OPEC+ confirmed it will continue returning idle barrels to the market in October – albeit at a slower pace of +137,000 bl/d. While modest, the move underscores a steady push to reclaim market share and adds to supply-side pressure into year-end.
Thursday’s price drop also followed geopolitical incidences: Israeli airstrikes reportedly targeted Hamas leadership in Doha, while Russian drones crossed into Polish airspace – events that initially sent crude higher as traders covered short positions.
Yet, sentiment remains broadly cautious. Strong refining margins and low inventories at key pricing hubs like Europe continue to support the downside. Chinese stockpiling of discounted Russian barrels and tightness in refined product markets – especially diesel – are also lending support.
On the demand side, the IEA revised up its 2025 global demand growth forecast by 60,000 bl/d to 740,000 bl/d YoY, while leaving 2026 unchanged at 698,000 bl/d. Interestingly, the agency also signaled that its next long-term report could show global oil demand rising through 2050.
Meanwhile, OPEC offered a contrasting view in its latest Monthly Oil Market Report, maintaining expectations for a supply deficit both this year and next, even as its members raise output. The group kept its demand growth estimates for 2025 and 2026 unchanged at 1.29 million bl/d and 1.38 million bl/d, respectively.
We continue to watch whether the bearish supply outlook will outweigh geopolitical risk, and if Brent can continue to find support above USD 65/bl – a level increasingly seen as a soft floor for OPEC+ policy.
Brent crude makes some gains as Israel’s attack on Hamas in Qatar rattles markets. Brent crude spiked to a high of USD 67.38/b yesterday as Israel made a strike on Hamas in Qatar. But it wasn’t able to hold on to that level and only closed up 0.6% in the end at USD 66.39/b. This morning it is starting on the up with a gain of 0.9% at USD 67/b. Still rattled by Israel’s attack on Hamas in Qatar yesterday. Brent is getting some help on the margin this morning with Asian equities higher and copper gaining half a percent. But the dark cloud of surplus ahead is nonetheless hanging over the market with Brent trading two dollar lower than last Tuesday.

Geopolitical risk premiums in oil rarely lasts long unless actual supply disruption kicks in. While Israel’s attack on Hamas in Qatar is shocking, the geopolitical risk lifting crude oil yesterday and this morning is unlikely to last very long as such geopolitical risk premiums usually do not last long unless real disruption kicks in.
US API data yesterday indicated a US crude and product stock build last week of 3.1 mb. The US API last evening released partial US oil inventory data indicating that US crude stocks rose 1.3 mb and middle distillates rose 1.5 mb while gasoline rose 0.3 mb. In total a bit more than 3 mb increase. US crude and product stocks usually rise around 1 mb per week this time of year. So US commercial crude and product stock rose 2 mb over the past week adjusted for the seasonal norm. Official and complete data are due today at 16:30.
A 2 mb/week seasonally adj. US stock build implies a 1 – 1.4 mb/d global surplus if it is persistent. Assume that if the global oil market is running a surplus then some 20% to 30% of that surplus ends up in US commercial inventories. A 2 mb seasonally adjusted inventory build equals 286 kb/d. Divide by 0.2 to 0.3 and we get an implied global surplus of 950 kb/d to 1430 kb/d. A 2 mb/week seasonally adjusted build in US oil inventories is close to noise unless it is a persistent pattern every week.
US IEA STEO oil report: Robust surplus ahead and Brent averaging USD 51/b in 2026. The US EIA yesterday released its monthly STEO oil report. It projected a large and persistent surplus ahead. It estimates a global surplus of 2.2 m/d from September to December this year. A 2.4 mb/d surplus in Q1-26 and an average surplus for 2026 of 1.6 mb/d resulting in an average Brent crude oil price of USD 51/b next year. And that includes an assumption where OPEC crude oil production only averages 27.8 mb/d in 2026 versus 27.0 mb/d in 2024 and 28.6 mb/d in August.
Brent will feel the bear-pressure once US/OECD stocks starts visible build. In the meanwhile the oil market sits waiting for this projected surplus to materialize in US and OECD inventories. Once they visibly starts to build on a consistent basis, then Brent crude will likely quickly lose altitude. And unless some unforeseen supply disruption kicks in, it is bound to happen.
US IEA STEO September report. In total not much different than it was in January

US IEA STEO September report. US crude oil production contracting in 2026, but NGLs still growing. Close to zero net liquids growth in total.


Tyskland har så höga elpriser att företag inte har råd att använda elektricitet
Brent crude ticks higher on tension, but market structure stays soft

Kinas elproduktion slog nytt rekord i augusti, vilket även kolkraft gjorde

Det stigande guldpriset en utmaning för smyckesköpare

Aktier i guldbolag laggar priset på guld

Meta bygger ett AI-datacenter på 5 GW och 2,25 GW gaskraftverk
Aker BP gör ett av Norges största oljefynd på ett decennium, stärker resurserna i Yggdrasilområdet
Sommarens torka kan ge högre elpriser i höst
Brent edges higher as India–Russia oil trade draws U.S. ire and Powell takes the stage at Jackson Hole

Mahvie Minerals är verksamt i guldrikt område i Finland
-
 Nyheter4 veckor sedan
Meta bygger ett AI-datacenter på 5 GW och 2,25 GW gaskraftverk
-
 Nyheter4 veckor sedan
Aker BP gör ett av Norges största oljefynd på ett decennium, stärker resurserna i Yggdrasilområdet
-
 Nyheter4 veckor sedan
Sommarens torka kan ge högre elpriser i höst
-
Analys4 veckor sedan
Brent edges higher as India–Russia oil trade draws U.S. ire and Powell takes the stage at Jackson Hole
-
 Nyheter3 veckor sedan
Mahvie Minerals är verksamt i guldrikt område i Finland
-
Analys4 veckor sedan
Increasing risk that OPEC+ will unwind the last 1.65 mb/d of cuts when they meet on 7 September
-

 Nyheter3 veckor sedan
Neil Atkinson spår att priset på olja kommer att stiga till 70 USD
-

 Nyheter2 veckor sedan
Eurobattery Minerals satsar på kritiska metaller för Europas självförsörjning