

Analys
Crude oil comment: Deferred contracts still at very favorable levels as latest rally concentrated at front-end

Bouncing up again after hitting the 200dma. Bitter cold winter storm in Texas adding to it. Brent crude continued its pullback yesterday with a decline of 1.1% to USD 79.29/b trading as low as USD 78.45/b during the day dipping below the 200dma line while closing above. This morning it has been testing the downside but is now a little higher at USD 79.6/b. A bitter cold winter storm is hitting Texas to Floriday. It is going to disrupt US nat gas exports and possibly also US oil production and exports. This may be part of the drive higher for oil today. But maybe also just a bounce up after it tested the 200dma yesterday.

Some of the oomph from the Biden-sanctions on Russia has started to defuse with arguments running that these sanctions will only delay exports of Russian crude and products rather than disrupt them. The effects of sanctions historically tend to dissipate over time as the affected party finds ways around them.
Donald criticizing Putin. Biden-sanctions may not be removed so easily. In a surprising comment, Donald Trump has criticized Putin saying that he is ”destroying Russia” and that ”this is no way to run a country”. Thus, Donald Trump coming Putin to the rescue, removing the recent Biden-sanctions and handing him a favorable peace deal with Ukraine, no longer seems so obvious.
Deeper and wider oil sanctions from Trump may lift deferred contracts. Trump may see that he has the stronger position while Putin is caught in a quagmire of a war in Ukraine. Putin in response seems to seek closer relationship with Iran. That may not be the smart move as the US administration is working on a new set of sanctions towards Iranian oil industry. We expect Donald Trump to initiate new sanctions towards Iran and Venezuela in order to make room for higher US oil production and exports. That however will also require a higher oil price to be realized. On the back of the latest comments from Donald Trump one might wonder whether also Russia will end up with harder sanctions from the US and lower Russian exports as a result and not just Iran and Venezuela. Such sanctions could lift deferred prices.
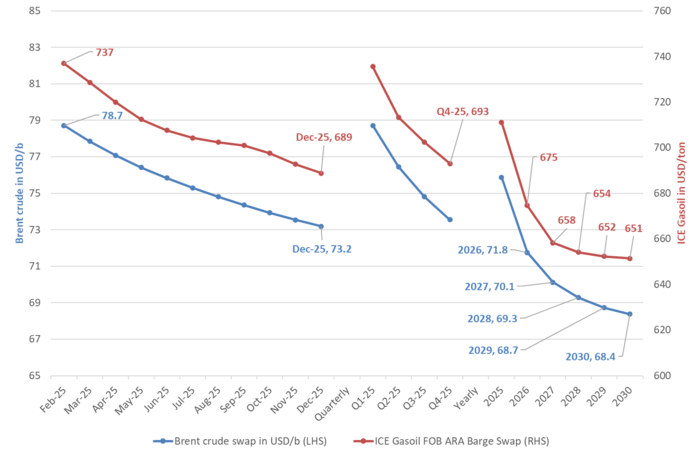
Deferred crude oil prices are close to the 70-line and are still good buys for oil consumers as uplift in prices have mostly taken place at the front-end of the curves. Same for oil products including middle distillates like ICE Gas oil. But deeper and lasting sanctions towards Iran, Venezuela and potentially also Russia could lift deferred prices higher.
The recent rally in the Dubai 1-3 mth time-spread has pulled back a little. But it has not collapsed and is still very, very strong in response to previous buyers of Russian crude turning to the Middle East.
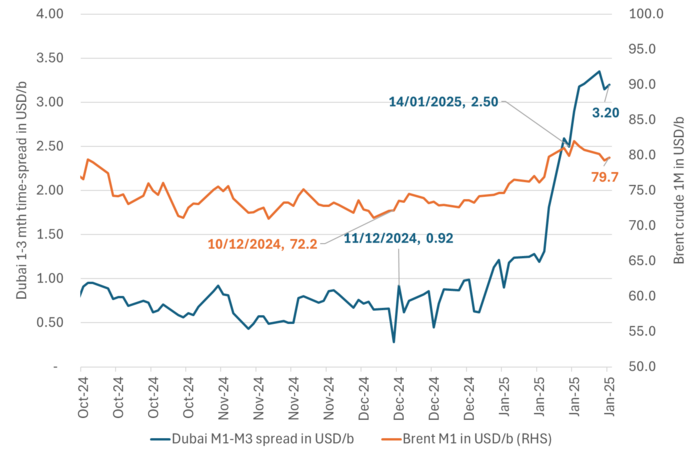
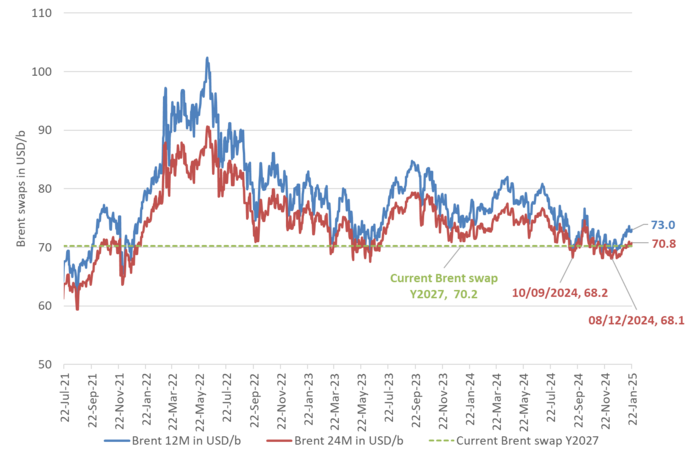
The backwardation in crude is very sharp and front-loaded. The deferred contracts can still be bought at close to the 70-line for Brent crude. The rolling Brent 24mth contract didn’t get all that much lower over the past years except for some brief dips just below USD 70/b
ICE Gasoil rolling forward 12mths and 24mths came as low as USD 640/ton in 2024. Current price is not much higher at USD 662/ton and the year 2027 can be bought at USD 658/ton. Even after the latest rally in the front end of crude and mid-dist curves. Deeper sanctions towards Iran, Russia and Venezuela could potentially lift these higher.
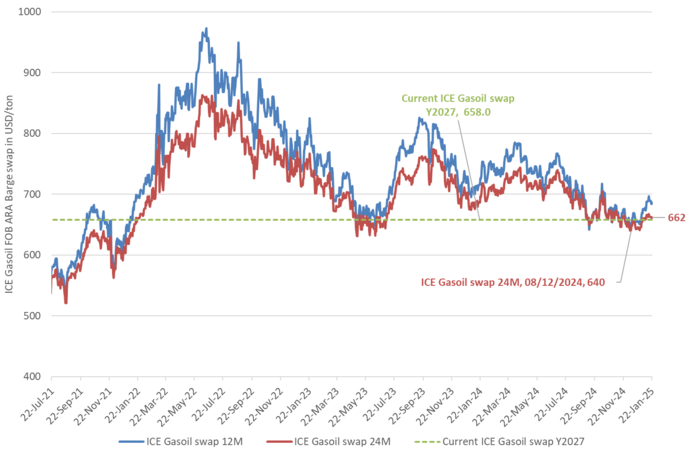
Forward curves for Brent crude swaps and ICE gasoil swaps.
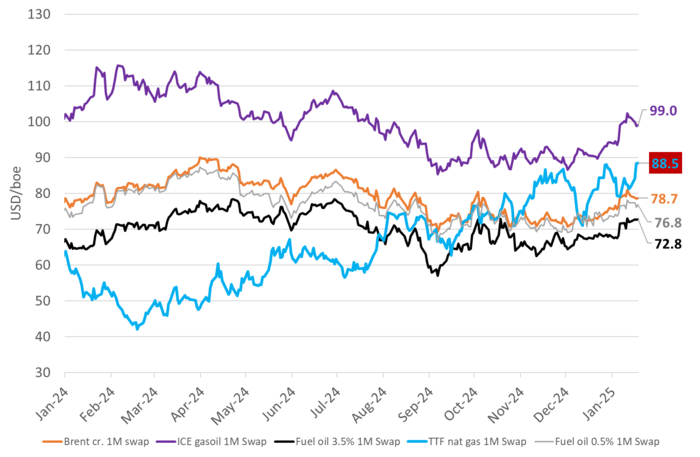
Nat gas front-month getting costlier than Brent crude and fuel oil. Likely shifting some demand away from nat gas to instead oil substitutes.
Some rebound but not much. Brent crude rebounded 1.5% yesterday to $65.47/b. This morning it is inching 0.2% up to $65.6/b. The lowest close last week was on Thursday at $64.11/b.
The curve structure is almost as week as it was before the weekend. The rebound we now have gotten post the message from OPEC+ over the weekend is to a large degree a rebound along the curve rather than much strengthening at the front-end of the curve. That part of the curve structure is almost as weak as it was last Thursday.
We are still on a weakening path. The message from OPEC+ over the weekend was we are still on a weakening path with rising supply from the group. It is just not as rapidly weakening as was feared ahead of the weekend when a quota hike of 500 kb/d/mth for November was discussed.
The Brent curve is on its way to full contango with Brent dipping into the $50ies/b. Thus the ongoing weakening we have had in the crude curve since the start of the year, and especially since early June, will continue until the Brent crude oil forward curve is in full contango along with visibly rising US and OECD oil inventories. The front-month Brent contract will then flip down towards the $60/b-line and below into the $50ies/b.
At what point will OPEC+ turn to cuts? The big question then becomes: When will OPEC+ turn around to make some cuts? At what (price) point will they choose to stabilize the market? Because for sure they will. Higher oil inventories, some more shedding of drilling rigs in US shale and Brent into the 50ies somewhere is probably where the group will step in.
There is nothing we have seen from the group so far which indicates that they will close their eyes, let the world drown in oil and the oil price crash to $40/b or below.
The message from OPEC+ is also about balance and stability. The world won’t drown in oil in 2026. The message from the group as far as we manage to interpret it is twofold: 1) Taking back market share which requires a lower price for non-OPEC+ to back off a bit, and 2) Oil market stability and balance. It is not just about 1. Thus fretting about how we are all going to drown in oil in 2026 is totally off the mark by just focusing on point 1.
When to buy cal 2026? Before Christmas when Brent hits $55/b and before OPEC+ holds its last meeting of the year which is likely to be in early December.
Brent crude oil prices have rebounded a bit along the forward curve. Not much strengthening in the structure of the curve. The front-end backwardation is not much stronger today than on its weakest level so far this year which was on Thursday last week.

The front-end backwardation fell to its weakest level so far this year on Thursday last week. A slight pickup yesterday and today, but still very close to the weakest year to date. More oil from OPEC+ in the coming months and softer demand and rising inventories. We are heading for yet softer levels.

Down to the lowest since early May. Brent crude has fallen sharply the latest four days. It closed at USD 64.11/b yesterday which is the lowest since early May. It is staging a 1.3% rebound this morning along with gains in both equities and industrial metals with an added touch of support from a softer USD on top.
What stands out the most to us this week is the collapse in the Dubai one to three months time-spread.
Dubai is medium sour crude. OPEC+ is in general medium sour crude production. Asian refineries are predominantly designed to process medium sour crude. So Dubai is the real measure of the balance between OPEC+ holding back or not versus Asian oil demand for consumption and stock building.
A sharp weakening of the front-end of the Dubai curve. The front-end of the Dubai crude curve has been holding out very solidly throughout this summer while the front-end of the Brent and WTI curves have been steadily softening. But the strength in the Dubai curve in our view was carrying the crude oil market in general. A source of strength in the crude oil market. The core of the strength.
The now finally sharp decline of the front-end of the Dubai crude curve is thus a strong shift. Weakness in the Dubai crude marker is weakness in the core of the oil market. The core which has helped to hold the oil market elevated.
Facts supports the weakening. Add in facts of Iraq lifting production from Kurdistan through Turkey. Saudi Arabia lifting production to 10 mb/d in September (normal production level) and lifting exports as well as domestic demand for oil for power for air con is fading along with summer heat. Add also in counter seasonal rise in US crude and product stocks last week. US oil stocks usually decline by 1.3 mb/week this time of year. Last week they instead rose 6.4 mb/week (+7.2 mb if including SPR). Total US commercial oil stocks are now only 2.1 mb below the 2015-19 seasonal average. US oil stocks normally decline from now to Christmas. If they instead continue to rise, then it will be strongly counter seasonal rise and will create a very strong bearish pressure on oil prices.
Will OPEC+ lift its voluntary quotas by zero, 137 kb/d, 500 kb/d or 1.5 mb/d? On Sunday of course OPEC+ will decide on how much to unwind of the remaining 1.5 mb/d of voluntary quotas for November. Will it be 137 kb/d yet again as for October? Will it be 500 kb/d as was talked about earlier this week? Or will it be a full unwind in one go of 1.5 mb/d? We think most likely now it will be at least 500 kb/d and possibly a full unwind. We discussed this in a not earlier this week: ”500 kb/d of voluntary quotas in October. But a full unwind of 1.5 mb/d”
The strength in the front-end of the Dubai curve held out through summer while Brent and WTI curve structures weakened steadily. That core strength helped to keep flat crude oil prices elevated close to the 70-line. Now also the Dubai curve has given in.

Brent crude oil forward curves

Total US commercial stocks now close to normal. Counter seasonal rise last week. Rest of year?

Total US crude and product stocks on a steady trend higher.

Analys
OPEC+ will likely unwind 500 kb/d of voluntary quotas in October. But a full unwind of 1.5 mb/d in one go could be in the cards
Down to mid-60ies as Iraq lifts production while Saudi may be tired of voluntary cut frugality. The Brent December contract dropped 1.6% yesterday to USD 66.03/b. This morning it is down another 0.3% to USD 65.8/b. The drop in the price came on the back of the combined news that Iraq has resumed 190 kb/d of production in Kurdistan with exports through Turkey while OPEC+ delegates send signals that the group will unwind the remaining 1.65 mb/d (less the 137 kb/d in October) of voluntary cuts at a pace of 500 kb/d per month pace.
Signals of accelerated unwind and Iraqi increase may be connected. Russia, Kazakhstan and Iraq were main offenders versus the voluntary quotas they had agreed to follow. Russia had a production ’debt’ (cumulative overproduction versus quota) of close to 90 mb in March this year while Kazakhstan had a ’debt’ of about 60 mb and the same for Iraq. This apparently made Saudi Arabia angry this spring. Why should Saudi Arabia hold back if the other voluntary cutters were just freeriding? Thus the sudden rapid unwinding of voluntary cuts. That is at least one angle of explanations for the accelerated unwinding.
If the offenders with production debts then refrained from lifting production as the voluntary cuts were rapidly unwinded, then they could ’pay back’ their ’debts’ as they would under-produce versus the new and steadily higher quotas.
Forget about Kazakhstan. Its production was just too far above the quotas with no hope that the country would hold back production due to cross-ownership of oil assets by international oil companies. But Russia and Iraq should be able to do it.
Iraqi cumulative overproduction versus quotas could reach 85-90 mb in October. Iraq has however steadily continued to overproduce by 3-5 mb per month. In July its new and gradually higher quota came close to equal with a cumulative overproduction of only 0.6 mb that month. In August again however its production had an overshoot of 100 kb/d or 3.1 mb for the month. Its cumulative production debt had then risen to close to 80 mb. We don’t know for September yet. But looking at October we now know that its production will likely average close to 4.5 mb/d due to the revival of 190 kb/d of production in Kurdistan. Its quota however will only be 4.24 mb/d. Its overproduction in October will thus likely be around 250 kb/d above its quota with its production debt rising another 7-8 mb to a total of close to 90 mb.
Again, why should Saudi Arabia be frugal while Iraq is freeriding. Better to get rid of the voluntary quotas as quickly as possible and then start all over with clean sheets.
Unwinding the remaining 1.513 mb/d in one go in October? If OPEC+ unwinds the remaining 1.513 mb/d of voluntary cuts in one big go in October, then Iraq’s quota will be around 4.4 mb/d for October versus its likely production of close to 4.5 mb/d for the coming month..
OPEC+ should thus unwind the remaining 1.513 mb/d (1.65 – 0.137 mb/d) in one go for October in order for the quota of Iraq to be able to keep track with Iraq’s actual production increase.
October 5 will show how it plays out. But a quota unwind of at least 500 kb/d for Oct seems likely. An overall increase of at least 500 kb/d in the voluntary quota for October looks likely. But it could be the whole 1.513 mb/d in one go. If the increase in the quota is ’only’ 500 kb/d then Iraqi cumulative production will still rise by 5.7 mb to a total of 85 mb in October.
Iraqi production debt versus quotas will likely rise by 5.7 mb in October if OPEC+ only lifts the overall quota by 500 kb/d in October. Here assuming historical production debt did not rise in September. That Iraq lifts its production by 190 kb/d in October to 4.47 mb/d (August level + 190 kb/d) and that OPEC+ unwinds 500 kb/d of the remining quotas in October when they decide on this on 5 October.


Blykalla, Evroc och Studsvik vill bygga kärnkraftsdrivna datacenter i Sverige

Toppmöte om framtidens kärnkraft runt Östersjön hölls idag

Nytt prisrekord, guld stiger över 4000 USD

Goldman Sachs höjer prognosen för guld, tror priset når 4900 USD
More weakness and lower price levels ahead, but the world won’t drown in oil in 2026

Mahvie Minerals i en guldtrend
Volatile but going nowhere. Brent crude circles USD 66 as market weighs surplus vs risk

Aktier i guldbolag laggar priset på guld

Kinas elproduktion slog nytt rekord i augusti, vilket även kolkraft gjorde

Tyskland har så höga elpriser att företag inte har råd att använda elektricitet
-
 Nyheter4 veckor sedan
Mahvie Minerals i en guldtrend
-
Analys4 veckor sedan
Volatile but going nowhere. Brent crude circles USD 66 as market weighs surplus vs risk
-
 Nyheter4 veckor sedan
Aktier i guldbolag laggar priset på guld
-
 Nyheter3 veckor sedan
Kinas elproduktion slog nytt rekord i augusti, vilket även kolkraft gjorde
-
Nyheter3 veckor sedan
Tyskland har så höga elpriser att företag inte har råd att använda elektricitet
-

 Nyheter4 veckor sedan
Guld når sin högsta nivå någonsin, nu även justerat för inflation
-

 Nyheter4 veckor sedan
Det stigande guldpriset en utmaning för smyckesköpare
-
Analys4 veckor sedan
Waiting for the surplus while we worry about Israel and Qatar