

Analys
Crude oil comment: A little sideways with new tests towards the 80-line likely

Brent moves into sideways trading around USD 81.5/b with new tests to the 80-line likely. Brent crude traded down 0.9% yesterday to a close of USD 81.29/b and traded as low as USD 80.39/b within the day. This morning it is gaining 0.3% to USD 81.6/b. No obvious major driver for that and the move in oil is well in line with higher industrial metals this morning. The technical picture for Brent 1M is still overbought in terms of RSI at 70.2. But as Brent now has traded a bit sideways for some days the overbought bearish calculus has started to ease a bit. But new tests towards the 80-line seems likely with current RSI at 70.2.

Scott Bessent says he fully supports harder sanctions on Russian oil exports if Donald Trump wishes to use such a tool in the coming negotiations with Russia over Ukraine. That may add some support to oil this morning. The latest US sanctions towards Russia clearly have an effect with one example being the tanker Bhilva which has made a U-turn back towards Russia after having been on course to India (Bloomberg).
US EIA projects US liquids growth of 538 kb/d/y in 2025. The US EIA released its monthly STEO report earlier this week. What is clear is that the boom-years in US oil production are behind us for now. But exactly pinning down at what level US oil production will grow in 2025 is hard. The EIA forecast for US hydrocarbon liquids looks the following:
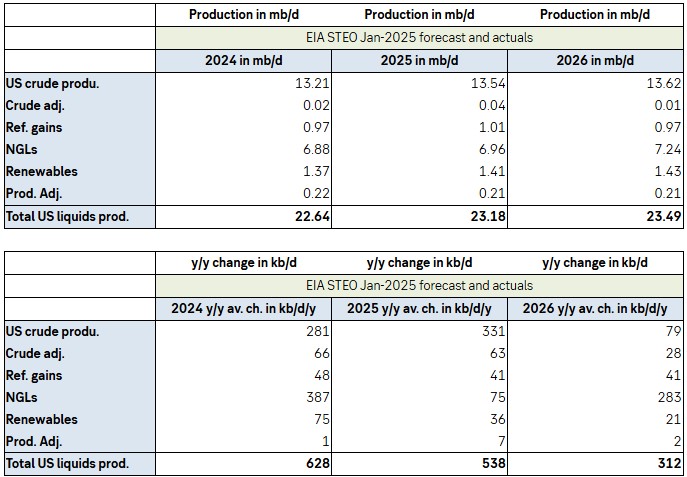
Estimated US crude oil production growth is projected to be virtually zero in 2026. But including all sources of liquids it still sums up to 312 kb/d y/y in growth. A lot or a little? If global oil demand in 2026 only grows with 1 mb/d in 2026, then the US will cover 30% of global demand growth. That is a lot. For 2025 the EIA expects a total growth in US liquids of 538 kb/d y/y.
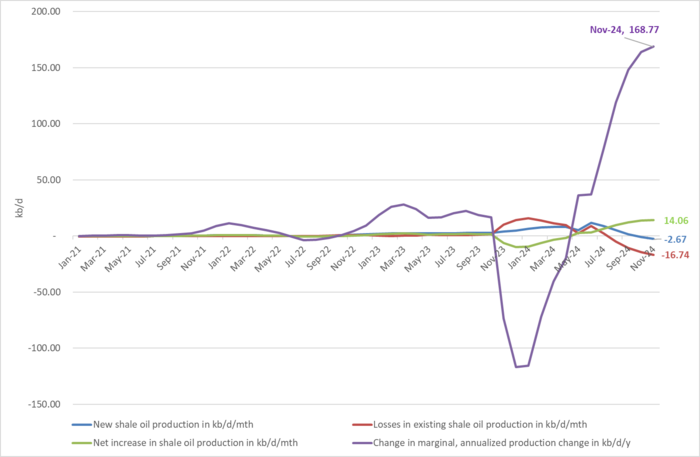
Smaller losses in existing shale oil production. If we instead look at EIA estimates for US shale oil production right here and now and how its components are changing, we see that 1) New monthly production is 666 kb/d, 2) Losses in existing production is 622 kb/d and thus 3) Net monthly growth is 44 kb/d m/m which equals 4) A net marginal annualized growth of 12*44 of 523 kb/d/y. What stands out here is that the EIA in its December report estimated that this marginal annualization only equated to 378 kb/d/y. So, it has been lifted markedly in the latest report. It is however on a downward trajectory and as such the EIA estimate in the table above of y/y growth for US crude oil of 331 kb/d/y may be sensible.
US shale oil new production, losses in existing production, net new production and marginal, annualized production growth in kb/d/y.
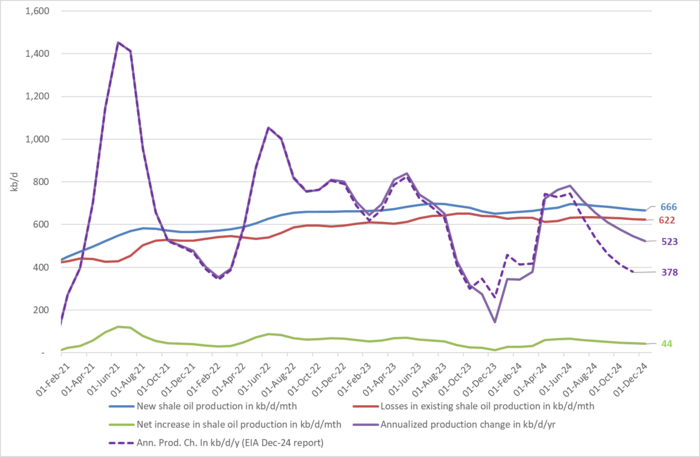
Change in EIA STEO forecast from Dec-24 to Jan-25. What stands out is that estimated losses in existing production is adjusted lower by 16.8 kb/d since November. That is the marginal monthly change. In other words, production in existing production is falling less agressively than estimated in December. But a monthly decline of 622 kb/d/m is of course still massive.

The latest weekly report from the US DOE showed a substantial drawdown across key petroleum categories, adding more upside potential to the fundamental picture.

Commercial crude inventories (excl. SPR) fell by 5.8 million barrels, bringing total inventories down to 415.1 million barrels. Now sitting 11% below the five-year seasonal norm and placed in the lowest 2015-2022 range (see picture below).
Product inventories also tightened further last week. Gasoline inventories declined by 2.1 million barrels, with reductions seen in both finished gasoline and blending components. Current gasoline levels are about 3% below the five-year average for this time of year.
Among products, the most notable move came in diesel, where inventories dropped by almost 4.1 million barrels, deepening the deficit to around 20% below seasonal norms – continuing to underscore the persistent supply tightness in diesel markets.
The only area of inventory growth was in propane/propylene, which posted a significant 5.1-million-barrel build and now stands 9% above the five-year average.
Total commercial petroleum inventories (crude plus refined products) declined by 4.2 million barrels on the week, reinforcing the overall tightening of US crude and products.


A classic case of “buy the rumor, sell the news” played out in oil markets, as Brent crude has dropped sharply – down nearly USD 10 per barrel since yesterday evening – following Iran’s retaliatory strike on a U.S. air base in Qatar. The immediate reaction was: “That was it?” The strike followed a carefully calibrated, non-escalatory playbook, avoiding direct threats to energy infrastructure or disruption of shipping through the Strait of Hormuz – thus calming worst-case fears.
After Monday morning’s sharp spike to USD 81.4 per barrel, triggered by the U.S. bombing of Iranian nuclear facilities, oil prices drifted sideways in anticipation of a potential Iranian response. That response came with advance warning and caused limited physical damage. Early this morning, both the U.S. President and Iranian state media announced a ceasefire, effectively placing a lid on the immediate conflict risk – at least for now.
As a result, Brent crude has now fallen by a total of USD 12 from Monday’s peak, currently trading around USD 69 per barrel.
Looking beyond geopolitics, the market will now shift its focus to the upcoming OPEC+ meeting in early July. Saudi Arabia’s decision to increase output earlier this year – despite falling prices – has drawn renewed attention considering recent developments. Some suggest this was a response to U.S. pressure to offset potential Iranian supply losses.
However, consensus is that the move was driven more by internal OPEC+ dynamics. After years of curbing production to support prices, Riyadh had grown frustrated with quota-busting by several members (notably Kazakhstan). With Saudi Arabia cutting up to 2 million barrels per day – roughly 2% of global supply – returns were diminishing, and the risk of losing market share was rising. The production increase is widely seen as an effort to reassert leadership and restore discipline within the group.
That said, the FT recently stated that, the Saudis remain wary of past missteps. In 2018, Riyadh ramped up output at Trump’s request ahead of Iran sanctions, only to see prices collapse when the U.S. granted broad waivers – triggering oversupply. Officials have reportedly made it clear they don’t intend to repeat that mistake.
The recent visit by President Trump to Saudi Arabia, which included agreements on AI, defense, and nuclear cooperation, suggests a broader strategic alignment. This has fueled speculation about a quiet “pump-for-politics” deal behind recent production moves.
Looking ahead, oil prices have now retraced the entire rally sparked by the June 13 Israel–Iran escalation. This retreat provides more political and policy space for both the U.S. and Saudi Arabia. Specifically, it makes it easier for Riyadh to scale back its three recent production hikes of 411,000 barrels each, potentially returning to more moderate increases of 137,000 barrels for August and September.
In short: with no major loss of Iranian supply to the market, OPEC+ – led by Saudi Arabia – no longer needs to compensate for a disruption that hasn’t materialized, especially not to please the U.S. at the cost of its own market strategy. As the Saudis themselves have signaled, they are unlikely to repeat previous mistakes.
Conclusion: With Brent now in the high USD 60s, buying oil looks fundamentally justified. The geopolitical premium has deflated, but tensions between Israel and Iran remain unresolved – and the risk of missteps and renewed escalation still lingers. In fact, even this morning, reports have emerged of renewed missile fire despite the declared “truce.” The path forward may be calmer – but it is far from stable.
Analys
A muted price reaction. Market looks relaxed, but it is still on edge waiting for what Iran will do
Brent crossed the 80-line this morning but quickly fell back assigning limited probability for Iran choosing to close the Strait of Hormuz. Brent traded in a range of USD 70.56 – 79.04/b last week as the market fluctuated between ”Iran wants a deal” and ”US is about to attack Iran”. At the end of the week though, Donald Trump managed to convince markets (and probably also Iran) that he would make a decision within two weeks. I.e. no imminent attack. Previously when when he has talked about ”making a decision within two weeks” he has often ended up doing nothing in the end. The oil market relaxed as a result and the week ended at USD 77.01/b which is just USD 6/b above the year to date average of USD 71/b.
Brent jumped to USD 81.4/b this morning, the highest since mid-January, but then quickly fell back to a current price of USD 78.2/b which is only up 1.5% versus the close on Friday. As such the market is pricing a fairly low probability that Iran will actually close the Strait of Hormuz. Probably because it will hurt Iranian oil exports as well as the global oil market.
It was however all smoke and mirrors. Deception. The US attacked Iran on Saturday. The attack involved 125 warplanes, submarines and surface warships and 14 bunker buster bombs were dropped on Iranian nuclear sites including Fordow, Natanz and Isfahan. In response the Iranian Parliament voted in support of closing the Strait of Hormuz where some 17 mb of crude and products is transported to the global market every day plus significant volumes of LNG. This is however merely an advise to the Supreme leader Ayatollah Ali Khamenei and the Supreme National Security Council which sits with the final and actual decision.
No supply of oil is lost yet. It is about the risk of Iran closing the Strait of Hormuz or not. So far not a single drop of oil supply has been lost to the global market. The price at the moment is all about the assessed risk of loss of supply. Will Iran choose to choke of the Strait of Hormuz or not? That is the big question. It would be painful for US consumers, for Donald Trump’s voter base, for the global economy but also for Iran and its population which relies on oil exports and income from selling oil out of that Strait as well. As such it is not a no-brainer choice for Iran to close the Strait for oil exports. And looking at the il price this morning it is clear that the oil market doesn’t assign a very high probability of it happening. It is however probably well within the capability of Iran to close the Strait off with rockets, mines, air-drones and possibly sea-drones. Just look at how Ukraine has been able to control and damage the Russian Black Sea fleet.
What to do about the highly enriched uranium which has gone missing? While the US and Israel can celebrate their destruction of Iranian nuclear facilities they are also scratching their heads over what to do with the lost Iranian nuclear material. Iran had 408 kg of highly enriched uranium (IAEA). Almost weapons grade. Enough for some 10 nuclear warheads. It seems to have been transported out of Fordow before the attack this weekend.
The market is still on edge. USD 80-something/b seems sensible while we wait. The oil market reaction to this weekend’s events is very muted so far. The market is still on edge awaiting what Iran will do. Because Iran will do something. But what and when? An oil price of 80-something seems like a sensible level until something do happen.


Tightening fundamentals – bullish inventories from DOE

Jonas Lindvall är tillbaka med ett nytt oljebolag, Perthro, som ska börsnoteras

Oljan, guldet och marknadens oroande tystnad

Domstolen ger klartecken till Lappland Guldprospektering
Bombs to ”ceasefire” in hours – Brent below $70

Stor uppsida i Lappland Guldprospekterings aktie enligt analys

Brookfield ska bygga ett AI-datacenter på hela 750 MW i Strängnäs

Sommaren inleds med sol och varierande elpriser

OPEC+ ökar oljeproduktionen trots fallande priser

Silverpriset släpar efter guldets utveckling, har mer uppsida
-
 Nyheter3 veckor sedan
Stor uppsida i Lappland Guldprospekterings aktie enligt analys
-
 Nyheter4 veckor sedan
Brookfield ska bygga ett AI-datacenter på hela 750 MW i Strängnäs
-
 Nyheter4 veckor sedan
Sommaren inleds med sol och varierande elpriser
-
 Nyheter4 veckor sedan
OPEC+ ökar oljeproduktionen trots fallande priser
-
 Nyheter3 veckor sedan
Silverpriset släpar efter guldets utveckling, har mer uppsida
-
Analys4 veckor sedan
Brent needs to fall to USD 58/b to make cheating unprofitable for Kazakhstan
-

 Nyheter4 veckor sedan
Tradingfirman XTX Markets bygger datacenter i finska Kajana för 1 miljard euro
-

 Nyheter2 veckor sedan
Uppgången i oljepriset planade ut under helgen