

Analys
Brent gains on positive China data and new attacks on Russian oil processing

Positive China data and further attacks on Russian oil processing facilities lifts Brent yet higher. Brent crude gained 4.1% last week with a close on Friday 15 March at USD 85.3/b. Continued declines in US inventories, a bullish oil market outlook from the IEA and damages on Russia’s Rosneft Ryazan oil processing plant by Ukrainian drones helped Brent crude to break above the USD 85/b level. This morning Brent is adding another 0.4% to USD 85.7/b driven by a range of additional attacks on Russian refineries over the weekend and positive Chinese macro data also showing Chinese apparent oil demand up 6.1% YoY for Jan+Feb.

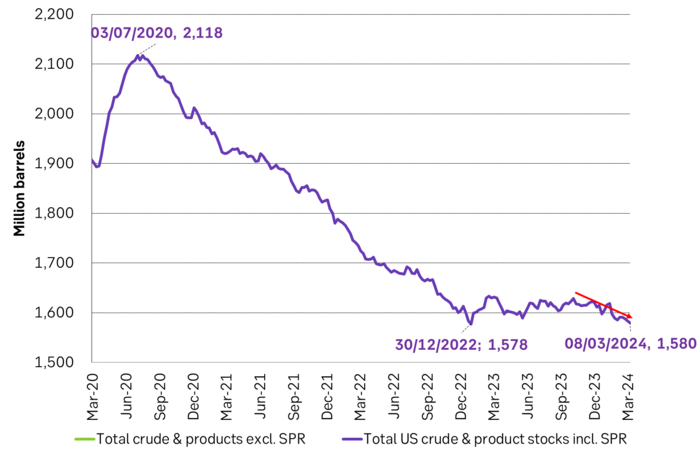
Brent crude is getting a steady tailwind from declining US oil inventories. Steady and continued declines in US inventories since the start of the year has been nudging the oil price steadily higher but there has clearly been some resistance around the USD 85/bl level. US inventories continued that decline in data also last week with commercial crude and product stocks down 4.7 m b. Total US stocks including SPR declined 4.1 m b to 1580 m b which is now only 2 m b above the low point on 30 December 2022 at 1578 m b. These persistent declines in US oil inventories is a clear reflection of the global market in deficit where demand is sufficiently strong, cuts by OPEC+ are sufficiently deep while US shale oil production is close to muted with hardly any growth projected from Q4-23 to Q4-24.
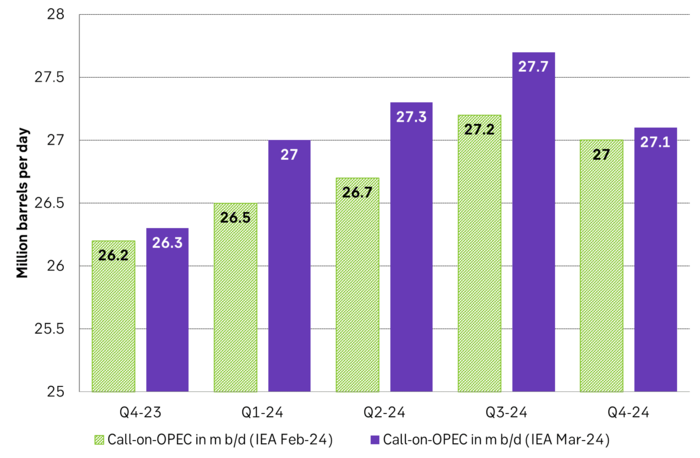
Bullish report from IEA last week indicates that further inventory declines is to be expected. The monthly report from IEA last week gave an additional boost to this picture as it lifted projected oil demand for 2024 by 0.2 m b/d, reduced non-OPEC production by 0.2 m b/d and thus increased its estimated call-on-OPEC by 0.4 m b/d for 2024. The world will need steadily more oil from OPEC every quarter to Q3-24 and by Q4-24 the world will need 0.8 m b/d more from the group than it did in Q4-23. That is great news for OPEC+. There is no way that they’ll move away from current strategy of ”Price over volume” with this backdrop. The report from IEA last week is indicating that the gradual declines in US inventories we have seen so far this year will likely continue. And such a trend will give continued support for oil prices in the coming quarters. Oil price projections are lifted in response to this and last out is Morgan Stanley which raises its Q3-24 Brent forecast by US 10/b to USD 90/b.
SEB’s Brent crude forecast for 2024 is USD 85/b (average year) which implies that we’ll likely see both USD 70/b as well as USD 100/b some times during the year.
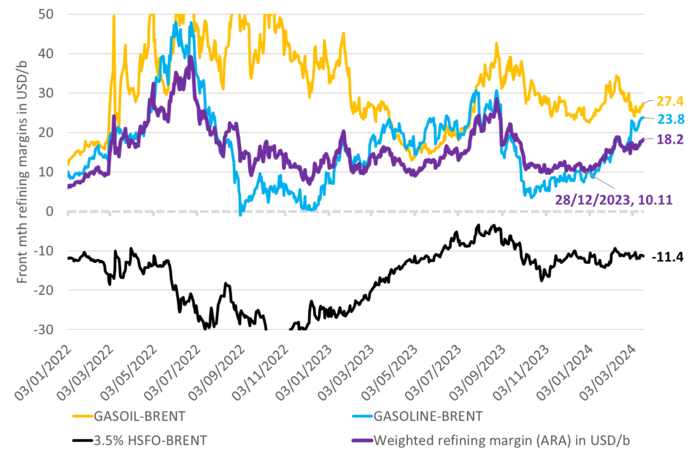
Attacks on Russian oil processing will mostly impact refining margins and crude grade premiums as crude supply is unlikely to be disrupted. The Ukrainian drone attacks on Russian oil infrastructure has surprised the market as many of them are deep within Russia. Facilities in Russia’s Samara region which is more than 1,000 km away from the Ukrainian border were attacked on Saturday. Oil processing plants and oil refineries are highly complex structures. If damaged by drones they can potentially be out of operation for extended periods. Plain oil transportation systems are much simpler and easier and faster to repair. The essence here is that we’ll likely not lose any oil supply while we might lose oil refining capacity due to these attacks. Most of the impact from these attacks should thus be on refining margins and not so much on crude oil prices. But when diesel cracks, gasoil cracks and gasoline cracks goes up then typically also light sweet crude prices goes up. As such there is a spillover effect from damages to Russian oil refineries to Brent crude oil prices even if we don’t lose a single drop of Russian crude oil production and supply.
Total US crude and product stocks incl. SPR has been ticking lower and lower so far this year and are now only 2 m b/d above the low-point in late December 2022. This is a solid indication that the global oil market is running a deficit.
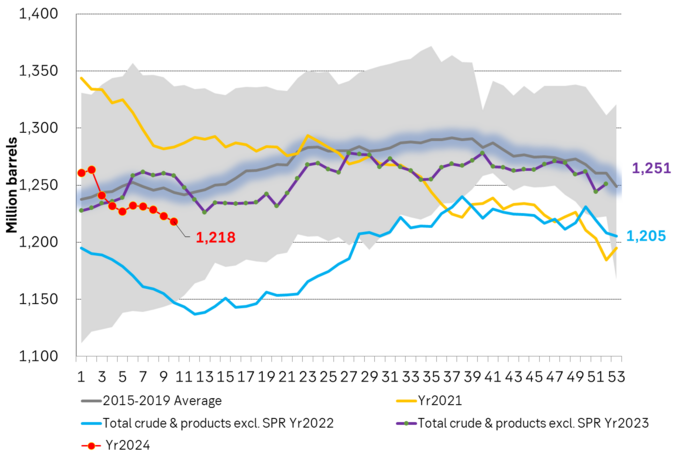
Total commercial crude and product stocks (excl. SPR) has been ticking lower and lower so far this year. This has helped to nudge oil prices steadily higher.
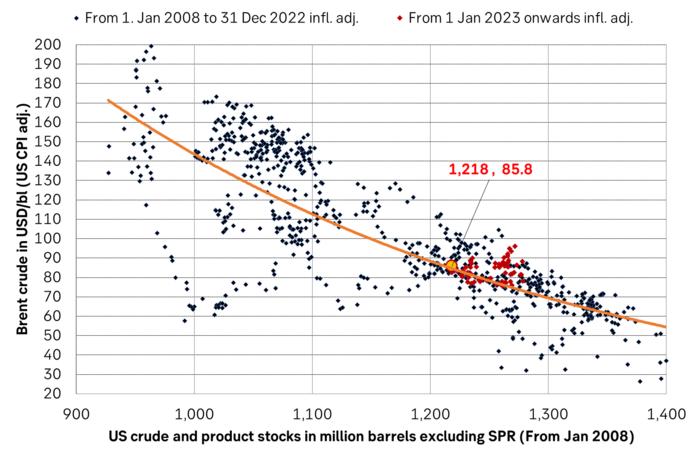
Brent crude looks very fairly priced at around USD 85/b versus current US commercial oil inventories
Call-on-OPEC by IEA: World will need more and more oil from OPEC through the year. In Q4-24 the world will need 0.8 m b/d more oil from OPEC in Q4-24 than in Q4-23.
ARA refining margins have moved up so far this year => Refineries want to process more crude oil and thus they want to buy more crude oil.
Some rebound but not much. Brent crude rebounded 1.5% yesterday to $65.47/b. This morning it is inching 0.2% up to $65.6/b. The lowest close last week was on Thursday at $64.11/b.

The curve structure is almost as week as it was before the weekend. The rebound we now have gotten post the message from OPEC+ over the weekend is to a large degree a rebound along the curve rather than much strengthening at the front-end of the curve. That part of the curve structure is almost as weak as it was last Thursday.
We are still on a weakening path. The message from OPEC+ over the weekend was we are still on a weakening path with rising supply from the group. It is just not as rapidly weakening as was feared ahead of the weekend when a quota hike of 500 kb/d/mth for November was discussed.
The Brent curve is on its way to full contango with Brent dipping into the $50ies/b. Thus the ongoing weakening we have had in the crude curve since the start of the year, and especially since early June, will continue until the Brent crude oil forward curve is in full contango along with visibly rising US and OECD oil inventories. The front-month Brent contract will then flip down towards the $60/b-line and below into the $50ies/b.
At what point will OPEC+ turn to cuts? The big question then becomes: When will OPEC+ turn around to make some cuts? At what (price) point will they choose to stabilize the market? Because for sure they will. Higher oil inventories, some more shedding of drilling rigs in US shale and Brent into the 50ies somewhere is probably where the group will step in.
There is nothing we have seen from the group so far which indicates that they will close their eyes, let the world drown in oil and the oil price crash to $40/b or below.
The message from OPEC+ is also about balance and stability. The world won’t drown in oil in 2026. The message from the group as far as we manage to interpret it is twofold: 1) Taking back market share which requires a lower price for non-OPEC+ to back off a bit, and 2) Oil market stability and balance. It is not just about 1. Thus fretting about how we are all going to drown in oil in 2026 is totally off the mark by just focusing on point 1.
When to buy cal 2026? Before Christmas when Brent hits $55/b and before OPEC+ holds its last meeting of the year which is likely to be in early December.
Brent crude oil prices have rebounded a bit along the forward curve. Not much strengthening in the structure of the curve. The front-end backwardation is not much stronger today than on its weakest level so far this year which was on Thursday last week.

The front-end backwardation fell to its weakest level so far this year on Thursday last week. A slight pickup yesterday and today, but still very close to the weakest year to date. More oil from OPEC+ in the coming months and softer demand and rising inventories. We are heading for yet softer levels.

Down to the lowest since early May. Brent crude has fallen sharply the latest four days. It closed at USD 64.11/b yesterday which is the lowest since early May. It is staging a 1.3% rebound this morning along with gains in both equities and industrial metals with an added touch of support from a softer USD on top.
What stands out the most to us this week is the collapse in the Dubai one to three months time-spread.
Dubai is medium sour crude. OPEC+ is in general medium sour crude production. Asian refineries are predominantly designed to process medium sour crude. So Dubai is the real measure of the balance between OPEC+ holding back or not versus Asian oil demand for consumption and stock building.
A sharp weakening of the front-end of the Dubai curve. The front-end of the Dubai crude curve has been holding out very solidly throughout this summer while the front-end of the Brent and WTI curves have been steadily softening. But the strength in the Dubai curve in our view was carrying the crude oil market in general. A source of strength in the crude oil market. The core of the strength.
The now finally sharp decline of the front-end of the Dubai crude curve is thus a strong shift. Weakness in the Dubai crude marker is weakness in the core of the oil market. The core which has helped to hold the oil market elevated.
Facts supports the weakening. Add in facts of Iraq lifting production from Kurdistan through Turkey. Saudi Arabia lifting production to 10 mb/d in September (normal production level) and lifting exports as well as domestic demand for oil for power for air con is fading along with summer heat. Add also in counter seasonal rise in US crude and product stocks last week. US oil stocks usually decline by 1.3 mb/week this time of year. Last week they instead rose 6.4 mb/week (+7.2 mb if including SPR). Total US commercial oil stocks are now only 2.1 mb below the 2015-19 seasonal average. US oil stocks normally decline from now to Christmas. If they instead continue to rise, then it will be strongly counter seasonal rise and will create a very strong bearish pressure on oil prices.
Will OPEC+ lift its voluntary quotas by zero, 137 kb/d, 500 kb/d or 1.5 mb/d? On Sunday of course OPEC+ will decide on how much to unwind of the remaining 1.5 mb/d of voluntary quotas for November. Will it be 137 kb/d yet again as for October? Will it be 500 kb/d as was talked about earlier this week? Or will it be a full unwind in one go of 1.5 mb/d? We think most likely now it will be at least 500 kb/d and possibly a full unwind. We discussed this in a not earlier this week: ”500 kb/d of voluntary quotas in October. But a full unwind of 1.5 mb/d”
The strength in the front-end of the Dubai curve held out through summer while Brent and WTI curve structures weakened steadily. That core strength helped to keep flat crude oil prices elevated close to the 70-line. Now also the Dubai curve has given in.

Brent crude oil forward curves

Total US commercial stocks now close to normal. Counter seasonal rise last week. Rest of year?

Total US crude and product stocks on a steady trend higher.

Analys
OPEC+ will likely unwind 500 kb/d of voluntary quotas in October. But a full unwind of 1.5 mb/d in one go could be in the cards
Down to mid-60ies as Iraq lifts production while Saudi may be tired of voluntary cut frugality. The Brent December contract dropped 1.6% yesterday to USD 66.03/b. This morning it is down another 0.3% to USD 65.8/b. The drop in the price came on the back of the combined news that Iraq has resumed 190 kb/d of production in Kurdistan with exports through Turkey while OPEC+ delegates send signals that the group will unwind the remaining 1.65 mb/d (less the 137 kb/d in October) of voluntary cuts at a pace of 500 kb/d per month pace.
Signals of accelerated unwind and Iraqi increase may be connected. Russia, Kazakhstan and Iraq were main offenders versus the voluntary quotas they had agreed to follow. Russia had a production ’debt’ (cumulative overproduction versus quota) of close to 90 mb in March this year while Kazakhstan had a ’debt’ of about 60 mb and the same for Iraq. This apparently made Saudi Arabia angry this spring. Why should Saudi Arabia hold back if the other voluntary cutters were just freeriding? Thus the sudden rapid unwinding of voluntary cuts. That is at least one angle of explanations for the accelerated unwinding.
If the offenders with production debts then refrained from lifting production as the voluntary cuts were rapidly unwinded, then they could ’pay back’ their ’debts’ as they would under-produce versus the new and steadily higher quotas.
Forget about Kazakhstan. Its production was just too far above the quotas with no hope that the country would hold back production due to cross-ownership of oil assets by international oil companies. But Russia and Iraq should be able to do it.
Iraqi cumulative overproduction versus quotas could reach 85-90 mb in October. Iraq has however steadily continued to overproduce by 3-5 mb per month. In July its new and gradually higher quota came close to equal with a cumulative overproduction of only 0.6 mb that month. In August again however its production had an overshoot of 100 kb/d or 3.1 mb for the month. Its cumulative production debt had then risen to close to 80 mb. We don’t know for September yet. But looking at October we now know that its production will likely average close to 4.5 mb/d due to the revival of 190 kb/d of production in Kurdistan. Its quota however will only be 4.24 mb/d. Its overproduction in October will thus likely be around 250 kb/d above its quota with its production debt rising another 7-8 mb to a total of close to 90 mb.
Again, why should Saudi Arabia be frugal while Iraq is freeriding. Better to get rid of the voluntary quotas as quickly as possible and then start all over with clean sheets.
Unwinding the remaining 1.513 mb/d in one go in October? If OPEC+ unwinds the remaining 1.513 mb/d of voluntary cuts in one big go in October, then Iraq’s quota will be around 4.4 mb/d for October versus its likely production of close to 4.5 mb/d for the coming month..
OPEC+ should thus unwind the remaining 1.513 mb/d (1.65 – 0.137 mb/d) in one go for October in order for the quota of Iraq to be able to keep track with Iraq’s actual production increase.
October 5 will show how it plays out. But a quota unwind of at least 500 kb/d for Oct seems likely. An overall increase of at least 500 kb/d in the voluntary quota for October looks likely. But it could be the whole 1.513 mb/d in one go. If the increase in the quota is ’only’ 500 kb/d then Iraqi cumulative production will still rise by 5.7 mb to a total of 85 mb in October.
Iraqi production debt versus quotas will likely rise by 5.7 mb in October if OPEC+ only lifts the overall quota by 500 kb/d in October. Here assuming historical production debt did not rise in September. That Iraq lifts its production by 190 kb/d in October to 4.47 mb/d (August level + 190 kb/d) and that OPEC+ unwinds 500 kb/d of the remining quotas in October when they decide on this on 5 October.


Silver spränger den magiska gränsen, kostar nu över 50 USD per uns

Blykalla, Evroc och Studsvik vill bygga kärnkraftsdrivna datacenter i Sverige

Toppmöte om framtidens kärnkraft runt Östersjön hölls idag

Nytt prisrekord, guld stiger över 4000 USD

Goldman Sachs höjer prognosen för guld, tror priset når 4900 USD

Mahvie Minerals i en guldtrend
Volatile but going nowhere. Brent crude circles USD 66 as market weighs surplus vs risk

Aktier i guldbolag laggar priset på guld

Kinas elproduktion slog nytt rekord i augusti, vilket även kolkraft gjorde

Tyskland har så höga elpriser att företag inte har råd att använda elektricitet
-
 Nyheter4 veckor sedan
Mahvie Minerals i en guldtrend
-
Analys4 veckor sedan
Volatile but going nowhere. Brent crude circles USD 66 as market weighs surplus vs risk
-
 Nyheter4 veckor sedan
Aktier i guldbolag laggar priset på guld
-
 Nyheter4 veckor sedan
Kinas elproduktion slog nytt rekord i augusti, vilket även kolkraft gjorde
-
Nyheter3 veckor sedan
Tyskland har så höga elpriser att företag inte har råd att använda elektricitet
-

 Nyheter4 veckor sedan
Guld når sin högsta nivå någonsin, nu även justerat för inflation
-

 Nyheter4 veckor sedan
Det stigande guldpriset en utmaning för smyckesköpare
-
Analys3 veckor sedan
Brent crude ticks higher on tension, but market structure stays soft