

Analys
Brent crude will fluctuate more as OPEC+ loosens market control

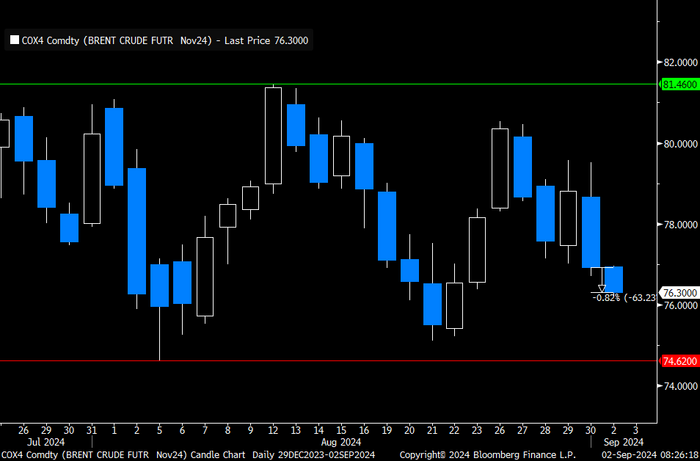
Market focuses on China weakness and more supply from OPEC+ while the sound of Israeli rockets in Lebanon one weak ago are fading. Following a high of USD 80.53/b on Monday last week (following Lebanon – Israel rocket exchange on Sunday 25 Aug.) the Brent November contract traded downhill and ended the week at USD 76.93/b. On a Friday to Friday basis however, the November contract was down by only 1.6%. So not at all a total route. This morning the Brent Nov. contract is down 0.7% at USD 76.4/b on combined concerns for the Chinese economy and increasing signs that OPEC+ will indeed lift production in Q4-24 as earlier signaled. The current disturbances in Libya’s oil production could provide room for added supply from OPEC+. But fluctuations in Libya’s oil production has become quite normal over the latest years and any outages will probably be short lived. And to what we can understand from the news flow there has been given signals for restart of production already.

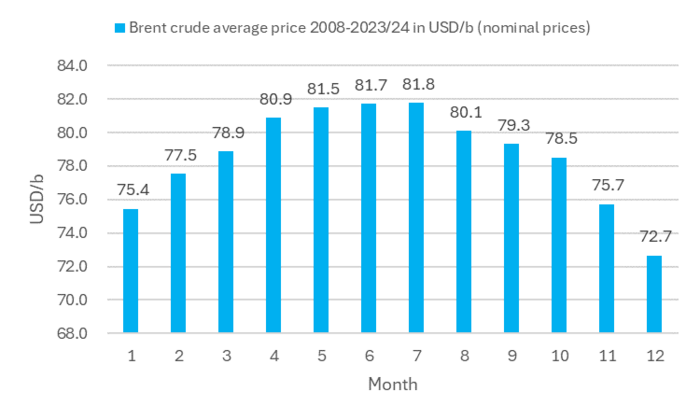
Softer towards the end of the year? The Brent crude oil price has a historical tendency for weakness in the latter part of the year. With continued deterioration in China and added barrels from OPEC+ in Q4-24 this could very well be the case also this year.
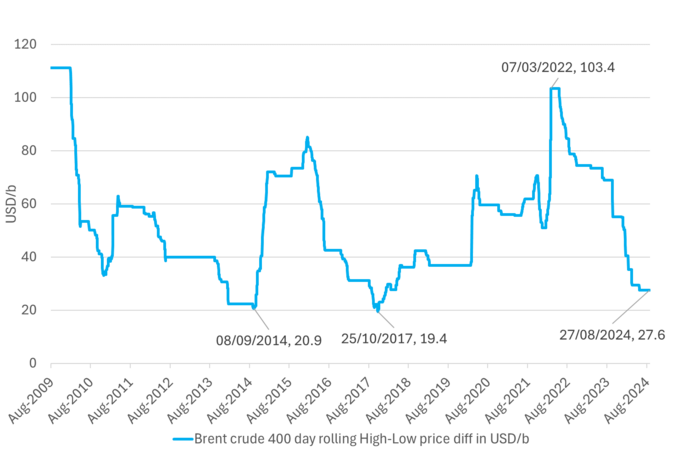
Brent will likely move over a wider range with softer market control by OPEC+. OPEC+ looks set to move to a softer price control regime. Shifting from a strict ”price” focus regime to some kind of hybrid ”price/volume” market control. This should allow the Brent crude oil price to fluctuate more. The difference between the highest and the lowest Brent crude oil price over the past 400 days is only USD 27.6/b. The median since 2009 is USD 50/b.
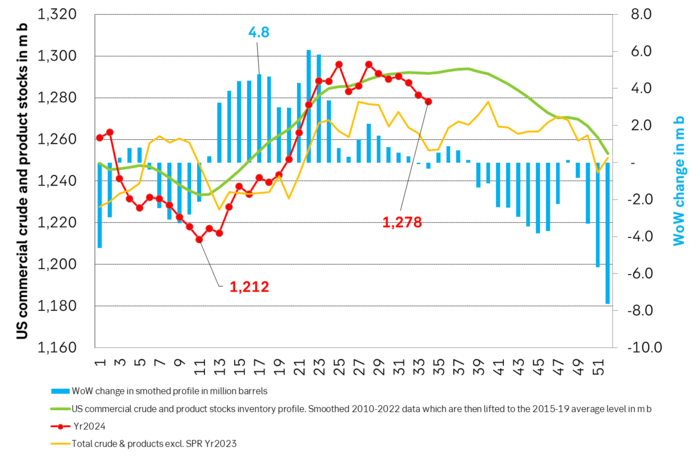
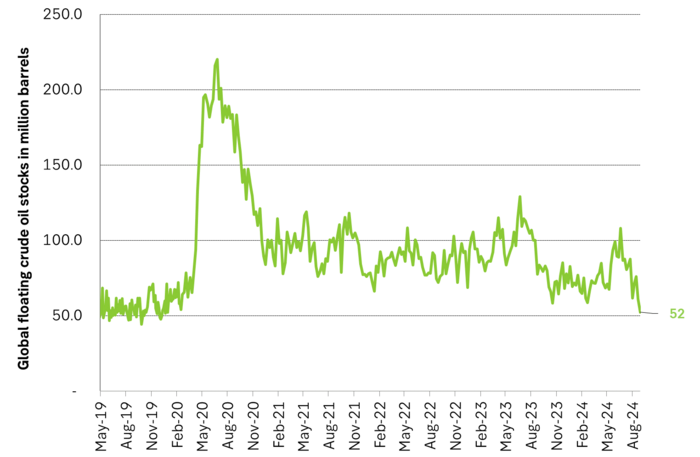
Bearish concerns for the future. But market looks tight here and now and Mid-East is very unstable. Lots of bearish talk and concerns, but physical signals are still tight. US oil inventories have been falling steadily and counter seasonally over the past 6 weeks and floating global crude stocks have fallen sharply and by more than 50 m barrels since a peak in June. Combine this with the very unstable situation in the Middle East and it is not so easy to sit with large short positions in oil.
The Brent crude November contract in USD/b
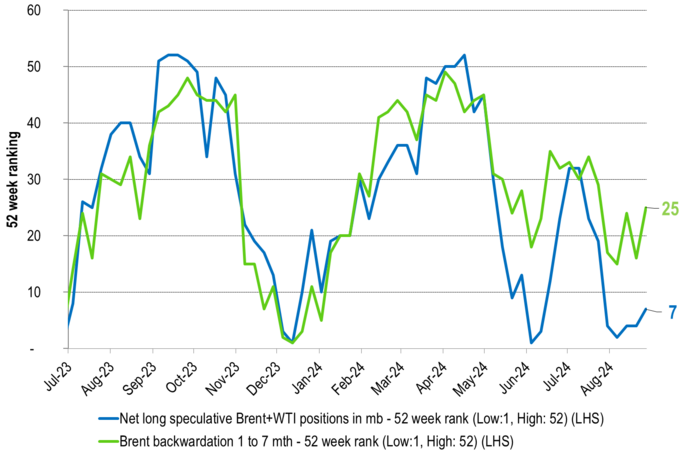
52 week ranking of Net long specs in Brent + WTI and ranking of Brent crude curve backwardation
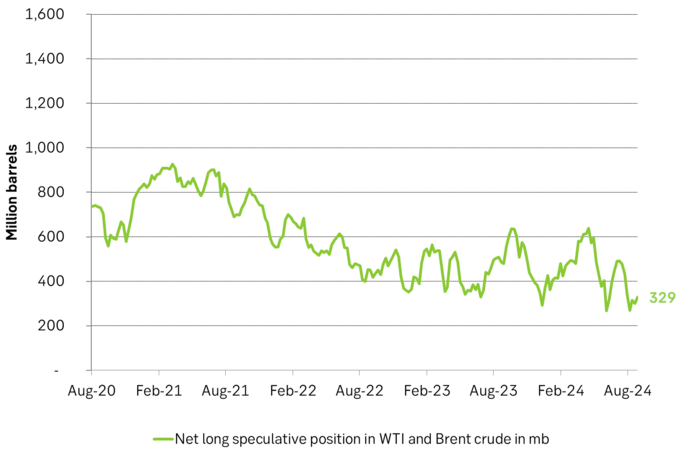
Net long spec for Brent + WTI in million barrels
Historical average Brent crude oil prices per month since 2008 in nominal USD/b
Brent crude 400 day rolling High-Low price spread in USD/b difference
Total US commercial crude and product stocks in million barrels
Global, floating crude oil stocks in million barrels.
Analys
Physical easing. Iran risk easing. But Persian Gulf risk cannot fully fade before US war ships are pulled away
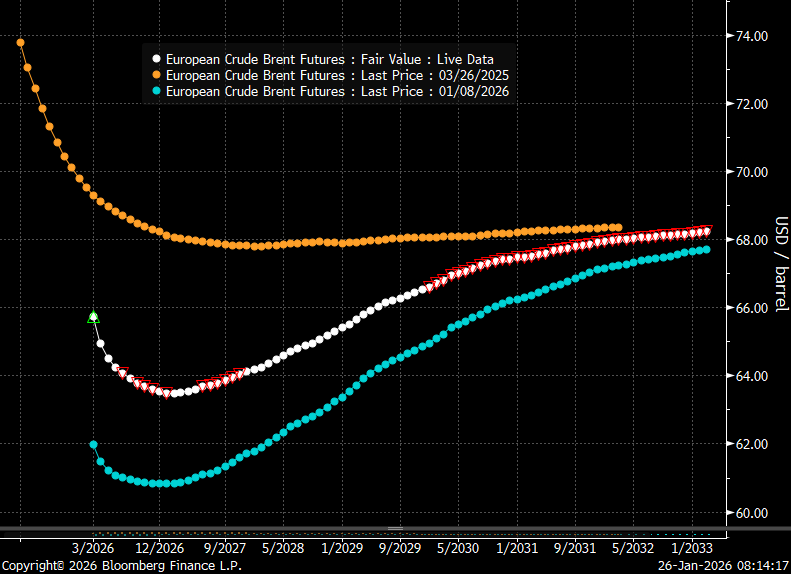
Traded down 3.7% last week as Iranian risk faded a bit. Brent crude traded in a range of $65.19 – 69.76/b last week. In the end it traded down 3.7% with a close of $68.05/b. It was unable to challenge the peak of $71.89/b from the previous week when the market got its first nervous shake as Trump threatened Iran with an armada of US war ships.
The market has started to cool down a bit with US and Iran in talks in Oman on Friday and Brent crude is easing 0.9% this morning to $67.4/b in an extension of that. As we have stated before we think the probability is very low for a scenario where the US attacks Iran in such a way that it risks an uncontrollable escalation with possible large scale disruption of oil out of the Strait of Hormuz and thus a massive spike in the oil price. That would endanger Trump’s mid-term election which is already challenged with unhappy US voters complaining about affordability and that Trump is spending too much time on foreign issues.
A statement by Trump last week that India had agreed not to buy Russian crude turns out to have little substance as India has agreed to no such thing on paper. The statement last week naturally supported oil prices as the market is already struggling with a two tire market with legal versus illegal barrels. There is a lot of friction in the market for sanctioned crude oil barrels from Iran and Russia. If India had agreed not to buy Russian crude oil then the market for legal barrels would have been tighter.
The physical market has been tighter than expected. And the recent concerns over Iranian risk has come on top of that. The market is probably starting calm down regarding the Iranian risk. But the physical tightness is also going to ease gradually over the coming couple of weeks. CPC blend exports averaged 1.5 mb/d last year, but were down to less than 1 mb/d in January due to a combination of factors. Drone attacks by Ukraine in late November. The Tengiz field has been disrupted by fires. Adverse winter weather has also been a problem. US crude oil production has also been disrupted by a fierce winter storm. But these issues are fading with supply reviving over the next couple of weeks.
The physical tightness is likely going to ease over the next couple of weeks. The market may also have started to get used to the Iranian situation. But the Iranian risk premium cannot be fully defused as long as US warships are located where they are with their guns and rockets pointing towards Iran.
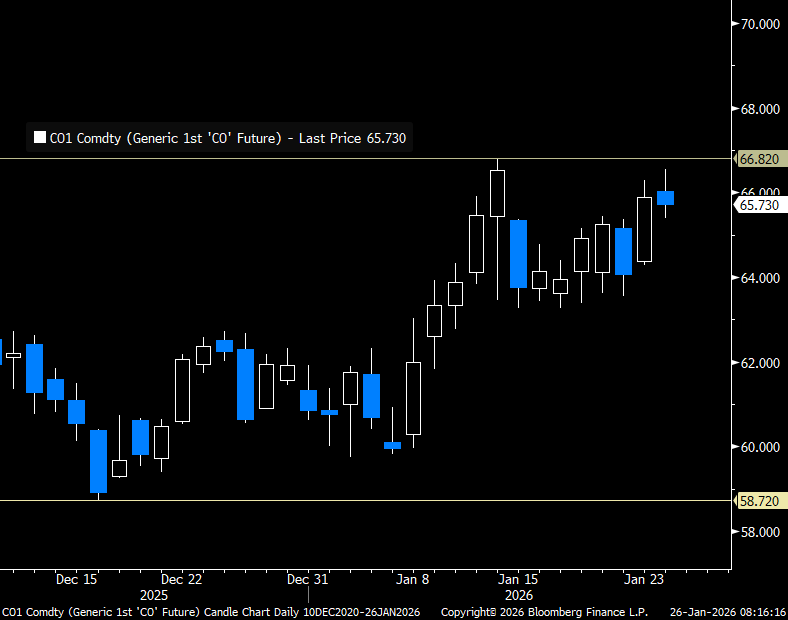
Brent crude rose 2.7% last week to $65.88/b with a gain on Friday of 2.8%. Unusually cold US winter weather with higher heating oil demand and likely US oil supply outages was probably part of the bullish drive at the end of last week. But US threats towards Iran with USS Abraham Lincoln being deployed to the Middle East was probably more important.
Brent crude has maintained the gains it got from 8 January onwards when it rose from the $60/b-line and up to around $65/b on the back of Iranian riots where the US added fuel to the fire by threatening to attack Iran in support of the rioters. This morning Brent has tested the upside to $66.54/b. That is short of the $66.82/b from 14 January and Brent has given back part of the early gains this morning and is currently trading close to unchanged versus Friday’s close with a dollar decline of 0.4% not enough to add much boost to the price yet at least.
Brent crude front-month prices in USD/b
The rally in Brent crude from the $60/b-line to its current level of $65-66/b seems to be tightly linked to an elevated risk of the US attacking Iran in support of the rioters. Bloomberg reported on Saturday that the US has dispatched the USS Abraham Lincoln aircraft carrier and its associated strike group to the Middle East. It is a similar force which the US deployed to the Caribbean Sea just weeks before the 3 January operation where Maduro was captured. The probability of a US/Israeli attack on Iran is pegged at 65-70% by geopolitical risk assessment firms Eurasia Group and Rapidan Energy Group. Such a high probability explains much of the recent rally in Brent crude.
The recent rally in Brent crude is not a signal from the oil market that the much discussed global surplus has been called off. If we look at the shape of the Brent crude oil curve it is currently heavily front-end backwardated with the curve sloping upwards in contango thereafter. It signals front-end tightness or near term geopolitical risk premium followed by surplus. If the market had called off the views of a surplus, then the whole Brent forward curve would have been much flatter and without the intermediate deep dip in the curve. The shape of the Brent curve is telling us that the market is concerned right now for what might happen in Iran, but it still maintains and overall view of surplus and stock building unless OPEC+ cuts back on supply.
It also implies that Brent crude will fall back if the US pulls back from its threats of attacking Iran.
Brent crude forward curves in USD/b.
Falling back this morning. Brent crude traded from an intraday low of $59.75/b last Monday to an intraday high of $63.92/b on Friday and a close that day of $63.34/b. Driven higher by the rising riots in Iran. Brent is trading slightly lower this morning at $63.0/b.
Iranian riots and risk of supply disruption in the Middle East takes center stage. The Iranian public is rioting in response to rapidly falling living conditions. The current oppressive regime has been ruling the country for 46 years. The Iranian economy has rapidly deteriorated the latest years along with the mismanagement of the economy, a water crisis, encompassing corruption with the Iranian Revolutionary Guard Corps at the center and with US sanctions on top. The public has had enough and is now rioting. SEB’s EM Strategist Erik Meyersson wrote the following on the Iranian situation yesterday: ”Iran is on the brink – but of what?” with one statement being ”…the regime seems to lack a comprehensive set of solutions to solve the socioeconomic problems”. That is of course bad news for the regime. What can it do? Erik’s takeaway is that it is an open question what this will lead to while also drawing up different possible scenarios.
Personally I fear that this may end very badly for the rioters. That the regime will use absolute force to quash the riots. Kill many, many more and arrest and torture anyone who still dare to protest. I do not have high hopes for a transition to another regime. I bet that Iranian’s telephone lines to its diverse group of autocratic friends currently are running red-hot with ”friendly” recommendations of how to quash the riots. This could easily become the ”Tiananmen Square” moment (1989) for the current Iranian regime.
The risks to the oil market are:
1) The current regime applies absolute force. The riots die out and oil production and exports continue as before. Continued US and EU sanctions with Iranian oil mostly going to China. No major loss of supply to the global market in total. Limited impact on oil prices. Current risk premium fades. Economically the Iranian regime continues to limp forward at a deteriorating path.
2) The regime applies absolute force as in 1), but the US intervenes kinetically. Escalation ensues in the Middle East to the point that oil exports out of the Strait of Hormuz are curbed. The price of oil shots above $150/b.
3) Riots spreads to affect Iranian oil production/exports. The current regime does not apply sufficient absolute force. Riots spreads further to affect oil production and export facilities with the result that the oil market loses some 1.5 mb/d to 2.0 mb/d of exports from Iran. Thereafter a messy aftermath regime wise.
Looking at the oil market today the Brent crude oil price is falling back 0.6% to $63/b. As such the oil market is assigning very low risk for scenario 2) and probably a very high probability for scenario 1).
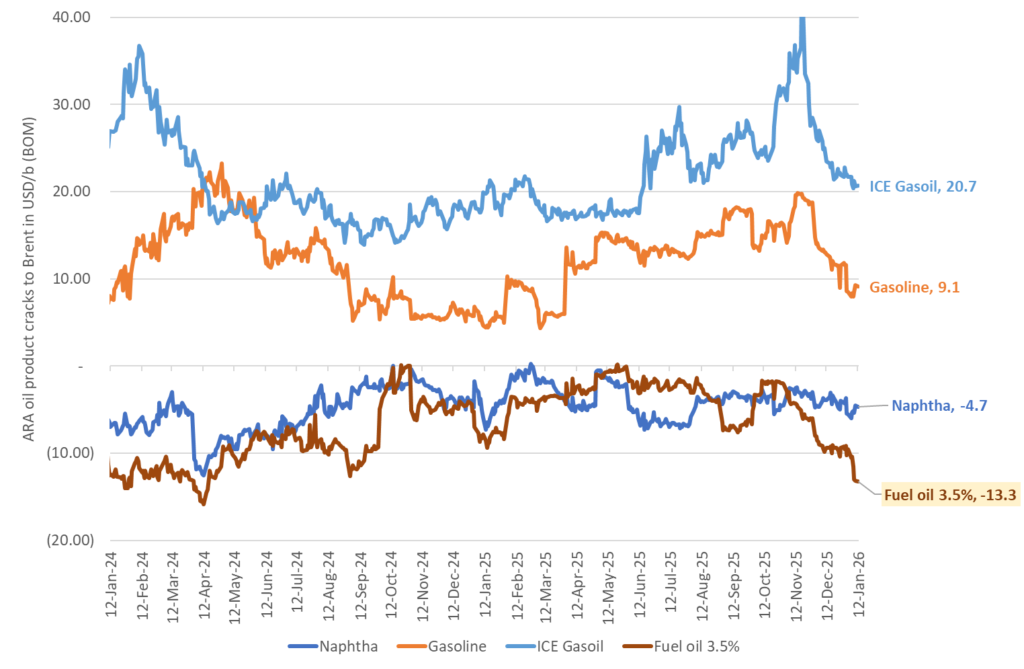
Venezuela: Heavy sour crude and product prices falls sharply on prospect of reduced US sanctions on Venezuelan oil exports. The oil market take on Venezuela has quickly shifted from fear of losing what was left of its production and exports to instead expecting more heavy oil from Venezuela to be released into the market. Not at least easier access to Venezuelan heavy crude for USGC refineries. The US has started to partially lift sanctions on Venezuelan crude oil exports with the aim of releasing 30mn-50mn bl of Venezuelan crude from onshore and offshore stocks according to the US energy secretary Chris Wright. But a significant increase in oil production and exports is far away. It is estimated that it will take $10bn in capex spending every year for 10 years to drive its production up by 1.5 mb/d to a total of 2.5 mb/d. That is not moving the needle a lot for the US which has a total hydrocarbon liquids production today of 23.6 mb/d (2025 average). At the same time US oil majors are not all that eager to invest in Venezuela as they still hold tens of billions of dollars in claims against the nation from when it confiscated their assets in 2007. Prices for heavy crude in the USGC have however fallen sharply over the prospect of getting easier access to more heavy crude from Venezuela. The relative price of heavy sour crude products in Western Europe versus Brent crude have also fallen sharply into the new year.
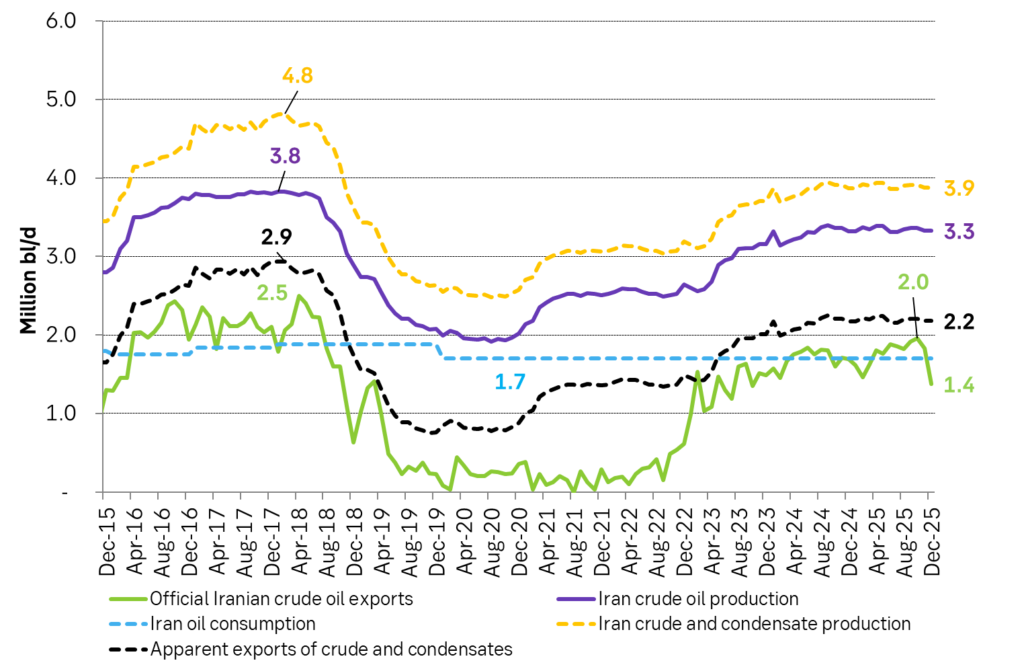
Iran officially exported 1.75 mb/d of crude on average in 2025 falling sharply to 1.4 mb/d in December. But it also produces condensates. Probably in the magnitude of 0.5-0.6 mb/d. Total production of crude and condensates probably close to 3.9 mb/d.
The price of heavy, sour fuel oil has fallen sharply versus Brent crude the latest days in response to the prospect of more heavy sour crude from Venezuela.


Ett samtal om ädelmetaller ur ett längre perspektiv
Physical easing. Iran risk easing. But Persian Gulf risk cannot fully fade before US war ships are pulled away

Under 2025 byggde Kina klart 78 GW ny kolkraft

Samtal om den senaste tidens råvarurörelser

Kall och nederbördsfattig månad driver upp elpriset

Silverpriset stiger över 100 USD per uns

Guldpriset stiger till över 5000 USD per uns

Samtal om guld och andra råvaror när flera priser rusar i höjden

Christian Kopfer om marknadens olika råvaror

Silver utgör nu 30 procent av kostnaden för att producera solcellspaneler
-
 Nyheter4 veckor sedan
Silverpriset stiger över 100 USD per uns
-
 Nyheter3 veckor sedan
Guldpriset stiger till över 5000 USD per uns
-
 Nyheter3 veckor sedan
Samtal om guld och andra råvaror när flera priser rusar i höjden
-
 Nyheter4 veckor sedan
Christian Kopfer om marknadens olika råvaror
-
 Nyheter3 veckor sedan
Silver utgör nu 30 procent av kostnaden för att producera solcellspaneler
-
 Nyheter2 veckor sedan
Kall och nederbördsfattig månad driver upp elpriset
-

 Nyheter3 veckor sedan
Indien kommer inte att göra slut med kol
-

 Nyheter3 veckor sedan
Kylan lyfter elpriset i vinter, minst 40 procent högre än väntat