

Analys
Brent and WTI – A tale of two benchmarks


Brent and West Texas Intermediate (WTI) are two globally recognised oil benchmarks. When market participants refer to the price of oil, they typically refer to one or the other or both. But despite having quite similar chemical properties, there are important distinguishing features between the two. Financial markets recognise these differences and, as a result, price the two differently. The two benchmarks have contrasting features in terms of where the oil is produced, how it is stored and transported and the way it is traded in international markets. These differences not only explain the historical price discrepancy between the two, but also help us understand why the two have behaved differently during the coronavirus pandemic and the ensuing market volatility. This article will contrast the distinguishing features between the two and, after developing a new lens to view the two benchmarks, replay the recent episode when WTI prices crashed into negative territory. The article will conclude by outlining the forces which will shape the fluid commodity going forward.
Same, same, but different
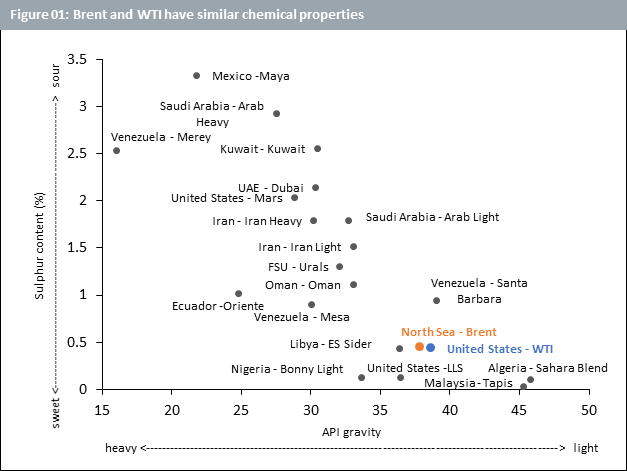
In ‘A tale of Two Cities’ by Charles Dickens, Sydney Carton sacrifices his life to save Charles Darnay, who is married to the woman Carton loves, by taking his place in prison moments before he is taken to the guillotine during the French revolution. He is able to pull off this selfless act of bravery thanks to the uncanny resemblance between him and Darnay. Similarly, most people would not be able to tell the difference if a barrel of WTI was replaced with one for Brent given the likeness between the two. Both Brent and WTI are referred to as light and sweet. They are ‘light’ in terms of the American Petroleum Institute (API) gravity. Having an API gravity greater than 10 makes them light and allows them to float on water, while an API gravity of less than 10 would have caused them to sink. Similarly, both have low sulphur content making them ‘sweet’ and easy to refine (See Figure 01).
But while Carton and Darnay looked alike, they were distinctly different individuals. Brent and WTI too, despite their resemblance, have their disparities. Brent Crude is extracted from the North Sea. Oil production from Europe, Africa and the Middle East tends to use Brent as its main benchmark. This accounts for around two-thirds of internationally traded crude oil. The Organisation of the Petroleum Exporting countries (OPEC), an intergovernmental organisation comprising 13 key oil producing countries as well as their 10 partner countries (collectively referred to as OPEC+), also typically use Brent as their oil price benchmark. In contrast, WTI is sourced primarily from Texas and most oil production in the US uses WTI as its main benchmark.
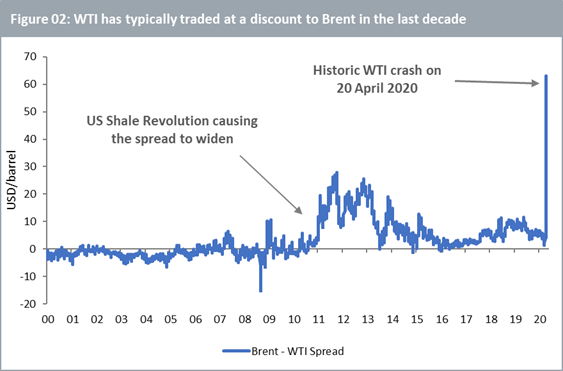
Brent and WTI have always traded at different prices giving rise to the Brent – WTI spread (Figure 02). Purely in terms of quality, WTI has a slight edge over Brent on account of its lower sulphur content making it moderately ‘sweeter’ and thus easier to refine. For this reason, WTI ought to theoretically trade at a premium over Brent. For a large part of the first decade of this century, WTI did indeed trade at a premium, i.e. the Brent – WTI spread was negative. Over the last decade however, the shale revolution in the US has brought large volumes of oil into the market making the US one of the largest oil producers in the world. The shale revolution refers to a combination of technological improvements and financial infrastructure enabling the US to produce oil from low-permeable shale, sandstone and carbonate rock formations in larger quantities than ever before. The shale oil industry has grown rapidly since 2011 and accounted for 63% of total US crude oil production in 2019 (according to the US Energy Information Administration). In line with economic principles of demand and supply, as the total volume of oil production increased in the US, this put downward pressure on WTI. The Brent – WTI spread has generally been positive in the last decade.
Another reason for the Brent – WTI spread is the logistical challenge for the US to transport oil from landlocked production hubs through a network of pipelines and to ship it overseas. This impinges on the overseas demand for oil from the US (WTI). In contrast, Brent is produced at or closer to sea making it easier for it to reach its overseas destinations. The US is however investing heavily in its pipeline infrastructure to enable it to send large vessels of oil from its shores to international buyers. Several such infrastructure projects are expected to be completed by 2021-2022 when we might see an increase in demand for WTI and thus a narrowing of its spread with Brent.
The historic WTI crash
The explanation above of the spread between the two benchmarks omits any discussion about the unprecedented spike on 20 April 2020. This section will unravel the story behind the anomalous occurrence.
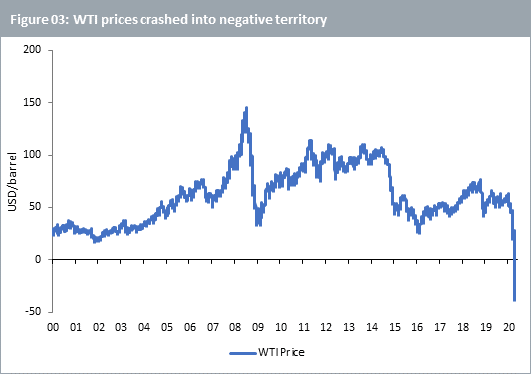
On Monday 20 April 2020, markets witnessed a historic crash in WTI prices (Figure 03). The crash occurred a day before the active Nymex WTI futures contract was due to expire. This contract, meant to deliver oil between 01 May and 31 May, crashed into negative territory as oil storage in the US became very tight. With the coronavirus pandemic causing considerable oil demand destruction putting entire countries in lockdown and bringing economic activity to a grinding halt, the reduction in oil production was not enough to balance the market creating a supply glut. The main delivery and settlement point in Cushing, Oklahoma was approaching its storage limit with any additional capacity likely already leased out or earmarked for other purposes. This acute pressure, so close to contract expiry at the point where contracts settle, contributed to the negative price. Those taking physical delivery from the expiring futures contract were being paid to take the oil and find a place to store it. The May contract expired the following day in slightly positive territory. When the June contract became the active contract upon the May contract’s expiry, prices recovered further as the issue of June deliveries creating the same problem was less worrying, at least at that point.
But Brent did not endure a similar crash. The main reason for this is that WTI, traded on the New York Mercantile Exchange (NYMEX), is a deliverable futures contract. Thus, upon expiry, the holder of the futures contract takes delivery of the underlying, i.e. barrels of oil. Brent however, traded on the Intercontinental Exchange (ICE), has a cash settlement procedure whereby the holder of the futures contract need not take delivery of the underlying upon expiry. Therefore, storage issues create a more direct risk to investors in WTI futures.
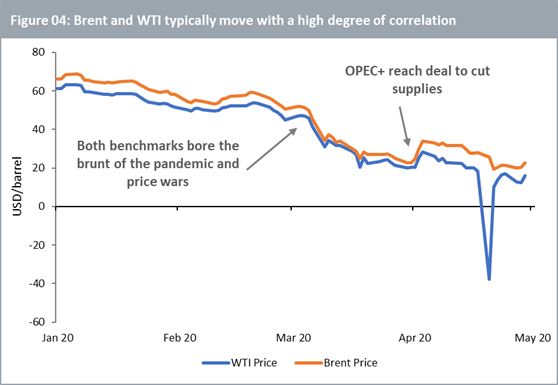
Outside of this idiosyncrasy pertaining to futures trading, the two benchmarks generally move with a high degree of correlation (Figure 04). At the peak of the coronavirus pandemic’s acceleration in April, a third of global oil demand was wiped out. Soon thereafter, major oil producers Saudi Arabia and Russia engaged in a price war. This created a double shock for oil as the suppliers opened the floodgates at a time when demand had just crashed. Both benchmarks experienced severe price weakness. But as policy decisions from OPEC+ can be expected to impact Brent prices more than WTI, the deal reached by the group at the start of April to cut suppliesprovided slightly more cushioning to Brent.
What happens next?
With a deeper understanding of the drivers of the two benchmarks, historic and recent price behaviour makes more sense. But the all-important question is, “what happens next?”. The fate of oil prices rests heavily on how quickly the world can overcome the pandemic and get the economic engines firing again. Volatility in oil prices may persist in the coming weeks, or even months, until uncertainty with regards to the pandemic and lockdowns diminishes. The relative price behaviour of WTI and Brent during this period will depend on the degree to which producers in the US and OPEC+ cut supplies to balance the market.
We however hope to paint a more optimistic picture of the world in the second half of this year. Oil prices may not recover quickly to where they were in February this year due to an overhang of excess supply, a fractured OPEC+ and a dented global economic engine. Nonetheless, after all the pain, the world will eventually return to some semblance of normalcy. Manufacturers will switch their machines on again, cars will return to the roads and aeroplanes will return to the skies. Once again, oil is expected to be in demand. And while one protagonist had to sacrifice himself to save the other in the tale told by Dickens, we expect both mainstays from the tale of two benchmarks to rise again when the crisis is over.
Mobeen Tahir, Associate Director, Research, WisdomTree
DISCLAIMER
This material is prepared by WisdomTree and its affiliates and is not intended to be relied upon as a forecast, research or investment advice, and is not a recommendation, offer or solicitation to buy or sell any securities or to adopt any investment strategy. The opinions expressed are as of the date of production and may change as subsequent conditions vary. The information and opinions contained in this material are derived from proprietary and non-proprietary sources. As such, no warranty of accuracy or reliability is given and no responsibility arising in any other way for errors and omissions (including responsibility to any person by reason of negligence) is accepted by WisdomTree, nor any affiliate, nor any of their officers, employees or agents. Reliance upon information in this material is at the sole discretion of the reader. Past performance is not a reliable indicator of future performance.

Market is starting to take US/Iran headlines with a pinch of salt. Brent crude rose $2.8/b yesterday to an official close of $112.1/b. But after that it traded as low as $108.05/b before ending late night at around $109.7/b. Through the day it traded in a range of $106.87 – 112.72/b amid a flurry of news or rumors from Iran and the US. ”US temporary sanctions during negotiations” (falls alarm). ”We will bomb Iran” (not anyhow),… etc. While the market is still fluctuating to this kind of news flow, it is starting to take such headlines with a pinch of salt.

We’ll see. Maybe, maybe not. The Brent M1 contract is trading at $110.2/b this morning which very close to the average ticks through yesterday of $110.4/b.
Trump with bearish, verbal intervention whenever Brent trades above $110/b it seems. What seems to be a pattern is that Trump states something like ”very good negotiations going on with Iran”, ”New leaders in Iran are great,..”, ”Great progress in negotiations,…”, ”Deal in sight,..” etc whenever the Brent M1 contract trades above $110/b. An effort to cool the market. These hot air verbal interventions from Trump used to have a heavy bearish impact on prices, but they now seems to have less and less effect unless they are backed by reality.
As far as we can see there has been no real progress in the negotiations between the US and Iran with both sides still standing by their previous demands.
Iran is getting stronger while the cease fire lasts making a return to war for Trump yet harder. Iran is naturally in constant preparation for a return to war given Trump’s steady threats of bombing Iran again. Iran is naturally doing what ever is possible to prepare for a return to war. And every day the cease fire lasts it is better prepared. This naturally makes it more and more difficult and dangerous for the US to return to warring activity versus Iran as the consequences for energy infrastructure in the Persian Gulf will be more and more severe the longer the cease fire lasts. Israel seems to see it this way as well. That the war is not won and that current frozen state of a cease fire gives Iran opportunity to rebuild military and politically.
Global inventories are drawing down day by day. How much? In the meantime the Strait of Hormuz stays closed. There is varying measures and estimates of how much global inventories are drawing down. Our rough estimate, back of the envelope, is that global inventories are drawing down by at least some 10 mb/d or about 300 mb/d in a balance between loss of supply versus demand destruction. Other estimates we see are a monthly draw of 250-270 mb/d. The IEA only ’measured’ a draw in global observable stocks of 117 mb in April with oil on water rising 53 mb while on shore stocks fell 170 mb. But global stocks are hard to measure with large invisible, unmeasured stocks. As such a back of the envelope approach may be better.
Oil products is what the world is consuming. Oil product prices likely to rise while product stocks fall. Strategic Petroleum Reserves (SPR) are predominantly crude oil. Discharging oil from OECD SPR stocks, a sharp reduction in Chinese crude imports and a reduction in global refinery throughput of 6-7 mb/d has helped to keep crude oil markets satisfactorily supplied. But global inventories are drawing down none the less. And oil products is really what the world is consuming. So if global refinery throughput stays subdued, then demand will eventually have to match the supply of oil products. The likely path forward this summer is a steady draw down in jet fuel, diesel and gasoline. Higher prices for these. Then, if possible, higher refinery throughput and higher usage of crude in response to very profitable refinery margins. And lastly sharper draw in crude stocks and higher prices for these. But some 6 mb/d of oil products used to be exported through the Strait of Hormuz. And it may not be so easy to ramp up refinery activity across the world to compensate. Especially as Ukraine continues to damage Russian refineries as well as Russian crude production and export facilities.
Watch oil product stocks and prices as well as Brent calendar 2027. What to watch for this summer is thus oil product inventories falling and oil product premiums to crude rising. Another measure to watch is the Brent crude 2027 contract as it rises steadily day by day as the Strait of Hormuz stays closed and global oil inventories decline. The latter is close to the highest level since the start of the war and keeps rising.
The Brent M1 contract and the Brent 2027 prices and current price of jet fuel in Europe (ARA). All in USD/b

Our back of the envelope calculation of the global shortage created by the closure of the Strait of Hormuz. Note that 3.5 mb/d of discharge from SPR is also a draw. Note also that ’Forced demand loss’ of 2.5 mb/d is probably temporary and will fall back towards zero as logistics are sorted out leaving ’Price demand loss’ to do the job of balancing the market. Thus a shortfall of at least 9 mb/d created by the closure. More if SPR discharge is included and more if Forced demand loss recedes.

Brent is climbing higher. Front-month is at USD 106.3/bl this morning, close to a weekly high and a USD 9/bl jump from Mondays open. This is the move we flagged as a risk earlier in the week: the market shifting from ”a deal is around the corner” to ”this is going to take longer than we thought”.

Analyst Commodities, SEB
During April, rest-of-year Brent remained remarkably stable around USD 90/bl. A stability which rested on one single assumption: the SoH reopens around 1 May. That assumption is now slowly falling apart.
As we highlighted yesterday: every week of delay beyond 1 May adds (theoretically) ish USD 5/bl to the rest-of-year average, as global inventories draw 100 million barrels per week. i.e., a mid-May reopening implies rest-of-year Brent closer to USD 100/bl, and anything pushing into June or July takes us meaningfully higher.
What’s changed in the last 48 hours:
#1: The US military has formally warned that clearing suspected sea mines from SoH could take up to six months. That is a completely different timescale from what the financial market is pricing. Even a political deal tomorrow does not immediately reopen the strait.
#2: Trump has shifted his tone from urgency to ”strategic patience”. In yesterday’s press conference: ”Don’t rush me… I want a great deal.” The market is reading this as a president no longer feeling pressured by timelines, with the naval blockade running in the background.
#3: So far, the military activity is escalating, not de-escalating. Axios reports Iran is laying more mines in SoH. The US 3rd carrier strike group (USS George H.W. Bush) is arriving with two countermine vessels. Trump yesterday ordered the US Navy to destroy any Iranian boats caught laying mines. While CNN reports that the Pentagon is actively drawing up plans to strike Iranian SoH capabilities and individual Iranian military leaders if the ceasefire collapses. i.e., NOT a attitude consistent with an imminent deal!
Spot crude and product prices eased off the early-April highs on a combination of system rerouting and deal optimism. Both now weakening. Goldman estimates April Gulf output is reduced by 14.5 mbl/d, or 57% of pre-war supply, a number that keeps getting worse the longer this drags on.
Demand-side adaptation is ongoing: S. Korea has cut its Middle East crude dependence from 69% to 56% by pulling more from the Americas and Africa, and Japan is kicking off a second round of SPR releases from 1 May. But SPRs are finite.
Ref. to the negotiations, we should not bet on speed. The current Iranian leadership is dominated by genuine hardliners willing to absorb economic pain and run the clock to extract concessions. That is not a setup for a rapid resolution. US/Israeli media briefings keep framing the delay as ”internal Iranian divisions”, the reality is more complicated and points toward weeks and months, not days.
Our point is that the complexity is large, and higher prices have only just started (given a scenario where the negotiations drag out in time). The market spent April leaning on the USD 90/bl rest-of-year assumption; that case is diminishing by the hour. If ”early May reopening” is replaced by ”June, July or later” over the next week or two, both crude and products have meaningful room to reprice higher from here. There is a high risk being short energy and betting on any immediate political resolution(!).
Down on Friday. Up on Monday. The Brent June crude oil contract traded down 5.1% last week to a close of $90.38/b. It reached a high of $103.87/b last Monday and a low of $86.09/b on Friday as Iran announced that the Strait of Hormuz was fully open for transit. That quickly changed over the weekend as the US upheld its blockade of Iranian oil exports while Iran naturally responded by closing the SoH again. The US blew a hole in the engine room of the Iranian ship TOUSKA and took custody of the ship on Sunday. Brent crude is up 5.6% this morning to $95.4/b.
The cease-fire is expiring tomorrow. The US has said it will send a delegation for a second round of negotiations in Islamabad in Pakistan. But Iran has for now rejected a second round of talks as it views US demands as unrealistic and excessive while the US is also blocking the Strait of Hormuz.
While Brent is up 5% this morning, the financial market is still very optimistic that progress will be made. That talks will continue and that the SoH will fully open by the start of May which is consistent with a rest-of-year average Brent crude oil price of around $90/b with the market now trading that balance at around $88/b.
Financial optimism vs. physical deterioration. We have a divergence where the financial market is trading negotiations, improvements and resolution while at the same time the physical market is deteriorating day by day. Physical oil flows remain constrained by disrupted flows, longer voyage times and elevated freight and insurance costs.
Financial markets are betting that a US/Iranian resolution will save us in time from violent shortages down the road. But every day that the SoH remains closed is bringing us closer to a potentially very painful point of shortages and much higher prices.
The US blockade is also a weapon of leverage against its European and Asian allies. When Iran closed the SoH it held the world economy as a hostage against the US. The US blockade of the SoH is of course blocking Iranian oil exports. But it is also an action of disruption directed towards Europe and Asia. The US has called for the rest of the world to engaged in the war with Iran: ”If you want oil from the Persian Gulf, then go and get it”. A risk is that the US plays brinkmanship with the global oil market directed towards its European and Asian allies and maybe even towards China to force them to engage and take part. Maybe unthinkable. But unthinkable has become the norm with Trump in the White House.


Sommarväder skapar prisrally på elbörsen
Oil product price pain is set to rise as the Strait of Hormuz stays closed into summer

Solkraften pressar elpriserna dagtid

Michel Gubel ger sin syn på oljemarknaden